Fig. 6
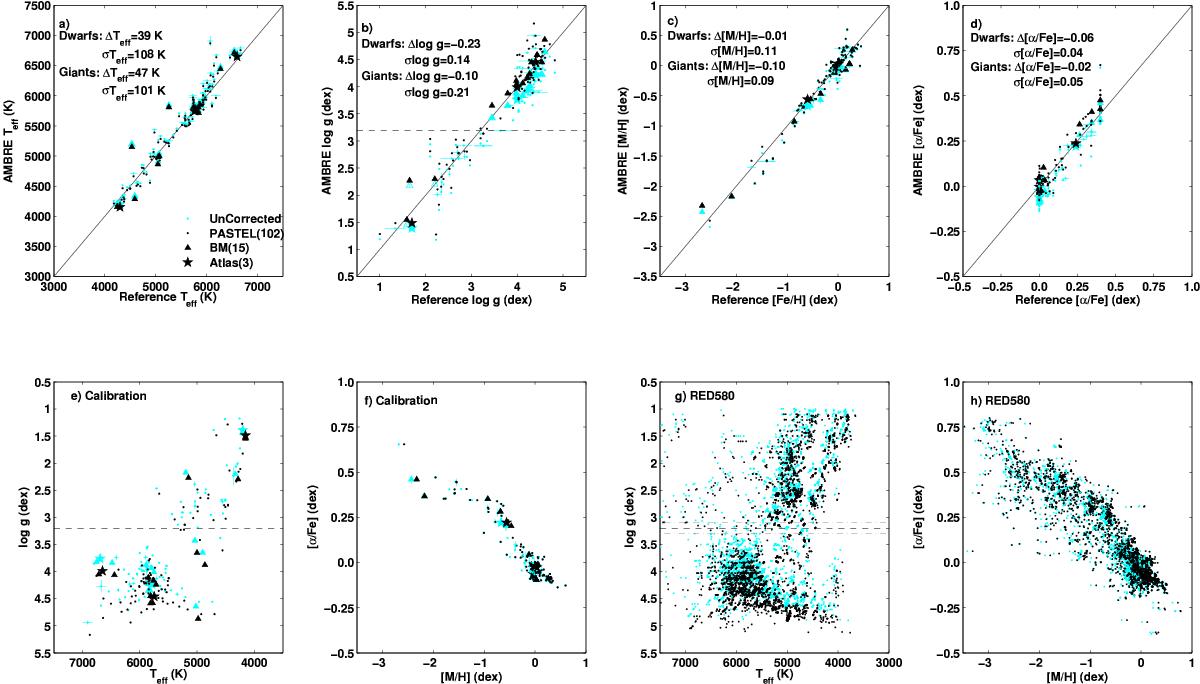
Comparison of AMBRE results of parameters determination for RED580 PASTEL, benchmark and atlas samples with accepted values. a)Teff; b) log g; c) [Fe/H] vs. [M/H]; d) [α/Fe] vs. α-relation; e) HR diagram – calibration; f) [M/H] vs. [α/Fe] – calibration; g) RED580 HR diagram; h) RED580 [M/H] vs. [α/Fe]. Raw results are in cyan, bias-corrected results are in black. The black dashed line shows the log g limit used to separate giants and dwarfs. The grey dot-dashed lines indicate the crossover region.
Current usage metrics show cumulative count of Article Views (full-text article views including HTML views, PDF and ePub downloads, according to the available data) and Abstracts Views on Vision4Press platform.
Data correspond to usage on the plateform after 2015. The current usage metrics is available 48-96 hours after online publication and is updated daily on week days.
Initial download of the metrics may take a while.