| Issue |
A&A
Volume 590, June 2016
|
|
|---|---|---|
| Article Number | A96 | |
| Number of page(s) | 6 | |
| Section | Interstellar and circumstellar matter | |
| DOI | https://doi.org/10.1051/0004-6361/201628281 | |
| Published online | 20 May 2016 | |
Resolving the inner disk of UX Orionis ⋆
1 University of Exeter, Astrophysics Group, Stocker Road, Exeter, EX4 4QL, UK
e-mail: This email address is being protected from spambots. You need JavaScript enabled to view it.
2 Max-Planck-Institut für Radioastronomie, Auf dem Hügel 69, 53121 Bonn, Germany
3 Pulkovo Observatory of RAS, Pulkovskoe shosse 65, 196140 St. Petersburg, Russia
4 V.V. Sobolev Astronomical Institute, St. Petersburg University, 196140 St. Petersburg, Russia
5 Kyoto Sangyo University, Motoyama, Kamigamo, 603-8555 Kita-ku, Kyoto, Japan
Received: 9 February 2016
Accepted: 5 April 2016
Abstract
Aims. The cause of the UX Ori variability in some Herbig Ae/Be stars is still a matter of debate. Detailed studies of the circumstellar environment of UX Ori objects (UXORs) are required to test the hypothesis that the observed drop in photometry might be related to obscuration events.
Methods. Using near- and mid-infrared interferometric AMBER and MIDI observations, we resolved the inner circumstellar disk region around UX Ori.
Results. We fitted the K-, H-, and N-band visibilities and the spectral energy distribution (SED) of UX Ori with geometric and parametric disk models. The best-fit K-band geometric model consists of an inclined ring and a halo component. We obtained a ring-fit radius of 0.45 ± 0.07 AU (at a distance of 460 pc), an inclination of 55.6 ± 2.4°, a position angle of the system axis of 127.5 ± 24.5°, and a flux contribution of the over-resolved halo component to the total near-infrared excess of 16.8 ± 4.1%. The best-fit N-band model consists of an elongated Gaussian with a HWHM ~ 5 AU of the semi-major axis and an axis ration of a/b ~ 3.4 (corresponding to an inclination of ~72°). With a parametric disk model, we fitted all near- and mid-infrared visibilities and the SED simultaneously. The model disk starts at an inner radius of 0.46 ± 0.06 AU with an inner rim temperature of 1498 ± 70 K. The disk is seen under an nearly edge-on inclination of 70 ± 5°. This supports any theories that require high-inclination angles to explain obscuration events in the line of sight to the observer, for example, in UX Ori objects where orbiting dust clouds in the disk or disk atmosphere can obscure the central star.
Key words: techniques: interferometric / stars: pre-main sequence / stars: variables: T Tauri, Herbig Ae/Be / stars: individual: UX Ori
Based on observations made with ESO telescopes at Paranal Observatory under program IDs: 090.C-0769, 074.C-0552.
© ESO, 2016
1. Introduction
The UX Ori type stars (or UXORs) are a class of photometrically active young objects, predominantly Herbig Ae stars and some amount of young F and G stars (see, e.g., Herbst et al. 1994). The typical light curve of UXORs exhibits aperiodic algol-like minima with a typical V-band drop of ΔV ~ 2−3 mag with a duration from a few to a few tens of days. The brightness minima are accompanied with an increase of the linear polarizations and spectroscopic variations (see review by Grinin 2000, and references therein). Several different explanations for this variability have been suggested. One explanation assumes that the brightness variations are linked to obscurations of the central star by orbiting dust clouds in an almost edge-on disk (Grinin et al. 1991; Natta et al. 1997). Dynamical effects like gravitating bodies might also lead to regular perturbations of the density structure in the disk (see, e.g., de Wit et al. 2013). Turbulent filaments at the location of the puffed-up inner rim might create obscuration events (Dullemond et al. 2003). The clumps of dust in the dusty outflow may occasionally intercept the line of sight (Vinković & Jurkić 2007). The model of the variable circumstellar (CS) extinction with the account of scattered radiation (Grinin 1988) gives the most natural explanation of the observed phenomena. The high linear polarization observed systematically during the deep minima motivated us to assume that the violent photometric activity of UXORs is a result of the low inclination of the CS disks to the line of sight (Grinin et al. 1991). A different explanation of the UXOR physics was suggested by Herbst & Shevchenko (1999). They suggested that the photometric activity of UXORs does not depend on the disk orientation and is a result of the FUOR-like activity caused by the strong and unstable accretion activity of these stars.
Fortunately, interferometric observations of young stars permit us to measure the inclination of their CS disks relative to the line of sight. Detailed studies on the geometry and shape of the circumstellar dust distribution around UXORs are important to improve our understanding of the origin of the strong photometric variability. Therefore, we conducted infrared interferometric observations of UX Orionis, the prototype star of this sub-class of variable Herbig Ae/Be stars that allow us to resolve the structure of the inner disk on milliarcsecond (mas) scale.
Observation log of the VLTI/AMBER and VLTI/MIDI observations of UX Ori.
UX Ori is a well-studied Herbig Ae star with spectral type A3, located at a distance of ~460 pc, and it has a stellar mass of 2.3–2.5 M⊙ (Rostopchina 1999; Natta et al. 1999). Its stellar age estimates range from 2 to 4.8 Myr (Natta et al. 1999; Testi et al. 2001; Manoj et al. 2006). Millimeter interferometry suggests the existence of a compact circumstellar disk (<100 AU; Natta et al. 1999). Polarimetric observations during deep minima showed a linear V-band polarization angle of 125.5–128.7° (Voshchinnikov et al. 1988). The modeling of Hipparcos data lead to evidence of a binary nature of UX Ori and predicted a binary separation of ~20 mas with a position angle (PA) of ~260° (Bertout et al. 1999), which remains undetected by the spectro-astrometric survey of binary candidates by Wheelwright et al. (2010).
In this paper, we present near- and mid-infrared interferometric observations of the Herbig Ae star UX Ori. In Sect. 2 we describe our observations and the data reduction. In Sect. 3 we discuss our geometric and passive flared-disk modeling and the derived disk inclination of UX Ori. We show the results in Sect. 4 and present a conclusion in Sect. 5.
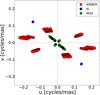 |
Fig. 1 uv coverage of our AMBER measurements (red), the archival MIDI measurements (green), and the KI measurements from the literature (blue). |
2. Observations and data reduction
We observed UX Ori with the AMBER instrument of the Very Large Telescope Interferometer (VLTI) using the UT configuration UT2-UT3-UT4 in December 2012 (see uv coverage in Fig. 1; red points). The AMBER instrument is a three-beam combiner that records spectrally dispersed three-beam interferograms (Petrov et al. 2007). We recorded H- and K-band interferograms in the low spectral resolution mode (R ~ 35) with a detector integration time (DIT) of 50 ms. For data reduction, we employed the software library amdlib v3.0.51. We selected 20% of the frames with the highest fringe signal-to-noise ratio (S/N; Tatulli et al. 2007) and applied a histogram equalization method for piston correction (Kreplin et al. 2012). The observation log is shown in Table 1. For modeling and interpretation, we complemented our near-infrared AMBER data with archival mid-infrared MIDI data (published in the survey paper of Menu et al. 2015). We re-reduced this data set of five MIDI measurements using custom IDL routines (Kishimoto et al. 2011) that incorporates parts of the standard software EWS2. In addition, we included K-band measurements of UX Ori with the Keck Interferometer (KI) from the literature (Monnier et al. 2005), illustrated in the uv coverage in Fig. 1 by green and blue points, respectively.
3. Modeling
To characterize the size and shape of the near- and mid-infrared emitting region of UX Ori, we fit geometric ring and Gaussian models to the observed visibilities. Because the measured AMBER closure phases are equal to zero (see Fig. 2), consistent with a centro-symmetric brightness distributions, we did not use them in further modeling steps since we exclusively applied centro-symmetric models in this paper.
The visibilities depend on both the flux of the unresolved central star and the circumstellar structure. Therefore, we first derived the visibility VCS of the circumstellar environment only (i.e., exclusive of the central star) 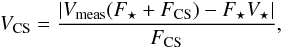 (1)where F⋆ is the stellar flux, FCS the circumstellar flux component, V⋆ the stellar visibility, and Vmeas the measured visibility. We set V⋆ = 1 because the central star is unresolved by the baselines used in our observation (stellar radius ~0.03 mas at d = 460 pc; Rostopchina 1999). The circumstellar-to-stellar flux ratio was derived for every spectral channel by fitting a Kurucz model (Kurucz 1979) to the spectral energy distribution (SED) data (Natta et al. 1999) of UX Ori. Because of the variable nature of the V-band flux of UX Ori, we took simultaneous photometric observations from 2012 December 18–30 to determine its brightness state. With a V magnitude between 10.5 and 9.5, UX Ori was found to be in a bright state during our near-infrared interferometric observations. For the fitting we used a Kurucz model with the following stellar parameters: Teff = 8600 K, log (g) = 4, log (Z/H) = −2.5 for a stellar radius of R⋆ = 2.7 R⊙ at a distance of d = 460 pc (Rostopchina 1999) . For the central wavelength in our H- and K-band data, we derived FCS/F⋆ = 5.5 for λ = 2.2 μm and FCS/F⋆ = 2.8 for λ = 1.7 μm. In Fig. 3 we plot the visibilities VCS.
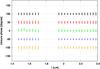 |
Fig. 2 Closure phases of the five AMBER measurements of UX Ori (see Table 1). For clarity, we separated the different data sets by 50 degree. All closure phases are close to zero, consistent with a centro-symmetric brightness distribution. |
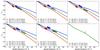 |
Fig. 3 Two-dimensional fit (colored lines) of a geometric model consisting of an inclined ring and a halo (see Table 2: inclined ring + elongated halo). The fitting included all derived K-band visibilities VCS (colored data points) of the circumstellar environment (i.e., exclusive of the central star; Eq. (1)), in other words, we fitted this two-dimensional ring + elongated halo model to all visibilities instead of fitting one-dimensional visibility models to the visibilities corresponding to a single PA. In gray we plot the visibility data Vmeas. All except the bottom right panel show the AMBER observations. The bottom right panel shows the KI measurement from Monnier et al. (2005). The two KI measurements are close together in position angle and baseline length and lie on top of each other and of the model curves. |
Best-fit geometric models of the K- and H-band visibilities.
3.1. Geometric models
3.1.1. AMBER data
We first fit a simple geometric ring model with a fractional ring width of 20% of the inner ring radius and with an inclination angle of 0° (i.e., seen face-on) to the near-infrared AMBER data. However, no successful fit to the K- and H-band data could be obtained (see high χ2 values in Table 2). Therefore, we decided to increase the complexity of the model and the number of free parameters (labeled #p in Table 2) step by step to find a best-fit model with the lowest number of parameters. We first added a completely over-resolved halo component (i.e., Vhalo = 0) to the above ring model. The flux ratio fh = Fhalo/ (FCS + Fhalo) between the flux Fhalo of the extended halo component and the total model flux leads to only one additional free parameter. In further steps, the size of the halo component is also a free parameter. To account for this extended component, we described the model visibility Vmodel by  (2)where Fhalo and Vhalo denote the flux and visibility of the halo component, respectively. We modeled different types of halos (see Table 2). First, we assumed the halo to be circular-symmetric and later to have the same elongation (due to inclination effects) and PA as the inclined ring component (called elongated halo in Table 2). In Table 2, the number of free parameters increases from the top to bottom (for each H- and K-individually; see #p in Col. 8). By introducing an over-resolved halo component, the
  value could be significantly reduced in K from 8.14 to 1.63 and in H from 22.93 to 8.05. The application of an inclined ring, with the three free parameters, radius r, inclination θgeo,NIR, and the position angle of the semi-minor axis Φgeo,NIR, led to a similar good fit. Only the combination of an inclined ring and an over-resolved halo component provides values close to 1 (see last three K-band models in Table 2). The H-band fit does not achieve such low χ2 values since the fit is more sensitive to the errors of the assumed stellar model and the H-band data suffer in general from a lower SNR. In summary, we found that a single ring, a single inclined ring or a ring + halo model were unable to fit the near-infrared visibilities well. By introducing an over-resolved component to the inclined ring model, the corresponding χ2 values are significantly reduced (see last three models in Table 2). The best fits are obtained with an inclined ring plus one of the halo models. The inclined ring plus elongated halo model is marginally the best and further work is based on that. The best-fit parameters of these two-dimensional geometric models are summarized in Table 2.
Best-fit parameters of the DDN-model.
3.1.2. MIDI data
To compare the near-infrared emitting structure of the hot inner disk regions of UX Ori to the outer mid-infrared disk structure, we first estimated the characteristic size of the mid-infrared-emitting region by fitting a two-dimensional Gaussian distribution. The free parameters are the size (half width at half maximum, HWHM), the elongation ratio (a/b) of the semi-major and -minor axis, and the position angle of the semi-minor axis Φgeo,MIR. Four MIDI measurements were conducted at a similar PA between ~42–49° and one measurement at an approximately orthogonal oriented configuration at 136° (see green points in Fig. 1). With data at only two independent PAs in the uv-plane, we were unable to simultaneously fit the PA, the HWHM, and the elongation ratio a/b. Therefore, we assumed that the mid-infrared emission arises from the same physical structure as in the near-infrared and fixed the model PA Φgeo,MIR = 127.5° to the near-infrared value. From the two-dimensional Gaussian fit to the MIDI visibilities, we derived a HWHM = 5.1 ± 0.9 AU. The derived size ratio of a/b = 3.4 ± 1.1 suggests an elongated structure, possibly an inclined disk structure (corresponding to an inclination of 72.9 ± 17.9°).
3.2. Disk model
We employed a simple modified Chiang & Goldreich model (Chiang & Goldreich 1997) to compute the visibilities and the SED of a flared irradiated passive circumstellar dust+gas disk with an inner hole (hereafter DDN model; Dullemond et al. 2001). Our model makes use of the cgplus software3 developed by Dullemond and includes the modifications described in Dullemond et al. (2001) and Dominik et al. (2003). We fit the SED and visibilities simultaneously. The disk starts at an inner radius where the disk has the dust sublimation temperature Tin. The model visibilities were computed by projecting the intensity distribution of the DDN model to inclined rings corresponding to the inclination angle. For the central star, we used the same stellar parameters as described in Sect. 3 and kept them fixed during the fitting process (Teff = 8600 K, log (g) = 4, log (Z/H) = −2.5, stellar radius of R⋆ = 2.7 R⊙ at a distance of d = 460 pc). For simplicity, we used pure astronomical silicates (Draine & Lee 1984) with a interstellar dust grain size distribution with n(a) ~ a-3.5 (Mathis et al. 1977) with grains sizes from amin = 0.01 μm to amax = 1.0 μm (Reimann et al. 1997; Natta et al. 1999), required to fit the strong 10 μm silicate feature seen in the MIDI spectrum of UX Ori (see bottom panel in Fig. 4). With this fixed chemistry and set of stellar parameters, the DDN model can be described by seven free parameters, the inner rim temperature Tin, the outer radius of the disk Rout, the scale height of the inner rim, controlled by the dimensionless parameter χ, the mass of the disk (gas+dust) Mdisk, the exponent of the surface density distribution β, the inclination angle θDDN, and PA of the disk system axes φDDN. The inner radius Rin is not a free parameter but was computed from Tin following Eq. (14) in Dullemond et al. (2001). To account for the required extended halo found in the geometric modeling, we introduced an over-resolved component (with Vhalo = 0) to the model. We assume that the halo scatters the light from the star and the inner rim (see, e.g., Chen et al. 2012). This introduces one additional parameter, the halo flux ratio fh that defines the emitted halo flux Fhalo = fh(F⋆ + Frim), where F⋆ denotes the stellar flux and Frim the flux emitted from the inner rim. Our final model therefore incorporates eight free parameters. The best-fit parameters are summarized in Table 3.
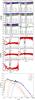 |
Fig. 4 Simultaneous fit of the visibilities (top) and the SED (bottom) of UX Ori with a CG-disk model including an inner dust-free hole and a puffed-up inner rim. Top: comparison of the best-fit model visibilities (colored lines) to the near- and mid-infrared visibilities (data points) of UX Ori. The shadowed areas denote the telluric band gaps between the J and H and H and K band for the near-infrared (top) and the ozone feature for the mid-infrared (middle) where no data can be taken or where they are not reliable as a result of the limited transmission of the atmosphere (black line). Bottom: spectral energy distribution of UX Ori (data points) with the total flux and the single flux components of the best-fit model. |
To calculate the corresponding error of each parameter, we used bootstrapping to create 600 new realizations of our data sets and applied a model fit with the same starting parameters (motivated by our geometric model results). Each fit corresponds to a new best-fit parameter set. The spread of the parameter values is described by the histograms derived from the best-fit values using the 600 randomly created data sets. The errors were estimated by a 1σ-Gauss fit to the histogram of each fit parameter. We fit all near- and mid-infrared visibilities and the SED of UX Ori simultaneously.
4. Results
The best-fit geometric K-band model consists of an inclined ring and an elongated halo structure, implemented as an elongated Gaussian. We derived a flux fraction of the extended halo of fh = 16.8 ± 4.1% of the total flux. The obtained K-band ring fit radius of 0.45 ± 0.07 AU agrees well with the predicted dust sublimation radius of ~0.44 AU for a dust sublimation temperature of 1500 K assuming large grains (~1 μm; Eq. (1) in Monnier et al. 2005), but this does not mean that no smaller grains exist because the dust sublimation radius is characterized by the largest grains that could survive closest to the central star. This assumption of the maximum grain size agrees with grain sizes (0.75–1.0 μm) found in former mid-infrared spectral observations of UX Ori (Reimann et al. 1997). The inclination of the ring is 55.6 ± 2.4°, which corresponds to an elongation axis ratio of ~2 of the Gaussian halo distribution with an HWHM of ~4.8 AU. The PA of the system axis (semi-minor axis) is 127.5 ± 24.5°.
The N-band visibilities were modeled with a simple two-dimensional Gaussian (see Sect. 3.1.2) with an HWHM of 5.1 ± 0.1 AU and an elongation ratio of 3.4 ± 1.0 (corresponding to an inclination angle of about 72.9 ± 17.9°). This is slightly higher, but consistent within the error bars with the inclination found in the near-infrared of 55.6 ± 2.4°. The PA of the system axis was fixed to 127.5° (as found in the near-infrared). We note that due to the sparse uv coverage in the N band, the derived inclination only represents a trend and not a reliable estimate. Further mid-infrared interferometric observations (e.g., with second generation MATISSE instrument) are required to measure the mid-infrared elongation more precisely.
To simultaneously fit the H-, K-, and N-band visibilities and the SED of UX Ori, we applied a modified Chiang & Goldreich model (DDN, using the cgplus software, Dullemond et al. 2001) that consists of a passive flared dust+gas disk with an inner hole. To account for extended emission, we added an over-resolved halo component. In the best-fit model, the puffed-up inner rim has a temperature of Tin = 1498 ± 70 K. This corresponds, following Eq. (14) in Dullemond et al. (2001), to an inner disk radius of 0.46 ± 0.06 AU with a rim scale height factor of χ = 4.02 ± 0.12 (defined as the ratio of the disk surface height to the pressure scale height). The disk extends to Rout = 25.9 ± 5.8 AU with a surface density exponent of β = −1.79 ± 0.12 following the profile Σ(r) = Σ0(r/rref)β (where rref defines the radius where Σ(rref) = Σ0). The dust+gas mass of the disk is Mdisk = 0.60 ± 0.04 M⊙. The extended halo component contributes to the best-fit model with a flux ratio of fh = 0.13 ± 0.02. The inclination and PA of the disk system was found to be θDDN = 70 ± 5° and ΦDDN = 133 ± 5°. The error bars represent only the statistical errors. The true total error bars might be a factor of 2−3 larger because of several model specific assumptions (e.g., disk geometry and rim shape) and systematic errors.
5. Conclusions
We presented the first interferometric observations and simultaneous modeling of the near- and mid-infrared interferometric measurements and the SED of the prototype star of its class of variable stars, UX Orionis. The H-, K-, and N-band visibilities as well as the SED of UX Ori were modeled with a geometric ring and a modified Chiang-Goldreich disk model with an inner hole (DDN model). The inclination and PA of the system axis of the best-fit DDN model are 70 ± 5° and 133 ± 5°, respectively. The intrinsic V-band polarization angle in deep minima might be used as an indicator for the approximate orientation of the symmetry axis of the circumstellar disk (Grinin et al. 1991). Polarimetric measurements in deep minima of UX Ori show a linear V-band polarization angle of 125.5−128.7° (Voshchinnikov et al. 1988), which agrees well with the PA of the system axis that we derived above. The extended halo component contributes with 13 ± 2% (DDN model)/16 ± 4% (geometric model) to the total flux, similar as found in other young stellar objects with extended halo emission (~9–16%, e.g. Monnier et al. 2006; Chen et al. 2012; Vural et al. 2012, 2014a) that is interpreted as scattered emission from the outer disk surface or material outside the disk plane, for example, a dusty disk wind (e.g., Bans & Königl 2012).
The obtained disk inclination angle of 70 ± 5° (DDN model) for UX Ori agrees with former modeling studies that used spatially unresolved techniques and found an inclination angle of the UX Ori disk >=70° (Voshchinnikov et al. 1988; Natta et al. 1999). With our study on UX Ori, there is now a sample of at least five UXORs whose inclination has been directly measured (VV Ser: ~70°, Pontoppidan et al. 2007; KK Oph: ~70°, Kreplin et al. 2013; CQ Tau: ~30–50°, Chapillon et al. 2008; Eisner et al. 2004; V1026 Sco: ~50°, Vural et al. 2014b). In all cases, intermediate- to high-inclination angles were found, which supports the hypothesis that UXOR variability is associated with obscuration events within the disk or disk atmosphere, caused for example by disk material lifted up out of the disk surface that passes through the line of sight. However, the trend of different apparent inclinations in different wavelength bands that emit predominantly in the disk atmosphere indicates that for the most precise measurement of the disk orientation and inclination, observations at longer wavelength (tracing the cooler material in the midplane of the disk) are required. Such observations would be especially important in cases when the infrared interferometry gives the disk inclination with a large uncertainty (e.g., CQ Tau).
The AMBER reduction package amdlib is available at: http://www.jmmc.fr/data_processing_amber.htm
The MIDI reduction package MIA+EWS is available at: http://home.strw.leidenuniv.nl/~nevec/MIDI/index.html
The cgplus software is available at: http://www.mpia.de/~dullemon/radtrans/fitcgplus/index.html
Acknowledgments
This research has made use of NASA’s Astrophysics Data System Bibliographic Services. We thank the ESO staff at Paranal for their support during the observations. We acknowledge support from an STFC Rutherford Fellowship (ST/J004030/1), Rutherford Grant (ST/K003445/1) and Marie Sklodowska-Curie CIG grant (Ref. 618910). V.G. acknowledge support from the RFBR grant 15-02-09191. L.T. acknowledge support from the RFBR grant 15-02-05399. We are also grateful to Dmitry Shakhovskoi for the photometric support of the interferometric observations.
References
- Bans, A., & Königl, A. 2012, ApJ, 758, 100 [NASA ADS] [CrossRef] [Google Scholar]
- Bertout, C., Robichon, N., & Arenou, F. 1999, A&A, 352, 574 [NASA ADS] [Google Scholar]
- Borde, P., Coudé du Foresto, V., Chagnon, G., & Perrin, G. 2002, VizieR On-line Data Catalog: J/A+A/339/183 [Google Scholar]
- Chapillon, E., Guilloteau, S., Dutrey, A., & Piétu, V. 2008, A&A, 488, 565 [NASA ADS] [CrossRef] [EDP Sciences] [Google Scholar]
- Chen, L., Kreplin, A., Wang, Y., et al. 2012, A&A, 541, A104 [NASA ADS] [CrossRef] [EDP Sciences] [Google Scholar]
- Chiang, E. I., & Goldreich, P. 1997, ApJ, 490, 368 [NASA ADS] [CrossRef] [Google Scholar]
- de Wit, W. J., Grinin, V. P., Potravnov, I. S., et al. 2013, A&A, 553, L1 [NASA ADS] [CrossRef] [EDP Sciences] [Google Scholar]
- Dominik, C., Dullemond, C. P., Waters, L. B. F. M., & Walch, S. 2003, A&A, 398, 607 [NASA ADS] [CrossRef] [EDP Sciences] [Google Scholar]
- Draine, B. T., & Lee, H. M. 1984, ApJ, 285, 89 [Google Scholar]
- Dullemond, C. P., Dominik, C., & Natta, A. 2001, ApJ, 560, 957 [NASA ADS] [CrossRef] [Google Scholar]
- Dullemond, C. P., van den Ancker, M. E., Acke, B., & van Boekel, R. 2003, ApJ, 594, L47 [NASA ADS] [CrossRef] [Google Scholar]
- Eisner, J. A., Lane, B. F., Hillenbrand, L., Akeson, R., & Sargent, A. I. 2004, ApJ, 613, 1049 [NASA ADS] [CrossRef] [Google Scholar]
- Grinin, V. P. 1988, Sov. Astron. Lett., 14, 27 [NASA ADS] [Google Scholar]
- Grinin, V. P. 2000, in Disks, Planetesimals, and Planets, eds. G. Garzón, C. Eiroa, D. de Winter, & T. J. Mahoney, ASP Conf. Ser., 219, 216 [Google Scholar]
- Grinin, V. P., Kiselev, N. N., Chernova, G. P., Minikulov, N. K., & Voshchinnikov, N. V. 1991, Ap&SS, 186, 283 [NASA ADS] [CrossRef] [Google Scholar]
- Herbst, W., & Shevchenko, V. S. 1999, ApJ, 118, 1043 [CrossRef] [Google Scholar]
- Herbst, W., Herbst, D. K., Grossman, E. J., & Weinstein, D. 1994, AJ, 108, 1906 [NASA ADS] [CrossRef] [Google Scholar]
- Kishimoto, M., Hönig, S. F., Antonucci, R., et al. 2011, A&A, 536, A78 [NASA ADS] [CrossRef] [EDP Sciences] [Google Scholar]
- Kreplin, A., Kraus, S., Hofmann, K.-H., et al. 2012, A&A, 537, A103 [NASA ADS] [CrossRef] [EDP Sciences] [Google Scholar]
- Kreplin, A., Weigelt, G., Kraus, S., et al. 2013, A&A, 551, A21 [NASA ADS] [CrossRef] [EDP Sciences] [Google Scholar]
- Kurucz, R. L. 1979, ApJS, 40, 1 [NASA ADS] [CrossRef] [Google Scholar]
- Lafrasse, S., Mella, G., Bonneau, D., et al. 2010, VizieR On-line Data Catalog: II/300 [Google Scholar]
- Manoj, P., Bhatt, H. C., Maheswar, G., & Muneer, S. 2006, ApJ, 653, 657 [NASA ADS] [CrossRef] [Google Scholar]
- Mathis, J. S., Rumpl, W., & Nordsieck, K. H. 1977, ApJ, 217, 425 [NASA ADS] [CrossRef] [Google Scholar]
- Menu, J., van Boekel, R., Henning, T., et al. 2015, A&A, 581, A107 [NASA ADS] [CrossRef] [EDP Sciences] [Google Scholar]
- Monnier, J. D., Millan-Gabet, R., Billmeier, R., et al. 2005, ApJ, 624, 832 [NASA ADS] [CrossRef] [Google Scholar]
- Monnier, J. D., Berger, J.-P., Millan-Gabet, R., et al. 2006, ApJ, 647, 444 [NASA ADS] [CrossRef] [Google Scholar]
- Natta, A., Grinin, V. P., Mannings, V., & Ungerechts, H. 1997, ApJ, 491, 885 [NASA ADS] [CrossRef] [Google Scholar]
- Natta, A., Prusti, T., Neri, R., et al. 1999, A&A, 350, 541 [NASA ADS] [Google Scholar]
- Petrov, R. G., Malbet, F., Weigelt, G., et al. 2007, A&A, 464, 1 [NASA ADS] [CrossRef] [EDP Sciences] [Google Scholar]
- Pontoppidan, K. M., Dullemond, C. P., Blake, G. A., et al. 2007, ApJ, 656, 980 [NASA ADS] [CrossRef] [Google Scholar]
- Reimann, H.-G., Guertler, J., Friedemann, C., & Kaeufl, H. U. 1997, A&A, 326, 271 [NASA ADS] [Google Scholar]
- Rostopchina, A. N. 1999, Astron. Rep., 43, 113 [NASA ADS] [Google Scholar]
- Tatulli, E., Millour, F., Chelli, A., et al. 2007, A&A, 464, 29 [NASA ADS] [CrossRef] [EDP Sciences] [Google Scholar]
- Testi, L., Natta, Shepherd, D. S., & Wilner, D. J. 2001, ApJ, 554, 1087 [Google Scholar]
- Vinković, D., & Jurkić, T. 2007, ApJ, 658, 462 [NASA ADS] [CrossRef] [Google Scholar]
- Voshchinnikov, N. V., Grinin, V. P., Kiselev, N. N., & Minikulov, N. K. 1988, Astrophys., 28, 182 [Google Scholar]
- Vural, J., Kreplin, A., Kraus, S., et al. 2012, A&A, 543, A162 [NASA ADS] [CrossRef] [EDP Sciences] [Google Scholar]
- Vural, J., Kraus, S., Kreplin, A., et al. 2014a, A&A, 569, A25 [NASA ADS] [CrossRef] [EDP Sciences] [Google Scholar]
- Vural, J., Kreplin, A., Kishimoto, M., et al. 2014b, A&A, 564, A118 [NASA ADS] [CrossRef] [EDP Sciences] [Google Scholar]
- Wheelwright, H. E., Oudmaijer, R. D., & Goodwin, S. P. 2010, MNRAS, 401, 1199 [NASA ADS] [CrossRef] [Google Scholar]
All Tables
All Figures
|
Fig. 1 uv coverage of our AMBER measurements (red), the archival MIDI measurements (green), and the KI measurements from the literature (blue). |
| In the text | |
|
Fig. 2 Closure phases of the five AMBER measurements of UX Ori (see Table 1). For clarity, we separated the different data sets by 50 degree. All closure phases are close to zero, consistent with a centro-symmetric brightness distribution. |
| In the text | |
|
Fig. 3 Two-dimensional fit (colored lines) of a geometric model consisting of an inclined ring and a halo (see Table 2: inclined ring + elongated halo). The fitting included all derived K-band visibilities VCS (colored data points) of the circumstellar environment (i.e., exclusive of the central star; Eq. (1)), in other words, we fitted this two-dimensional ring + elongated halo model to all visibilities instead of fitting one-dimensional visibility models to the visibilities corresponding to a single PA. In gray we plot the visibility data Vmeas. All except the bottom right panel show the AMBER observations. The bottom right panel shows the KI measurement from Monnier et al. (2005). The two KI measurements are close together in position angle and baseline length and lie on top of each other and of the model curves. |
| In the text | |
|
Fig. 4 Simultaneous fit of the visibilities (top) and the SED (bottom) of UX Ori with a CG-disk model including an inner dust-free hole and a puffed-up inner rim. Top: comparison of the best-fit model visibilities (colored lines) to the near- and mid-infrared visibilities (data points) of UX Ori. The shadowed areas denote the telluric band gaps between the J and H and H and K band for the near-infrared (top) and the ozone feature for the mid-infrared (middle) where no data can be taken or where they are not reliable as a result of the limited transmission of the atmosphere (black line). Bottom: spectral energy distribution of UX Ori (data points) with the total flux and the single flux components of the best-fit model. |
| In the text | |
Current usage metrics show cumulative count of Article Views (full-text article views including HTML views, PDF and ePub downloads, according to the available data) and Abstracts Views on Vision4Press platform.
Data correspond to usage on the plateform after 2015. The current usage metrics is available 48-96 hours after online publication and is updated daily on week days.
Initial download of the metrics may take a while.