Fig. 4
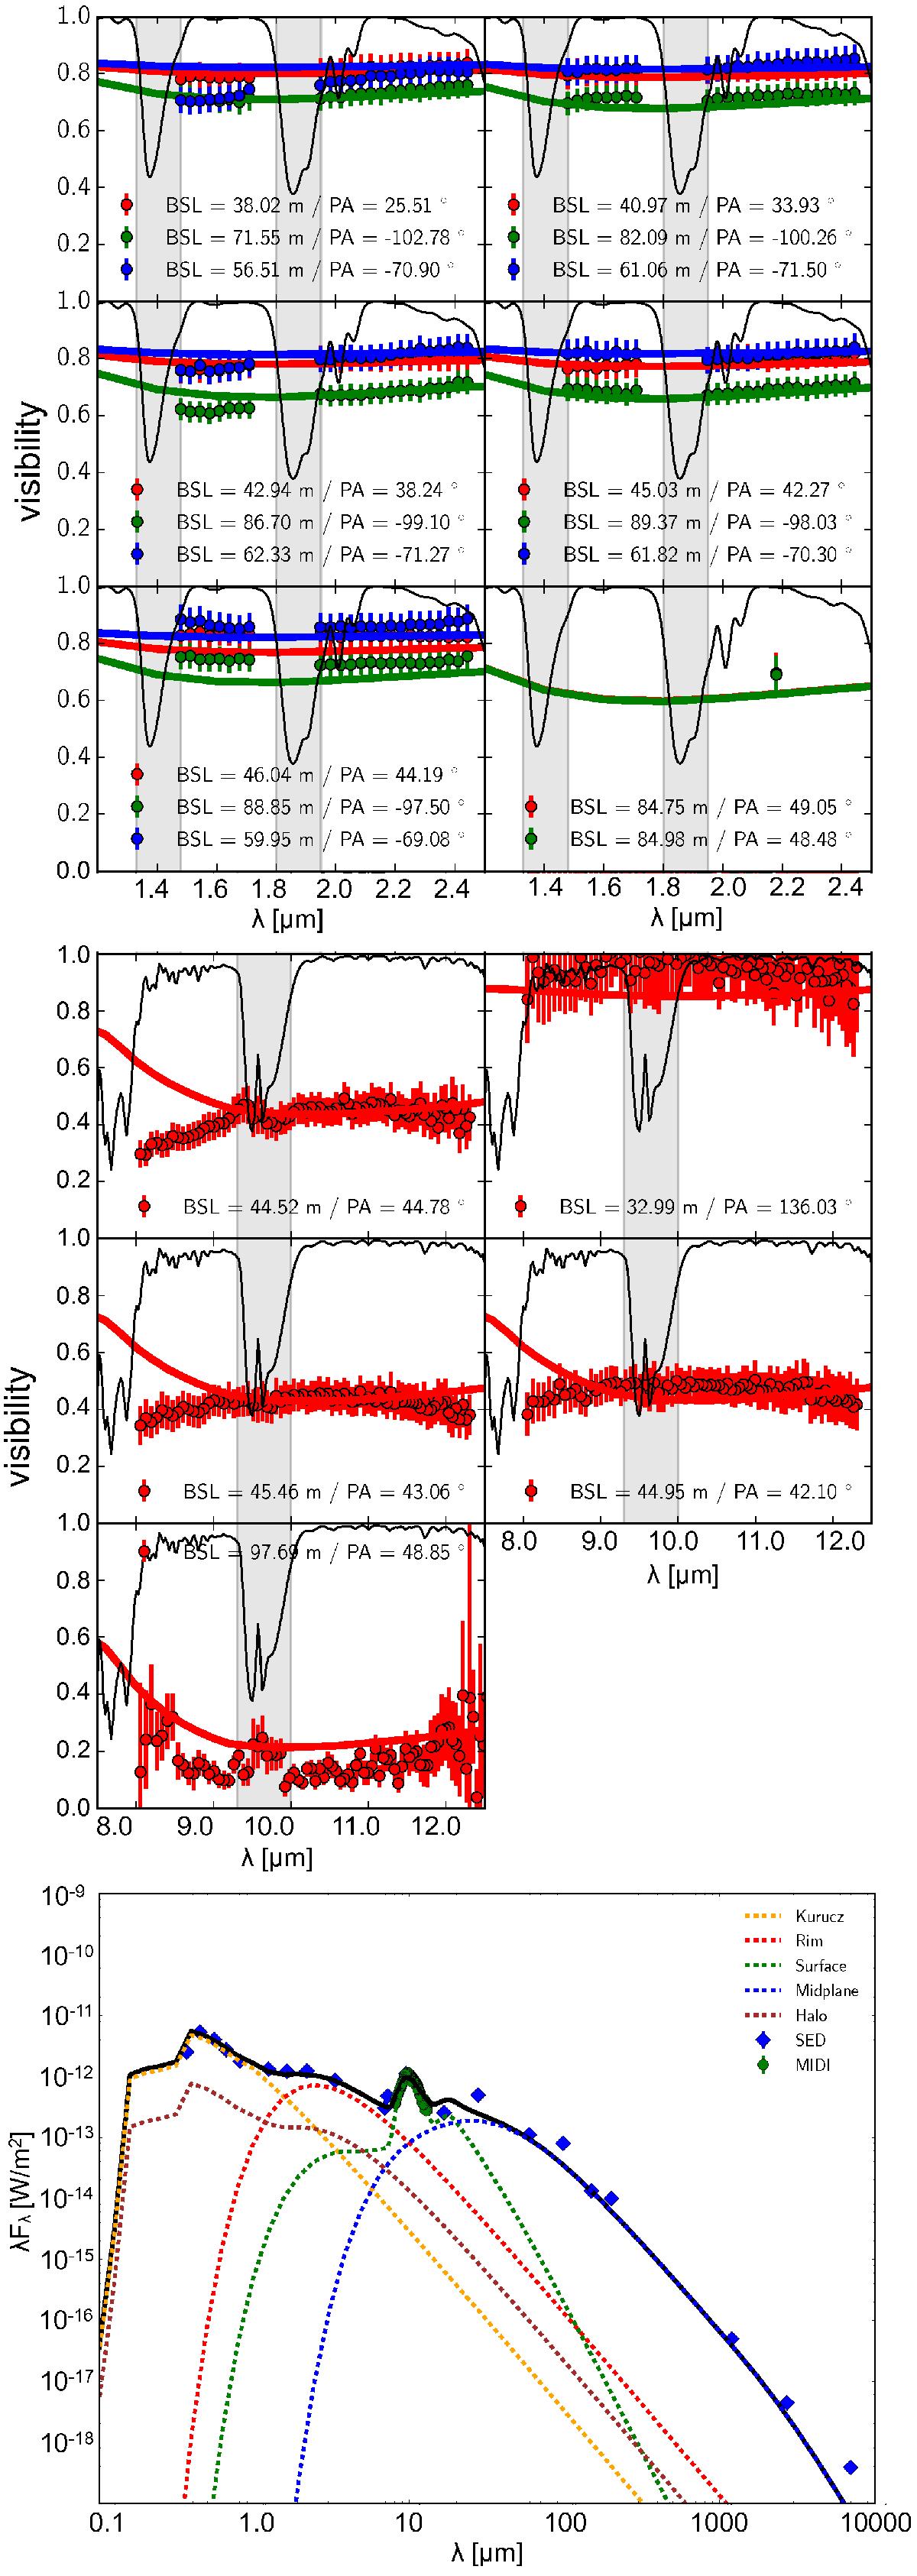
Simultaneous fit of the visibilities (top) and the SED (bottom) of UX Ori with a CG-disk model including an inner dust-free hole and a puffed-up inner rim. Top: comparison of the best-fit model visibilities (colored lines) to the near- and mid-infrared visibilities (data points) of UX Ori. The shadowed areas denote the telluric band gaps between the J and H and H and K band for the near-infrared (top) and the ozone feature for the mid-infrared (middle) where no data can be taken or where they are not reliable as a result of the limited transmission of the atmosphere (black line). Bottom: spectral energy distribution of UX Ori (data points) with the total flux and the single flux components of the best-fit model.
Current usage metrics show cumulative count of Article Views (full-text article views including HTML views, PDF and ePub downloads, according to the available data) and Abstracts Views on Vision4Press platform.
Data correspond to usage on the plateform after 2015. The current usage metrics is available 48-96 hours after online publication and is updated daily on week days.
Initial download of the metrics may take a while.