| Issue |
A&A
Volume 590, June 2016
|
|
|---|---|---|
| Article Number | A115 | |
| Number of page(s) | 10 | |
| Section | Interstellar and circumstellar matter | |
| DOI | https://doi.org/10.1051/0004-6361/201628102 | |
| Published online | 25 May 2016 | |
Ejection of gaseous clumps from gravitationally unstable protostellar disks
1 Department of AstrophysicsUniversity of Vienna, 1180 Vienna, Austria
e-mail: This email address is being protected from spambots. You need JavaScript enabled to view it.
2 Research Institute of Physics, Southern Federal University, 344090 Rostov-on-Don, Russia
Received: 11 January 2016
Accepted: 23 March 2016
Abstract
Aims. We investigate the dynamics of gaseous clumps formed via gravitational fragmentation in young protostellar disks, focusing on the fragments that are ejected from the disk via many-body gravitational interaction.
Methods. Numerical hydrodynamics simulations were employed to study the evolution of young protostellar disks that were formed from the collapse of rotating pre-stellar cores.
Results. The protostellar disks that formed in our models undergo gravitational fragmentation driven by continuing mass-loading from parental collapsing cores. Several fragments can be ejected from the disk during the early evolution, but the low-mass fragments (<15 MJup) disperse, which creates spectacular bow-type structures while passing through the disk and collapsing core. The least massive fragment that survived the ejection (21 MJup) straddles the planetary-mass limit, while the most massive ejected fragments (145 MJup) can break up into several pieces, leading to the ejection of wide separation binary clumps in the brown-dwarf mass range. About half of the ejected fragments are gravitationally bound, the majority are supported by rotation against gravity, and all fragments have the specific angular momentum that is much higher than that expected for brown dwarfs. We found that the internal structure of the ejected fragments is distinct from what would be expected for gravitationally contracting clumps formed via molecular cloud fragmentation, which can help in differentiating their origin.
Conclusions. The ejection of fragments is an important process, which is inherent to massive protostellar disks, and which produces freely floating pre-brown dwarf cores, regulates the disk and stellar masses and, potentially, enriches the intracluster medium with processed dust and complex organics.
Key words: stars: protostars / circumstellar matter / brown dwarfs / hydrodynamics
© ESO, 2016
1. Introduction
Protostellar disks form during the gravitational collapse of rotating cloud cores owing to the conservation of angular momentum. During the early evolution phase when the disk is still embedded in the parental core, the mass infall rate onto the disk from the core often exceeds the disk mass loss onto the star via viscous or magnetic torques, leading to the net growth of the disk mass and development of gravitational instability (e.g. Vorobyov & Basu 2010; Machida et al. 2010). If the disk mass becomes sufficiently high (≳0.1 M⊙) and the radiative cooling is sufficiently fast, the latter usually being the case at radii greater than a few tens of AU, then compact gaseous clumps can form in the densest regions of the disk via gravitational fragmentation (e.g. Johnson & Gammie 2003; Rafikov 2007; Boley 2009; Vorobyov & Basu 2010; Meru & Bate 2012; Tsukamoto et al. 2013). These fragments are supported against self-gravity by pressure forces and/or rotation and have a mass spectrum that ranges from a few Jupiter masses to upper brown dwarfs and very-low-mass stars (e.g. Vorobyov et al. 2013; Galvagni & Mayer 2014).
The subsequent evolution of the clumps depends on a number of factors, but can be roughly divided into three main branches. Many clumps that form in the embedded phase of star formation experience fast inward migration and may be tidally dispersed and accreted into the star, which produces luminosity bursts similar in magnitude to those of FU-Orionis-type objects (Vorobyov & Basu 2010, 2015; Machida et al. 2011), or may deliver a population of giant planets (including hot Jupiters), icy giants, or terrestrial planets to the inner disk if the clump contraction rate and dust sedimentation are sufficiently fast to withstand the tidal torques (Nayakshin 2010; Boley et al. 2010; Galvagni & Mayer 2014). Clumps that form in the late embedded phase or even in the early T Tauri phase usually experience slow inward or even outward migration and can form a population of giant planets and brown dwarfs on wide orbits (Vorobyov & Basu 2010; Zhu et al. 2012; Vorobyov 2013; Stamatellos & Herczeg 2015).
Some clumps may be tidally destroyed during close encounters with other clumps or dense spiral arcs (Zhu et al. 2012) and, depending on the rate of dust sedimentation, may either release processed dust, such as crystalline silicates, or solid protoplanetary cores at various radii in the disk (Boley et al. 2010; Vorobyov 2011; Nayakshin 2011). Finally, if several clumps are present in the disk at a time, one of them can be ejected into the intracluster medium via many-body gravitational interaction, producing a population of freely-floating objects that slowly cool and contract to form brown dwarfs and very-low-mass stars (Thies et al. 2010; Basu & Vorobyov 2012).
In this paper, we focus on the ejection of clumps from protostellar disks. We revisit the earlier work of Basu & Vorobyov (2012) using numerical hydrodynamics simulations with higher numerical resolution, which allows us to better resolve the ejected clumps, calculate their internal structure, and consider possible implications of the ejection process for the evolution of disks and host stars. The properties of ejected clumps can help to clarify the origin of proto-brown dwarf candidates that were recently detected in young star-forming regions (André et al. 2012; Phan-Bao et al. 2014; Palau et al. 2014; Riaz et al. 2015) The paper is organized as follows. The numerical model is briefly described in Sect. 2, disk fragmentation and ejection of clumps are considered in Sect. 3, properties of the clumps are presented in Sect. 4, implications of clump ejection are discussed in Sect. 5, and main results are summarized in Sect. 6.
2. Model description
We compute the dynamics of gravitationally unstable disks using the numerical model described in detail in Vorobyov & Basu (2010). Here, we provide only a brief description for the reader’s convenience. Numerical simulations start from a collapsing pre-stellar core of a certain mass, angular momentum and temperature, continue into the disk formation phase, and finish in the T Tauri phase. The use of the thin-disk limit allows us to follow the evolution of circumstellar disks on time scales longer than allowed in full 3D simulations.
We solve the mass, momentum, and energy transport equations using vertically integrated quantities. Disk self-gravity is calculated by solving the Poisson equation using a two-dimensional Fourier convolution theorem for polar coordinates. The energy equation includes compressional heating, heating due to stellar and background irradiation, radiative cooling from the disk surfaces, and heating that is due to turbulent viscosity (parameterized via the usual Shakura & Sunyaev prescription with α = 0.005). A diffusion approximation to link the effective surface temperature of the disk with the midplane temperature is adopted and a smooth transition is introduced between the optically thin and optically thick regimes. The stellar irradiation is based on a luminosity that is a combination of accretion luminosity and photospheric luminosity, the latter calculated from the pre-main-sequence tracks of D’Antona & Mazzitelli (1994) using the current stellar mass. Frequency-integrated opacities are adopted from the calculations of Bell & Lin (1994). The vertically integrated pressure is related to the internal energy per surface area through an ideal gas equation of state.
Models presented in this paper are run on a polar coordinate (r,φ) grid with 1024 × 1024 zones. The radial grid zones are logarithmically spaced, while the grid spacing in the azimuthal direction is equidistant. A central sink cell of radius 20 AU is employed1 and the potential of a central point mass is added to the disk self-gravity once a central star is formed.
The innermost cell outside the central sink has a size of 0.13–0.14 AU depending on the radius of the computational region (i.e., on the cloud core radius). The latter varies in the 0.07–0.11 pc (14 000–22 000 AU) limits. The radial and azimuthal resolution are 0.7 AU at a distance of 100 AU and 3 AU at a distance of 500 AU from the star, which is about a factor of 2 higher than in the study of Basu & Vorobyov (2012).
The Truelove criterion states that the local Jeans length must be resolved by at least four numerical cells to correctly capture disk fragmentation (Truelove et al. 1998). The Jeans length in a self-gravitating thin disk can be calculated as (Vorobyov 2013)  (1)where ⟨ v2 ⟩ is the gas velocity dispersion, G the gravitational constant, and Σ the gas surface density
Initial model parameters.
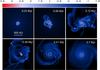 |
Fig. 1 Evolution of the disk in Model 1. Shown is the gas surface density in g cm-2 at six times elapsed since the formation of the central star (represented schematically by the red circle in the coordinate center). The scale bar is in log g cm-2. |
Fragments usually form at distances greater than 50 AU. The typical surface densities and temperatures at 100 AU are Σ = 10 g cm-2 and T = 25 K (Vorobyov 2011). Noting that ⟨ v2 ⟩ = 2ℛT/μ for a thin disk with two translational degrees of freedom, where ℛ is the universal gas constant and μ = 2.33 the molecular wight, the corresponding Jeans length is about 50 AU. Since the gas surface density declines with radius faster than the gas temperature, Σ ∝ r-1.5 and T ∝ r-0.5 for self-gravitating flaring disks illuminated by stellar irradiation (Vorobyov 2010), the Jeans length is expected to increase with radius. Our numerical resolution is therefore sufficient to resolve the Jeans length at distances ≲1000 AU, which is smaller than the maximum disk size in our numerical simulations.
The inner and outer boundary conditions are set to allow for free outflow from the computational domain. The initial conditions for the pre-stellar core correspond to profiles of column density Σ and angular velocity Ω of the form ![Mathematical equation: \begin{eqnarray} &&\Sigma = {r_0 \Sigma_0 \over \sqrt{r^2+r_0^2}}, \\ &&\Omega = 2\Omega_0 \left( {r_0\over r}\right)^2 \left[\sqrt{1+\left({r\over r_0}\right)^2 } -1\right], \label{ic} \end{eqnarray}](/articles/aa/full_html/2016/06/aa28102-16/aa28102-16-eq34.png) where Σ0 and Ω0 are the gas surface density and angular velocity at the center of the core. These profiles have a small near-uniform central region of size r0 and then transition to an r-1 profile; they are representative of a wide class of observations and theoretical models (Basu 1997; André et al. 1993; Dapp & Basu 2009). We have considered five representative models which show disk fragmentation and ejection of fragments into the intracluster medium. The model parameters are shown in Table 1, where Mc is the initial core mass and β is the ratio of rotational energy to the magnitude of gravitational potential energy. In all model cores, the initial gas temperature is set to 10 K. The parameters of the models were chosen based on our previous experience to produce gravitationally unstable disks prone to fragmentation (Vorobyov & Basu 2010; Basu & Vorobyov 2012).
where Σ0 and Ω0 are the gas surface density and angular velocity at the center of the core. These profiles have a small near-uniform central region of size r0 and then transition to an r-1 profile; they are representative of a wide class of observations and theoretical models (Basu 1997; André et al. 1993; Dapp & Basu 2009). We have considered five representative models which show disk fragmentation and ejection of fragments into the intracluster medium. The model parameters are shown in Table 1, where Mc is the initial core mass and β is the ratio of rotational energy to the magnitude of gravitational potential energy. In all model cores, the initial gas temperature is set to 10 K. The parameters of the models were chosen based on our previous experience to produce gravitationally unstable disks prone to fragmentation (Vorobyov & Basu 2010; Basu & Vorobyov 2012).
3. Disk fragmentation and ejection of gaseous clumps
We start with analysing the long-term evolution of gravitationally unstable disks which form from the gravitational collapse of our model cores. Figure 1 presents the gas surface density distribution in Model 1 at various times since the formation of the central star. We focus on the inner computational region with a size of 2000 × 2000 AU2 to better demonstrate the complexity of the disk structure and dynamics during the early disk evolution. The disk forms at t = 0.01 Myr (hereafter, the time is counted from the formation of the central star) and quickly gains mass thanks to continuous mass loading from the infalling parental core. The disk mass exceeds 0.1 M⊙ after t = 0.03 Myr leading to the development of vigourous gravitational instability and fragmentation. Gravitationally-bound clumps that form in the disk are essentially the “first hydrostatic cores” in the parlance of star formation (Larson 1969) with typical sizes of several tens of AU and temperatures up to several hundreds Kelvin (Vorobyov et al. 2013). A second collapse down to planetary-sized bodies can take place when the central temperature reaches ~2000 K and molecular hydrogen begins to dissociate. This possibility is however not allowed in our numerical simulations, because resolving planetary-sized objects requires a local spatial resolution ≪0.1 AU and is a formidable task for grid-based codes designed to study the global evolution of protostellar disks. We note however that in our simulations the majority of fragments are destroyed or ejected from the disk before reaching the temperature needed for H2 dissociation.
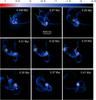 |
Fig. 2 Three ejection events in Model 1. The first ejected objects are shown with the green arrows indicating low-mass clumps which dispersed soon after leaving the disk. The yellow circles outline the second ejected object – a massive fragment that withstood ejection and left the computational region. The yellow arrows show the final ejected clump which also dispersed. The vertical bar is in log g cm-2. |
After t = 0.13 Myr, the disk mass exceeds 0.2 M⊙ and during the subsequent evolution the disk reveals a very chaotic structure with multiple fragments connected by elements of spiral arms and arcs. The fragments span a mass range from a few Jupiters masses to upper-mass brown dwarfs and they are found at various distances in the disk, often embedded in spiral arms in relative isolation from other fragments or in closely packed groups. After t = 0.41 Myr, the disk starts to take a more regular shape with a well-defined multi-arm spiral pattern. Several fragments are still present in the disk at this late evolution time. However, after t = 0.7 Myr all fragments have disappeared either migrating through the inner sink cell (onto probably onto the star) or being destroyed by tidal torques. These two fragment destruction mechanisms have also been reported in previous independent numerical studies (e.g., Cha & Nayakshin 2011; Baruteau et al. 2011; Zhu et al. 2012; Tsukamoto et al. 2013).
In this work, we focus on yet another mechanism that can lead to the loss of fragments by protostellar disks – ejection of fragment via multi-body interaction. The complexity of the disk structure during the early disk evolution (see Fig. 1) implies the presence of strong dynamical interactions between various disk components. If two (or more) fragments experience a close approach with each other, this may lead to ejection of one of the fragments into the intracluster medium via multi-body gravitational interaction. This effect was demonstrated in Basu & Vorobyov (2012) in the context of self-gravitating fragments and earlier by, for example, Stamatellos & Whitworth (2009) in the context of fully formed brown dwarfs. The difference between these two cases is not trivial. In disk simulations, the fully formed brown dwarfs are usually described by point-sized gravitating particles with a smoothing length of the gravitational potential of ~1 AU. On the other hand, self-gravitating fragments in our study are at least an order of magnitude larger. This makes it more difficult for the fragments to be ejected owing to a larger effective distance between these objects during close encounters. Moreover, the finite-sized fragments can be destroyed via tidal torques during close encounters, which is not possible for point-sized objects.
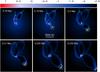 |
Fig. 3 Two ejection events in Model 2. The first ejected objects are shown with the green arrows indicating low-mass clumps which dispersed soon after leaving the disk. The second ejected object is a massive fragment outlined by the yellow circles, it breaks into a binary system soon after leaving the disk. The scale bar is in log g cm-2. |
Figure 2 presents a zoomed-out view on the computational region in Model 1, this time covering a ten times larger box 20 000 × 20 000 AU2 than in Fig. 1, but focusing on a shorter evolution sequence between t = 0.246 Myr and t = 0.41 Myr. We note that the entire computational region is still somewhat larger, 30 000 × 30 000 AU2, but we focus on a smaller region to allow for a better resolution of the inner regions. The figure captures three ejection events that are described below in more detail.
The first event occurs at t ≈ 0.25 Myr and is associated with ejection of several diffuse gaseous clumps, indicated in the image with green arrows. The masses of the clumps are below 10 MJup. As these clumps traverse the disk with velocity ≈1.0 km s-1, more than a factor of 2 higher than the local speed of sound ≈0.4 km s-1, they create spectacular bow shocks. The ram pressure from the disk and envelope ultimately destroys the clumps, but the material entrailed by the passage of the clump continues to expand and leaves the shown area at around t = 0.3 Myr.
The second event is the ejection of a massive fragment (75 MJup) outlined in Fig. 2 by the yellow circles. The event takes place at around t = 0.28 Myr. The ejected fragment is significantly more massive than the two clumps ejected during the first event. The increased self-gravity of the massive fragment makes it easier to withstand the destructive effect of tidal torques during the close encounter. Moreover, the massive fragment happened to be ejected in almost the same direction as the previously ejected low-mass clumps, which effectively cleared the way for the ejected fragment so that the ram pressure of the envelope material became weaker. The fragment passes through the boundary at around t = 0.33 Myr having a velocity factor of 1.8 higher than the escape velocity (vesc = 0.4 km s-1). This indicates the true ejection into the intracluster medium with little chance for the fragment to return.
Finally, the third ejection event takes place at t ≈ 0.33 Myr, but the ejected clump, shown in Fig. 2 by yellow arrows, does not survive for long and disperses soon after leaving the disk. The entrailed material however continues to expand and at least a fraction of it passes through the outer computational boundary.
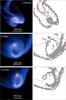 |
Fig. 4 Left column: distribution of the gas surface density (left column, g cm-2, log units) and the |

3.1. Ejection of a binary fragment
The ejection events that occur in massive circumstellar disks are not limited to the ejection of single fragments. The ejected fragments often possess sufficient mass and angular momentum to undergo internal fragmentation. This phenomenon was first reported in Vorobyov & Basu (2013), but one of the fragments, which constituted the ejected binary system, dispersed before leaving the computational region. A better numerical resolution of the current numerical simulations enables us to study this process in more detail.
Figure 3 presents a sequence of time snapshots in Model 2, which illustrate the ejection events taking place around t = 0.18 Myr. Each panel shows the gas surface density in the inner 20 000 × 20 000 AU2 box. Similar to Model 1, the green arrows track diffuse clumps that disperse after being ejected from the disk, suggesting that this phenomenon is typical for massive disks. The yellow circles, on the other hand, show the ejected clump which survives the ejection process but breaks into two separate fragments on its journey outward. The original mass of the ejected clump was ≈80 MJup and the final masses of the binary components are 33 MJup and 30 MJup.
Two criteria are usually invoked to check the feasibility of gravitational fragmentation:  (4)where QT is the Toomre parameter (Toomre 1964), κ the epicyclic frequency, and
  the product of the local cooling time tc and orbital frequency Ω (Gammie 2001). Gravitational fragmentation is supposed to occur if both parameters, QT and
  are smaller than some critical values, Qcrit and
  . There is an ongoing debate as to the exact values of Qcrit and (see, for example, Meru & Bate 2012; Rice et al. 2014), but most studies seem to indicate that disk fragmentation occurs when both values are smaller than 1.0.
To check if the two fragmentation criteria are fulfilled in Model 2, in Fig. 4 we plot the spatial distribution of the Q- and -parameters around the ejected clump. More specifically, the color image in the left column presents the gas surface density distribution, while the grey image in the right column shows the regions with  In both columns, the red lines outline the regions with Q< 1.0. Evidently, the Q-parameter is smaller than unity almost everywhere within the clump. We note that, when calculating the value of Q, we calculated the epicyclic frequency κ in the frame of reference of the central gravitating star, while it would be more consistent to find the value of κ in the rotating frame of reference of the ejected clump, at least in the pre-fragmentation phase. However, the gas flow in and around the ejected fragment was too complicated to derive reliable values of κ in the rotating frame of reference, forcing us to use a simpler calculation of κ in the fixed frame of reference. The situation with the -parameter is more complicated, but there are areas in the clump where both criteria for fragmentation are fulfilled, e.g., in a spiral arc extending to the bottom-right, within which the second fragment finally forms.
3.2. The ejected fragment straddling the planetary-mass limit
In previously considered models, the ejected fragments had masses that spanned a range from intermediate- to upper-mass brown dwarfs. In this section, we present the ejection of a fragment with mass straddling the planetary-mass limit. Figure 5 shows the disk evolution in Model 3 during a vigorous ejection event taking place at t ≈ 0.18 Myr. Two ejected clumps, identified by the yellow and green arrows, survive through the entire journey to the outer boundary of the computational domain. Their masses are 157 MJup (green arrows) and 21 MJup (yellow arrows). Among all objects that survived the ejection process in our numerical simulations, the latter fragment is characterized by the lowest mass.
The yellow circle in Fig. 5 outlines another three ejected clumps with masses ranging from 5 to 15 MJup. They did not survive. It is possible that a weaker self-gravity of low-mass clumps results in a reduced ability to withstand tidal torques that act on the clumps during close encounters, leading to their subsequent dispersion. On the other hand, similar numerical simulations of fragmenting disks with a twice coarser numerical resolution (Basu & Vorobyov 2012) report the minimum mass of ejected fragments to be about 40 MJup, which is almost a factor of 2 higher. This implies that the dispersal of low-mass fragments may be caused by the adopted log-spaced numerical grid, resulting in a progressively coarser numerical resolution as the clumps propagate outward. By extrapolation, we hope to detect the ejection of planetary-mass objects in future numerical simulations with an increased numerical resolution.
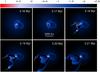 |
Fig. 5 Two ejected events in Model 3. The first ejected objects are shown by the yellow and green arrows. They survive the ejection event and then leave the computational region. In particular, the fragment shown by the yellow arrow has the lowest mass found in our simulations, 21 MJup. The second ejection is highlighted by the yellow circle, comprising three fragments. None of these objects survived the ejection. The scale bar is in g cm2. |
4. Properties of ejected fragments
The numerical resolution of our models allow us to study the structure of ejected fragments in some detail. Figure 6 presents a zoom-in view onto several ejected fragments in Models 1–5. In particular, the gas velocity field shown with the yellow arrows is superimposed on the gas surface density map in and around the ejected fragments. The velocity field is calculated in the framework of the moving fragment. The black lines outline the position of the fragments according to the fragment-tracking algorithm described in detail in Vorobyov (2013). This algorithm requires that the fragment be pressure-supported, having a negative pressure gradient with respect to the center of the fragment, and that the fragment be kept together by gravity, having the deepest potential well at the center of the fragment. These requirements translate into the following equations:  where (r,φ) are the radial and azimuthal coordinates of the polar grid, (rc,φc) the radial and angular coordinates of the center of the fragment (defined as the local maximum in gas density), r′ = r−rc, φ′ = φ−φc, and Φ is the total gravitational potential, including the contributions from the star, disk, and envelope (if the latter is still present).
A visual inspection of Fig. 6 indicates that the ejected fragments have a dense central core and a diffuse envelope. The ejected fragments are also surrounded by a low-density material, which is located inside their Hill radii (greater than 1000 AU for most fragments, see Table 2) and is thus gravitationally bound to them. Several fragments have a comet-like shape with a compact head and a diffuse tail. The ejected fragments may rotate not only in the same direction as the parental disk (counterclockwise), but also in the opposite direction.
The main properties of the ejected fragments are listed in Table 2. Evidently, the mass of most ejected fragments lies in the brown-dwarf limits. However, when the material within the Hill radius is taken into account, the final mass for five objects shifts closer to very-low-mass stars, 0.1 M⊙. On the other hand, because of high angular momentum, these objects are expected to form disks and lose some material via associated jets and outflows, which may bring them back to the brown dwarf mass range. We also note that all ejected objects have velocities greater than the escape speed, implying that we witness here true ejections with little chance for the fragments to come back to the parental disk.
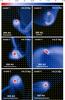 |
Fig. 6 Zoomed-in view on several ejected fragments in Models 1–5. The corresponding time is indicated in every panel. The gas velocity field (yellow arrows) are shown, superimposed on the gas surface density distribution. The black contour lines outline the fragments according to the adopted fragment tracing algorithm. The scale bar is log g cm-2. |
To better understand the evolution of the fragments, we calculate their gravitational energy using the following equation:  (7)where the scalar product (r′·∇Φ) is calculated in the local frame of reference defined by rc and the integration is performed over all grid cells occupied by the fragment. The rotational and thermal energy are calculated as
  where vφ is the gas velocity that is determined in the local frame of reference of the fragment center, T the gas temperature, γ = 7/5 the ratio of specific heats, and μ = 2.33 the mean molecular weight. Here, the integration is also performed over all grid cells occupied by the fragment.
The fragments are found to evolve near, but not exactly at, the virial equilibrium. Four out of nine fragments (1, 2a, 3a, and 4a) are gravitationally bound with | Egrav | ≳ 2Erot + Eth, but others are characterized by | Egrav | ≲ 2Erot + Eth, implying that they may disperse if they do not lose part of their thermal or rotational support during the subsequent evolution. Three fragments out of nine (2a, 3a, and 4a) are mostly thermally supported against self-gravity, while the others are mostly supported by rotation. In all fragments, the specific angular momentum is much higher than that expected for brown dwarfs with the rotation period of 1 day, JBD = 4 × 1015 cm2 s-1. This means that ejected fragments have to get rid of most angular momentum when contracting into brown-dwarf-sized objects, possibly via the formation of circum-brown-dwarf disks, jets, and outflows.
Finally, in Fig. 7 we present the azimuthally averaged radial profiles of the gas surface density (top panel), temperature (middle panel), and rotation velocity (bottom panel) for several best-resolved fragments. Evidently, the fragments are characterized by a centrally condensed surface density distribution, which has a near-constant-density plateau (∝r-0.4) with a size of ~50 AU and an extended tail that falls off with distance as r-2.5. The radial temperature profiles decline with distance as r-0.4 but, in general, show a much wider scatter at a given radius than the surface density profiles. In contrast to the gas surface density and temperature distributions, the radial distribution of rotational velocity (vφ) does not show a gradual decline with radius, but first increases with radius as r0.3, reaches a local peak at 40–70 AU, and then falls off with radius roughly as r-0.5. The latter suggests that a larger fraction of the total fragment mass is concentrated in the central near-constant-density core.
It is interesting to compare the gas surface density distribution in the ejected fragments with that of a vertically integrated Bonnor-Ebert (BE) sphere, which is described by the following equation (Dapp & Basu 2009): (10)where Σc = 2rcρ0 is the central surface density,
  the radius of the central constant density plateau, ρ0 the central gas volume density, cs the sound speed, and C the so-called concentration parameter chosen to be equal to 5. For T = 10 K, n0 = 107 cm-3, and β = 0.95%, typical for dense pre-brown dwarf cloud cores, the total mass contained within 1000 AU is equal to 70 MJup, which is comparable to the mass of the most massive ejected clumps. The corresponding surface density profiles are shown in Fig. 7 by the solid black lines. More specifically, the bottom line shows the initial radial distribution, while the other black solid lines (from bottom to top) correspond to t = 0.01 Myr, t = 0.011 Myr, and t = 0.0115 Myr after the onset of gravitational collapse. We do not limit ourselves with the initial distribution, but consider the dynamically evolving core, because the radial profiles are expected to change with time (e.g., Masunaga et al. 1998). Clearly, the surface density distribution of the vertically integrated, gravitationally contracting BE sphere is quite distinct from that of the ejected clumps. The former has a significantly lower gas surface density – between a few AU and few hundreds of AU – than the latter. For a similar total gas mass, ejected clumps are more compact than collapsing BE spheres. Moreover, the radial slope of the gas surface density is also distinct in the two cases: for the BE sphere it is Σ ∝ r-1 and for the ejected clumps it has a bi-modal distribution, Σ ∝ r-0.4 for the clump’s core and Σ ∝ r-2.5 for the clump’s envelope.
To make our comparison more comprehensive, we followed the evolution of our collapsing BE sphere into the pre-disk and post-disk formation phases. The dashed line presents the radial gas surface density distribution at t = 0.013 Myr, when the mass in the central sink cell (with a radius of 2 AU for this model) has exceeded 0.015 M⊙ and the density has exceeded the opacity limit of 1011 cm-3 (implying the formation of the first hydrostatic core there). At this stage, the radial surface density profile in the collapsing core is again very distinct from that of the ejected fragments. Only after the formation of a centrifugally balanced disk, the resulting surface density profiles, shown by the dash-dotted lines for t = 0.04 Myr and t = 0.07 Myr, start to resemble those of the ejected fragments. At this stage, however, BDs should be relatively easy to distinguish from the ejected fragments owing to the presence of a compact central object with a mass >0.05 M⊙.
The radial profiles of gas temperature and rotational velocity are also distinct in the two cases, as can be seen in the middle and bottom panels of Fig. 7. This time, we plot the radial distributions of our model only at t = 0.0115 Myr (final stage of the BE sphere collapse), at t = 0.013 Myr (pre-disk phase), and at t = 0.04 Myr (the early post-disk phase). In general, the gas temperature in the gravitationally contracting BE sphere is lower than in ejected fragments, while it is higher in the post-disk phase. However, the largest difference between contracting BE spheres and ejected fragments is found in the case of rotational velocities. The former have radially declining rotational velocities, which are sub-Keplerian in the pre-disk phase and Keplerian in the disk phase. The latter are described by a bi-modal velocity distribution, which increases with distance in the inner 40–70 AU and changes to a near-Keplerian profile at larger distances, which suggests that the central regions of ejected fragments are mostly supported against gravity by gas pressure.
Models showing ejection and properties of ejected clumps.
5. Implications
The process of ejecting gaseous clumps from gravitationally unstable protostellar disks has several interesting implications which we briefly discuss below.
The origin of brown dwarfs. The formation of brown dwarfs via the direct gravitational collapse of dense cores formed in molecular clouds via, for example, turbulent compression has been advocated by many theoretical and observational studies (e.g., Padoan & Nordlung 2004; Hennebelle & Chabrier 2008; Bate 2009, 2012; André et al. 2012). While certainly presenting a feasible gateway, this star-like scenario is not without problems because it requires high gas densities in the center of pre-brown dwarf cores and some mechanisms to truncate the cores (otherwise, the brown dwarf embryo would continue growing via accretion to stellar masses). An alternative to the star-like mechanism of brown dwarf formation is the gravitational fragmentation of protostellar disks, followed by ejection of either finished brown dwarfs (Stamatellos & Whitworth 2009) or gaseous clumps, which are expected later to cool and form freely-floating brown dwarfs (Basu & Vorobyov 2012; Vorobyov & Basu 2013).
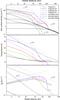 |
Fig. 7 Azimuthally averaged radial profiles of the gas surface density (top panel), temperature (middle panel), and rotation velocity (bottom panel) for several best-resolved fragments in Models 1, 3, and 5. The black lines show the radial gas surface density, temperature. and rotational velocity profiles of a vertically integrated, gravitationally contracting Bonnor-Ebert sphere in the pre-stellar phase (solid lines), pre-disk phase (dashed lines), and post-disk phase (dash-dotted lines). The doted lines represent the radial slopes for comparison. |
The current study suggests that the radial density, temperature, and velocity distributions of ejected clumps are distinct from those of gravitationally contracting Bonnor-Ebert spheres, which are usually invoked to describe dense cores that formed via molecular cloud fragmentation. The former are more compact and centrally condensed, and have higher temperatures and rotation velocities than the Bonnor-Ebert-like cores. In particular, some of the ejected fragments are rotationally supported, whereas the Bonnor-Ebert spheres are pressure-supported. The typical ratios of the rotational to gravitational energies in pre-stellar cores formed via molecular cloud fragmentation, β = 10-4−0.07 (Caselli et al. 2002), also suggest predominant pressure support. This difference in the structure of pre-brown dwarf cores can be used to observationally distinguish between different formation mechanisms for brown dwarfs.
Stellar and disk masses. The ejection of gaseous clumps from protostellar disks presents a substantial mass loss channel for young stellar systems, which can potentially affect the disk mass in the later evolution phase and the terminal mass of the star. Figure 8 shows the gas mass that leaves the outer computational boundary in five models as a function of time elapsed since the formation of the disk in each model. We imposed a free outflow condition at the outer boundary, preventing any material from entering the computational domain so that the values shown represent the true ejected mass, and are not contaminated by any possible inflow.
Compact fragments that survive the ejection process cause a steep increase in the ejected mass as they quickly pass through the outer computational boundary, while diffuse clumps that disperse soon after leaving the disk create a gradual increase in the ejected mass because it takes longer for them to pass through the outer boundary. The total ejected mass ranges from 0.1 M⊙ to 0.3 M⊙, which corresponds to 10%–30% of the total mass reservoir contained initially in parental cores or up to 50% of the protostellar disk mass at the end of simulations. The ejection of gaseous clumps, whether they survived or dispersed, therefore presents an important mass regulation mechanism, which limits the disk mass growth and reduces the terminal stellar mass. Although this channel alone is not sufficient for explaining the observed shift between the initial core and stellar mass functions (Alves et al. 2007), it may, nevertheless, present one of the possible processes that finally shapes the initial mass function of stars.
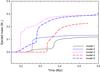 |
Fig. 8 Mass of gas that leaves the outer computational boundary in Models 1–5 as a function of time elapsed since the formation of the disk. Steep rises in the outflown mass are caused by dense fragments passing through the outer boundary after being ejected from the disk. |
Enrichment of the intracluster medium. Ejection of gaseous clumps presents an interesting mechanism for the enrichment of the intracluster medium with disk-processed material. Figure 8 shows that most ejection events take place between 0.2 Myr and 0.4 Myr. Protostellar disks with an age of a few hundred thousand years may have a dust content that is notably different from that of the interstellar medium (Williams & Cieza 2011). Moreover, gaseous clumps can act as dust attractors owing to the gas pressure gradients (Rice et al. 2004), can anneal amorphous silicates into the crystalline form (Vorobyov 2011; Nayakshin et al. 2011), and can facilitate the growth of solid protoplanetary cores in their interiors (Boss 1998; Nayakshin 2010, 2011; Boley et al. 2010). If dispersed in the process of ejection, as was often seen in our numerical simulations, these clumps release their dust content and solid cores, enriching the intracluster medium with processed dust and creating a population of freely floating solid protoplanetary cores. Finally, the disk chemistry is also expected to be different from that of the interstellar medium and the ejected clumps may enrich the intracluster medium with complex chemical elements (e.g., organics), which would be otherwise difficult to form. Further numerical studies are required to assess the importance and efficiency of the aforementioned effects.
6. Conclusions
In this work, we have investigated numerically the long-term evolution of young self-gravitating protostellar disks that exhibit gravitational instability and the formation of multiple gaseous fragments. We found that some of these fragments may be ejected from the disk during close encounters with other fragments via the gravitational multibody interaction. The least massive clumps (≲20 MJup) disperse while passing through the disk and the infalling envelope, creating spectacular bow-type structures. More massive clumps, on the other hand, can survive the whole journey to the outer computational boundary (≳10 000 AU), producing a population of freely-floating objects in the brown-dwarf mass range. Some of the most massive fragments can undergo gravitational fragmentation after being ejected from the disk, which leads to the ejection of binary objects with a separation of several hundreds of AU. All ejected clumps have velocities greater than the escape speed, meaning that these are true ejections rather than mere scatterings.
The minimum mass of the fragments that survived the ejection, 21 MJup, approaches the planetary-mass limit. This value is a factor of 1.5 smaller than that found in a similar study by Basu & Vorobyov (2012), which employs a lower numerical resolution. This suggests that the dispersal of clumps with mass ≲20 MJup is at least partly due to insufficient resolution on our logarithmically spaced polar grid. We hope to see the ejection of planetary-mass objects in future higher-resolution simulations.
For about half of the ejected fragments, the sum of the thermal and rotational energies is slightly greater than the gravitational energy, implying that they may disperse if they do not lose part of their thermal or rotational support during the subsequent evolution. All clumps are characterized by the specific angular momentum that is several orders of magnitude higher than that expected for brown dwarfs, meaning that the ejected fragments have to get rid of most their angular momentum when contracting into brown-dwarf-sized objects, possibly via the formation of circum-brown dwarf disks, jets, and outflows.
We analyzed the internal structure of ejected fragments and found that it is distinct from what would be expected for typical pre-brown dwarf cores formed via molecular cloud fragmentation. The ejected clumps are more centrally condensed and have a higher central temperature than gravitationally contracting Bonnor-Ebert spheres. The rotational velocity of the former has a bi-modal distribution and is very distinct from the rotational pattern of the latter. This difference can be used to distinguish the origin of brown dwarfs.
We note that the ejected fragments can carry away up to 30% of the total mass reservoir that is initially confined in parental cores, reducing the final stellar and disk masses and probably enriching the intracluster medium with processed dust and complex organics.
Finally, we note that in the current numerical simulations we have not taken into account the finite contraction timescale of fragments. If the gas temperature exceeds 2000 K, dissociation
of molecular hydrogen enables the contraction of AU-sized fragments to stellar-sized objects. This phenomenon is not captured in our numerical simulations owing to the insufficient numerical resolution of our grid-based code, but may, in fact, reduce the efficiency of fragment ejection. Numerical simulations employing sink particles as proxies for collapsed fragments are planned to assess this effect.
In this work, a larger than usual sink cell is used to increase the spatial resolution on the logarithmically spaced grid in the outer disk regions.
Acknowledgments
The author is thankful to the anonymous referee for insightful comments and suggestions that helped to improve the manuscript. Numerical simulations were done on the Atlantic Computational Excellence Network (ACEnet), Shared Hierarchical Academic Research Computing Network (SHARCNET), and Vienna Scientific Cluster (VSC-2). This project was supported by the Russian Ministry of Education and Science Grant 3.961.2014/K. This publication is supported by the Austrian Science Fund (FWF).
References
- Alves, J., Lombardi, M., & Lada, C. J. 2007, A&A, 462, L17 [NASA ADS] [CrossRef] [EDP Sciences] [Google Scholar]
- André, P., Ward-Thompson, D., & Barsony, M. 1993, ApJ, 406, 122 [NASA ADS] [CrossRef] [Google Scholar]
- Andre, P., Ward-Thompson, D., & Greaves, J. 2012, Science, 337, 69 [NASA ADS] [CrossRef] [PubMed] [Google Scholar]
- Baruteau, C., Meru, F., & Paardekooper, S.-J. 2011, MNRAS, 416, 1971 [NASA ADS] [CrossRef] [Google Scholar]
- Basu, S. 1997, ApJ, 485, 240 [CrossRef] [Google Scholar]
- Basu, S., & Vorobyov, E. I. 2012, ApJ, 750, 30 [NASA ADS] [CrossRef] [Google Scholar]
- Bate, M. 2009, MNRAS, 392, 590 [NASA ADS] [CrossRef] [Google Scholar]
- Bate, M. 2012, MNRAS, 419, 3115 [NASA ADS] [CrossRef] [Google Scholar]
- Bell, K. R., & Lin, D. N. C. 1994, ApJ, 427, 987 [NASA ADS] [CrossRef] [Google Scholar]
- Boley, A. C. 2009, ApJ, 695, L53 [NASA ADS] [CrossRef] [Google Scholar]
- Boley, A. C., Hayfield, T., Mayer, L., & Durisen, R. H. 2010, Icarus, 207, 509 [NASA ADS] [CrossRef] [Google Scholar]
- Boss, A. P. 1998, ApJ, 503, 923 [NASA ADS] [CrossRef] [Google Scholar]
- Caselli, P., Benson, P. J., Myers, P. C., & Tafalla, M. 2002, ApJ, 572, 238 [NASA ADS] [CrossRef] [Google Scholar]
- Cha, S.-H., & Nayakshin, S. 2011, MNRAS, 415, 3319 [NASA ADS] [CrossRef] [Google Scholar]
- D’Antona, F., & Mazzitelli, I. 1994, ApJS, 90, 467 [NASA ADS] [CrossRef] [Google Scholar]
- Dapp, W. B., & Basu, S. 2009, MNRAS, 395, 1092 [NASA ADS] [CrossRef] [Google Scholar]
- Galvagni, M., & Mayer, L. 2014, MNRAS, 437, 2909 [NASA ADS] [CrossRef] [Google Scholar]
- Gammie, C. F. 2001, ApJ, 553, 174 [NASA ADS] [CrossRef] [Google Scholar]
- Hennebelle, P., & Chabrier, G. 2008, ApJ, 684, 395 [NASA ADS] [CrossRef] [Google Scholar]
- Johnson, B. M., & Gammie, C. F. 2003, ApJ, 597, 131 [NASA ADS] [CrossRef] [Google Scholar]
- Larson, R. B. 1969, MNRAS, 145, 271 [NASA ADS] [CrossRef] [Google Scholar]
- Machida, M. N., Inutsuka, S., & Matsumoto, T. 2010, ApJ, 724, 1006 [NASA ADS] [CrossRef] [Google Scholar]
- Machida, M. N., Inutsuka, S., & Matsumoto, T. 2011, ApJ, 729, 42 [NASA ADS] [CrossRef] [Google Scholar]
- Masunaga, H., Miyama, S. M., & Inutsuka, S. 1998, ApJ, 495, 346 [Google Scholar]
- Meru, F., & Bate, M. R. 2012, MNRAS, 427, 2022 [NASA ADS] [CrossRef] [Google Scholar]
- Nayakshin, S. 2010, MNRAS, 408, 2381 [NASA ADS] [CrossRef] [Google Scholar]
- Nayakshin, S. 2011, MNRAS, 413, 1462 [NASA ADS] [CrossRef] [Google Scholar]
- Nayakshin, S., Cha, S.-H., & Bridges, J. C. 2011, MNRAS, 416, 50 [NASA ADS] [CrossRef] [Google Scholar]
- Padoan, P., & Nordlund, A. 2004, ApJ, 617, 559 [NASA ADS] [CrossRef] [Google Scholar]
- Palau, A., Zapata, L. A., & Rodriguez, L. F., et al. 2014, MNRAS, 444, 833 [NASA ADS] [CrossRef] [Google Scholar]
- Phan-Bao, N., Lee, C. F., Ho, P. T. P., & Martin, E. L. 2014, A&A, 564, A7 [NASA ADS] [CrossRef] [EDP Sciences] [Google Scholar]
- Rafikov, R. R. 2007, ApJ, 621, L69 [Google Scholar]
- Riaz, B., Thompson, M., Whelan, E. T., & Lodieu, N. 2015, MNRAS, 446, 2550 [NASA ADS] [CrossRef] [Google Scholar]
- Rice, W. K. M., Lodato, G., Pringle, J. E., Armitage, P. J., & Bonnell, I. A. 2004, MNRAS, 355, 543 [NASA ADS] [CrossRef] [Google Scholar]
- Rice, W. K. M., Paardekooper, S.-J., Forgan, D. H., & Armitage, P. J. 2014, MNRAS, 438, 1593 [NASA ADS] [CrossRef] [Google Scholar]
- Stamatellos, D., & Herczeg, G. J. 2015, MNRAS, 449, 3432 [NASA ADS] [CrossRef] [Google Scholar]
- Stamatellos, D., & Whitworth, A. P. 2009, MNRAS, 392, 413 [Google Scholar]
- Thies, I., Kroupa, P., Goodwin, S. P., Stamatellos, D., & Whitworth, A. P. 2010, ApJ, 717, 577 [NASA ADS] [CrossRef] [Google Scholar]
- Toomre, A. 1964, ApJ, 139, 1217 [NASA ADS] [CrossRef] [Google Scholar]
- Tsukamoto, Y., Machida, M. N., & Inutsuka, S. 2013, MNRAS, 436, 1667 [NASA ADS] [CrossRef] [MathSciNet] [Google Scholar]
- Vorobyov, E. I. 2010, ApJ, 713, 1059 [NASA ADS] [CrossRef] [Google Scholar]
- Vorobyov, E. I. 2011, ApJ, 728, L45 [NASA ADS] [CrossRef] [Google Scholar]
- Vorobyov, E. I. 2013, A&A, 552, A15 [NASA ADS] [CrossRef] [EDP Sciences] [Google Scholar]
- Vorobyov, E. I., & Basu, S. 2010, ApJ, 719, 1896 [NASA ADS] [CrossRef] [Google Scholar]
- Vorobyov, E. I., & Basu, S. 2013, Mem. Soc. Astron. It., 84, 866 [NASA ADS] [Google Scholar]
- Vorobyov, E. I., & Basu, S. 2015, ApJ, 805, 115 [NASA ADS] [CrossRef] [Google Scholar]
- Vorobyov, E. I., Zakhozhay, O., & Dunham, M. M. 2013, MNRAS, 433, 3256 [NASA ADS] [CrossRef] [Google Scholar]
- Williams, J. P., & Cieza, L. A. 2011, ARA&A, 49, 67 [NASA ADS] [CrossRef] [Google Scholar]
- Zhu, Z., Hartmann, L., Nelson, R. P., & Gammie, C. F. 2012, ApJ, 746, 110 [NASA ADS] [CrossRef] [Google Scholar]
All Tables
All Figures
|
Fig. 1 Evolution of the disk in Model 1. Shown is the gas surface density in g cm-2 at six times elapsed since the formation of the central star (represented schematically by the red circle in the coordinate center). The scale bar is in log g cm-2. |
| In the text | |
|
Fig. 2 Three ejection events in Model 1. The first ejected objects are shown with the green arrows indicating low-mass clumps which dispersed soon after leaving the disk. The yellow circles outline the second ejected object – a massive fragment that withstood ejection and left the computational region. The yellow arrows show the final ejected clump which also dispersed. The vertical bar is in log g cm-2. |
| In the text | |
|
Fig. 3 Two ejection events in Model 2. The first ejected objects are shown with the green arrows indicating low-mass clumps which dispersed soon after leaving the disk. The second ejected object is a massive fragment outlined by the yellow circles, it breaks into a binary system soon after leaving the disk. The scale bar is in log g cm-2. |
| In the text | |
|
Fig. 4 Left column: distribution of the gas surface density (left column, g cm-2, log units) and the |
| In the text | |
|
Fig. 5 Two ejected events in Model 3. The first ejected objects are shown by the yellow and green arrows. They survive the ejection event and then leave the computational region. In particular, the fragment shown by the yellow arrow has the lowest mass found in our simulations, 21 MJup. The second ejection is highlighted by the yellow circle, comprising three fragments. None of these objects survived the ejection. The scale bar is in g cm2. |
| In the text | |
|
Fig. 6 Zoomed-in view on several ejected fragments in Models 1–5. The corresponding time is indicated in every panel. The gas velocity field (yellow arrows) are shown, superimposed on the gas surface density distribution. The black contour lines outline the fragments according to the adopted fragment tracing algorithm. The scale bar is log g cm-2. |
| In the text | |
|
Fig. 7 Azimuthally averaged radial profiles of the gas surface density (top panel), temperature (middle panel), and rotation velocity (bottom panel) for several best-resolved fragments in Models 1, 3, and 5. The black lines show the radial gas surface density, temperature. and rotational velocity profiles of a vertically integrated, gravitationally contracting Bonnor-Ebert sphere in the pre-stellar phase (solid lines), pre-disk phase (dashed lines), and post-disk phase (dash-dotted lines). The doted lines represent the radial slopes for comparison. |
| In the text | |
|
Fig. 8 Mass of gas that leaves the outer computational boundary in Models 1–5 as a function of time elapsed since the formation of the disk. Steep rises in the outflown mass are caused by dense fragments passing through the outer boundary after being ejected from the disk. |
| In the text | |
Current usage metrics show cumulative count of Article Views (full-text article views including HTML views, PDF and ePub downloads, according to the available data) and Abstracts Views on Vision4Press platform.
Data correspond to usage on the plateform after 2015. The current usage metrics is available 48-96 hours after online publication and is updated daily on week days.
Initial download of the metrics may take a while.