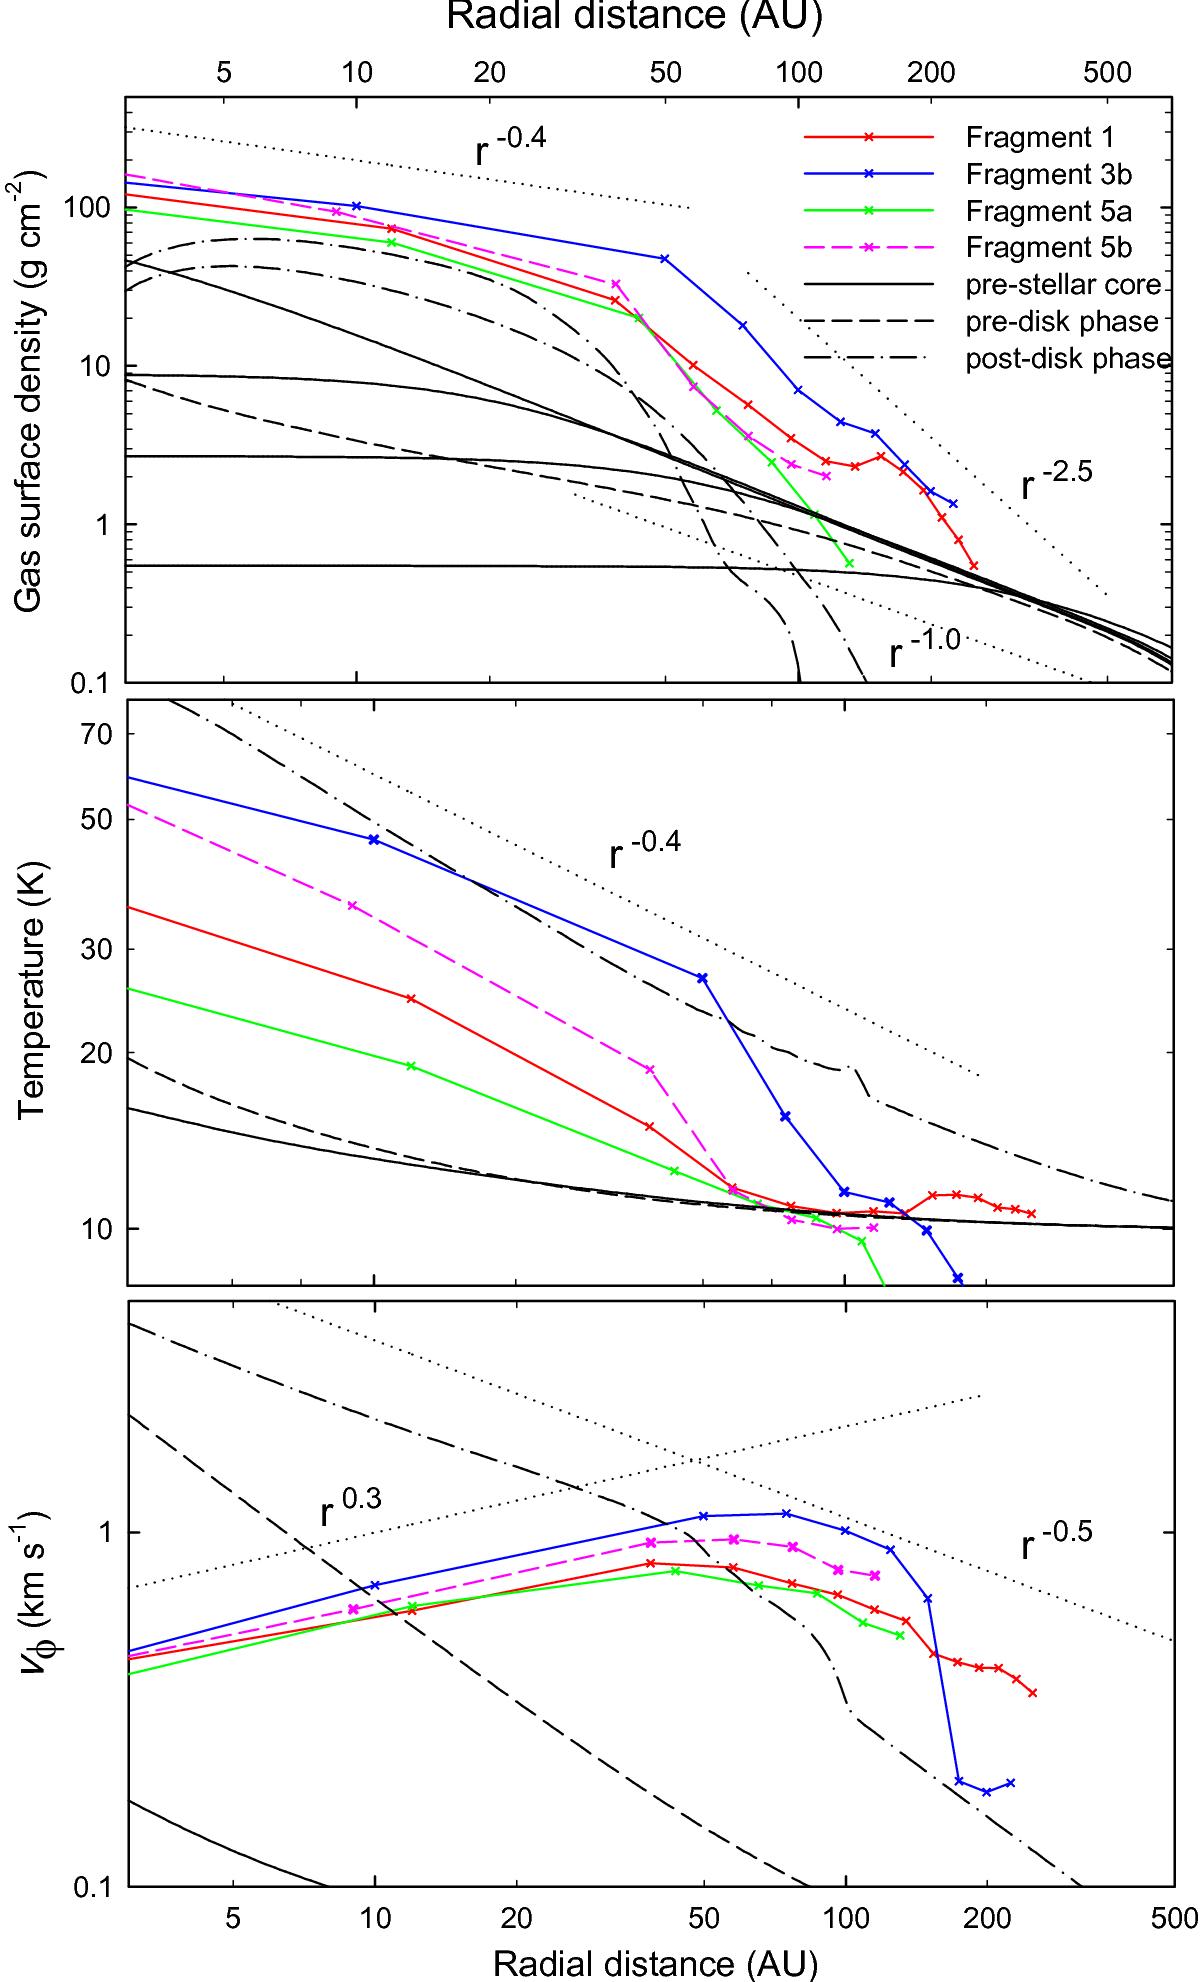
Fig. 7

Azimuthally averaged radial profiles of the gas surface density (top panel), temperature (middle panel), and rotation velocity (bottom panel) for several best-resolved fragments in Models 1, 3, and 5. The black lines show the radial gas surface density, temperature. and rotational velocity profiles of a vertically integrated, gravitationally contracting Bonnor-Ebert sphere in the pre-stellar phase (solid lines), pre-disk phase (dashed lines), and post-disk phase (dash-dotted lines). The doted lines represent the radial slopes for comparison.
Current usage metrics show cumulative count of Article Views (full-text article views including HTML views, PDF and ePub downloads, according to the available data) and Abstracts Views on Vision4Press platform.
Data correspond to usage on the plateform after 2015. The current usage metrics is available 48-96 hours after online publication and is updated daily on week days.
Initial download of the metrics may take a while.


