Fig. 6
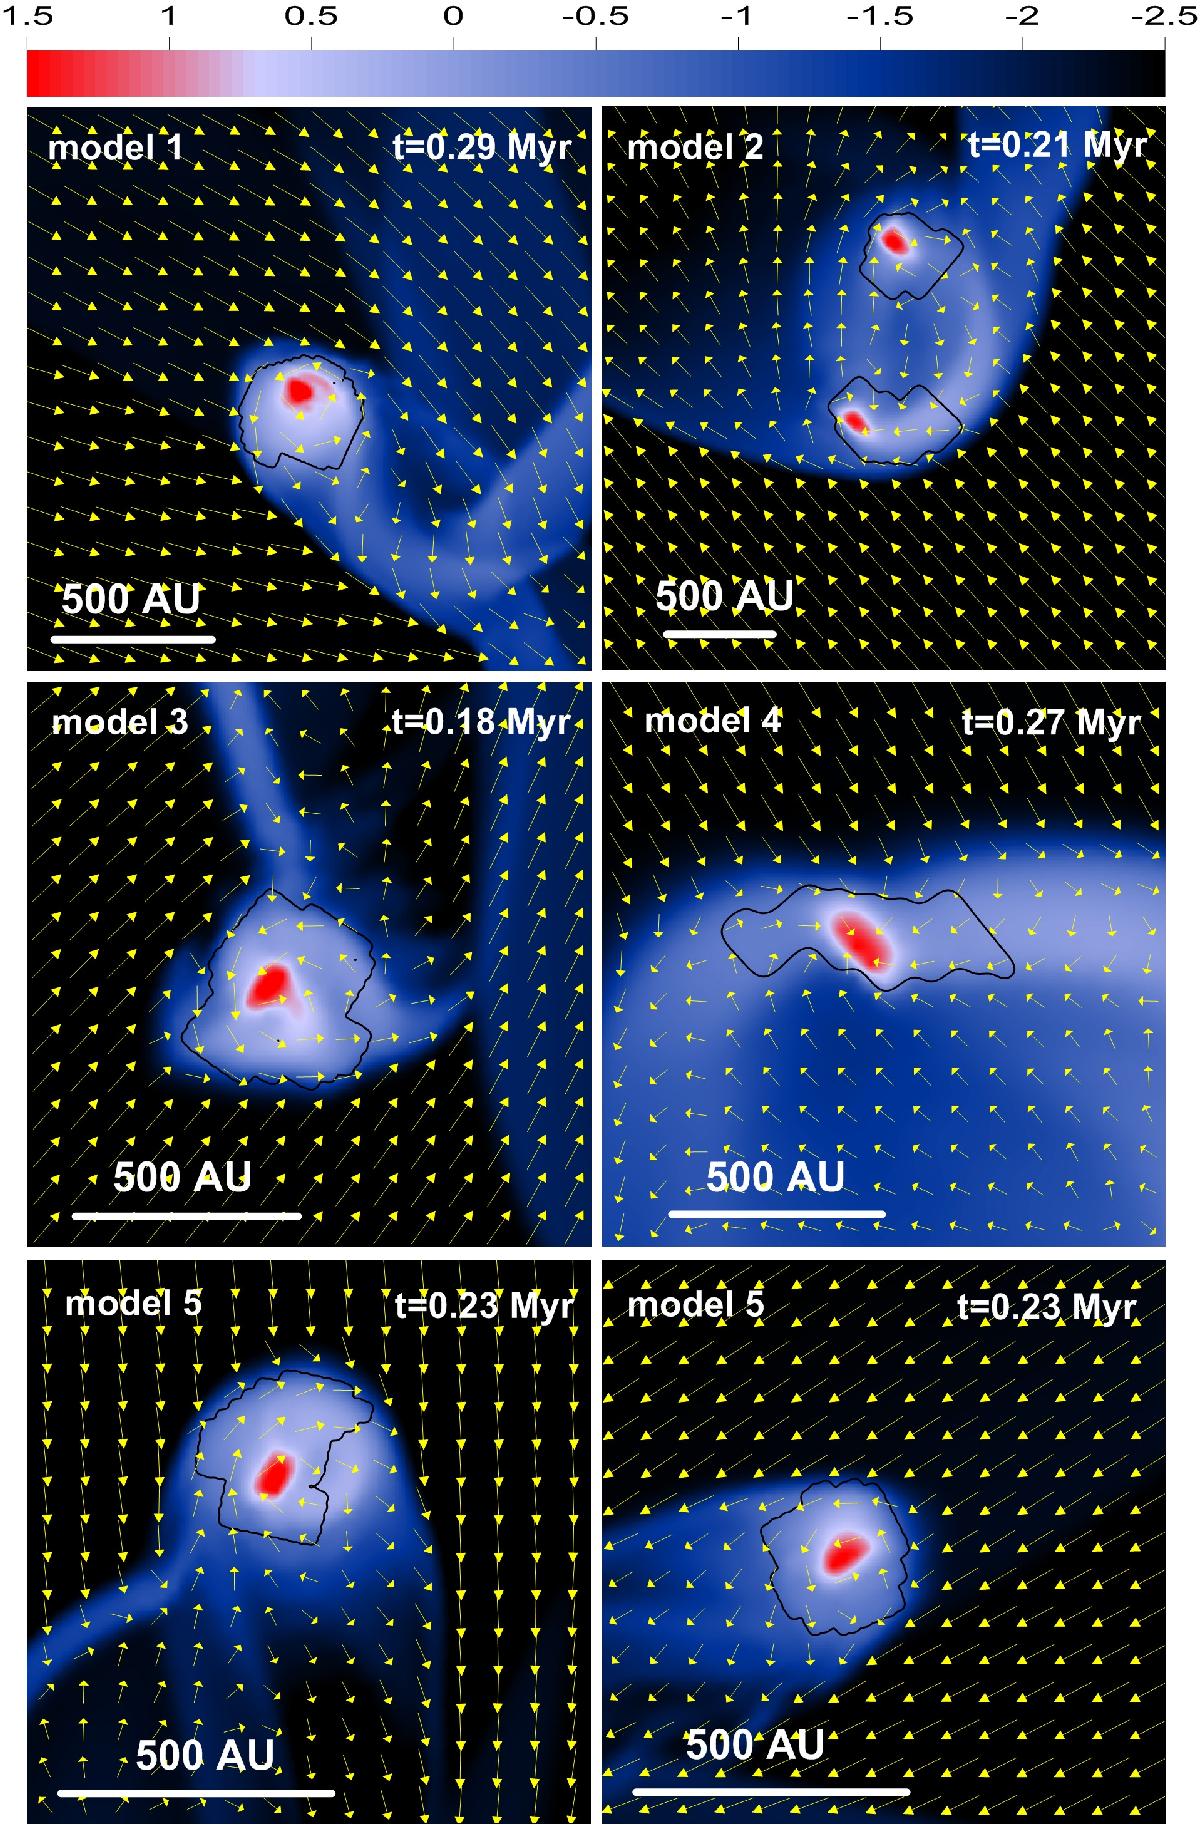
Zoomed-in view on several ejected fragments in Models 1–5. The corresponding time is indicated in every panel. The gas velocity field (yellow arrows) are shown, superimposed on the gas surface density distribution. The black contour lines outline the fragments according to the adopted fragment tracing algorithm. The scale bar is log g cm-2.
Current usage metrics show cumulative count of Article Views (full-text article views including HTML views, PDF and ePub downloads, according to the available data) and Abstracts Views on Vision4Press platform.
Data correspond to usage on the plateform after 2015. The current usage metrics is available 48-96 hours after online publication and is updated daily on week days.
Initial download of the metrics may take a while.