Fig. 5
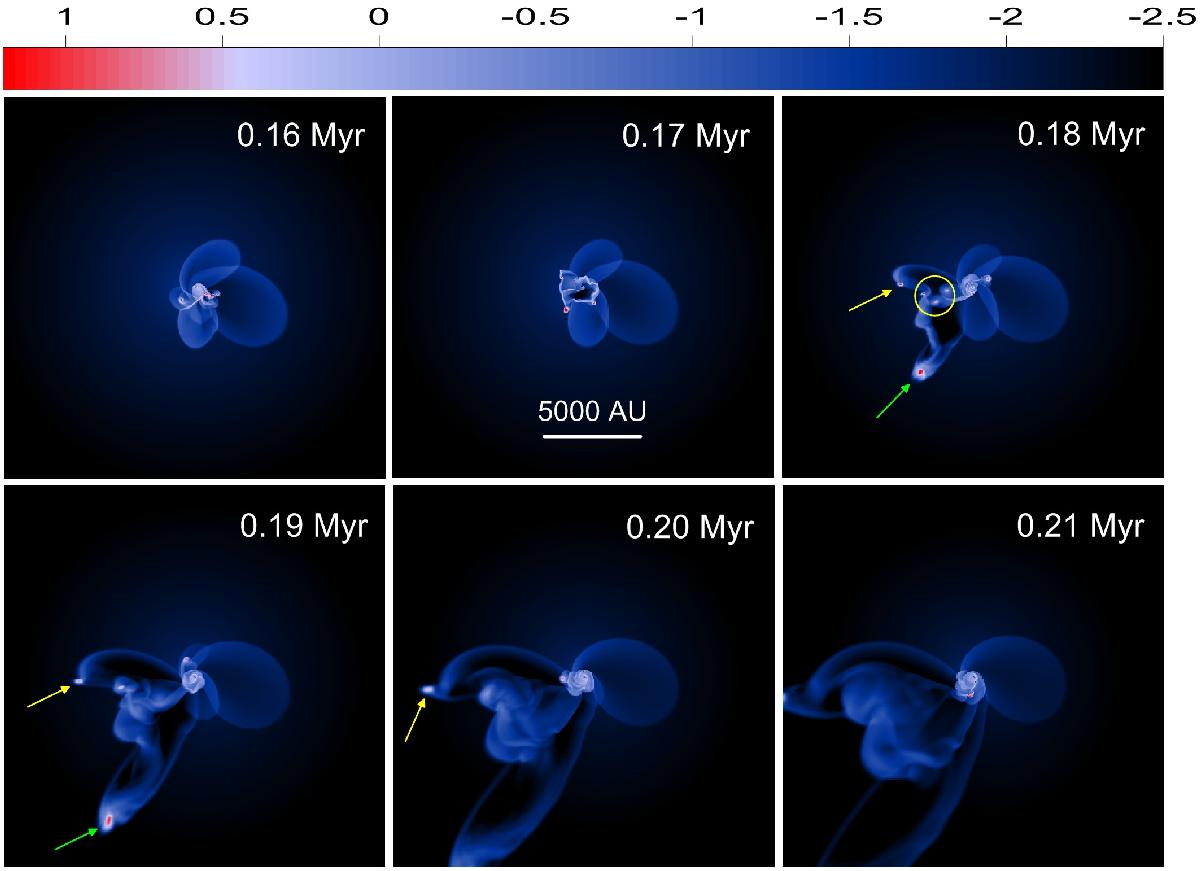
Two ejected events in Model 3. The first ejected objects are shown by the yellow and green arrows. They survive the ejection event and then leave the computational region. In particular, the fragment shown by the yellow arrow has the lowest mass found in our simulations, 21 MJup. The second ejection is highlighted by the yellow circle, comprising three fragments. None of these objects survived the ejection. The scale bar is in g cm2.
Current usage metrics show cumulative count of Article Views (full-text article views including HTML views, PDF and ePub downloads, according to the available data) and Abstracts Views on Vision4Press platform.
Data correspond to usage on the plateform after 2015. The current usage metrics is available 48-96 hours after online publication and is updated daily on week days.
Initial download of the metrics may take a while.