Fig. 4
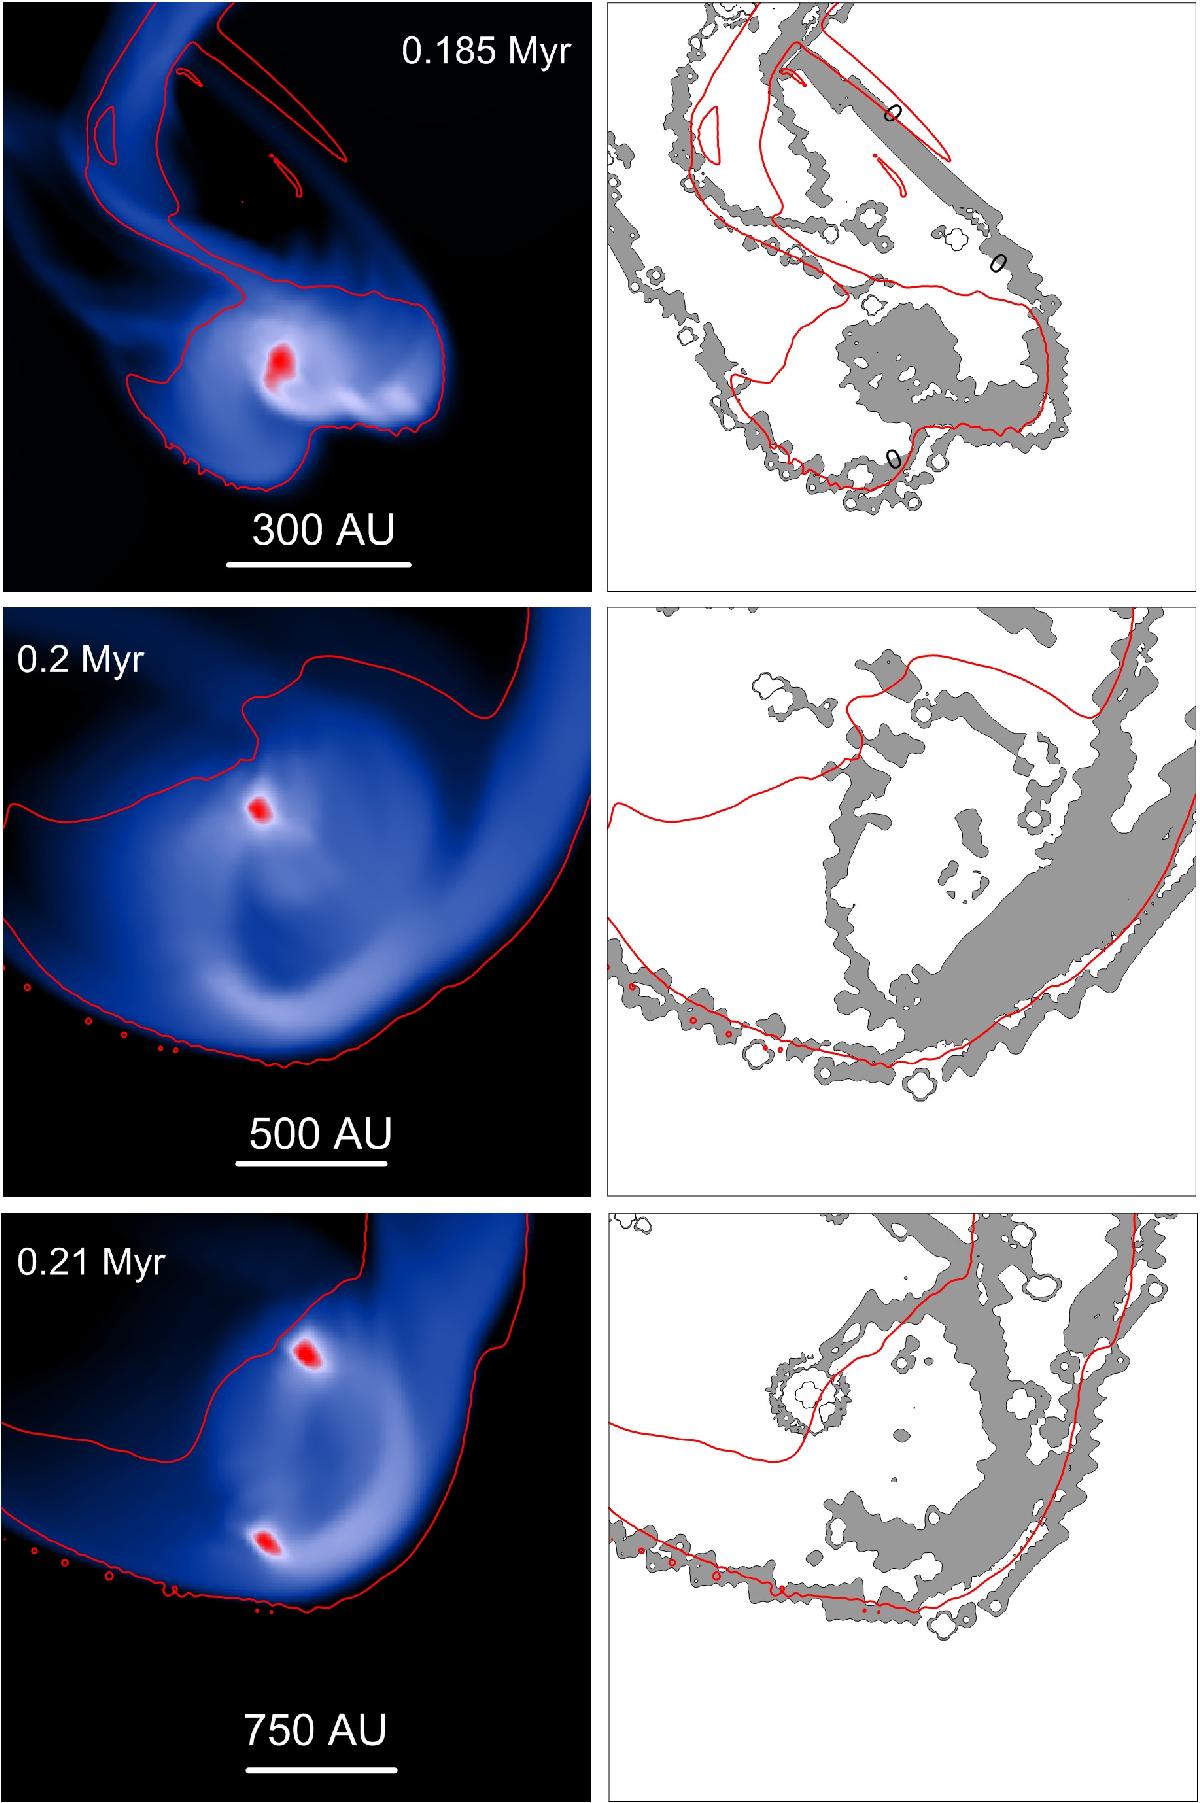
Left column: distribution of the gas surface density (left column, g cm-2, log units) and the ![]() -parameter (right column, log units) in and around the ejected fragment undergoing fragmentation. Only the regions with
-parameter (right column, log units) in and around the ejected fragment undergoing fragmentation. Only the regions with ![]() are shown with the gray color to identify areas where cooling is sufficiently fast for gravitational fragmentation to occur. The contour lines outline the regions where the Q-parameter is lower than unity.
are shown with the gray color to identify areas where cooling is sufficiently fast for gravitational fragmentation to occur. The contour lines outline the regions where the Q-parameter is lower than unity.
Current usage metrics show cumulative count of Article Views (full-text article views including HTML views, PDF and ePub downloads, according to the available data) and Abstracts Views on Vision4Press platform.
Data correspond to usage on the plateform after 2015. The current usage metrics is available 48-96 hours after online publication and is updated daily on week days.
Initial download of the metrics may take a while.