Free Access
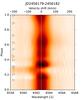
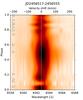
Fig. 7
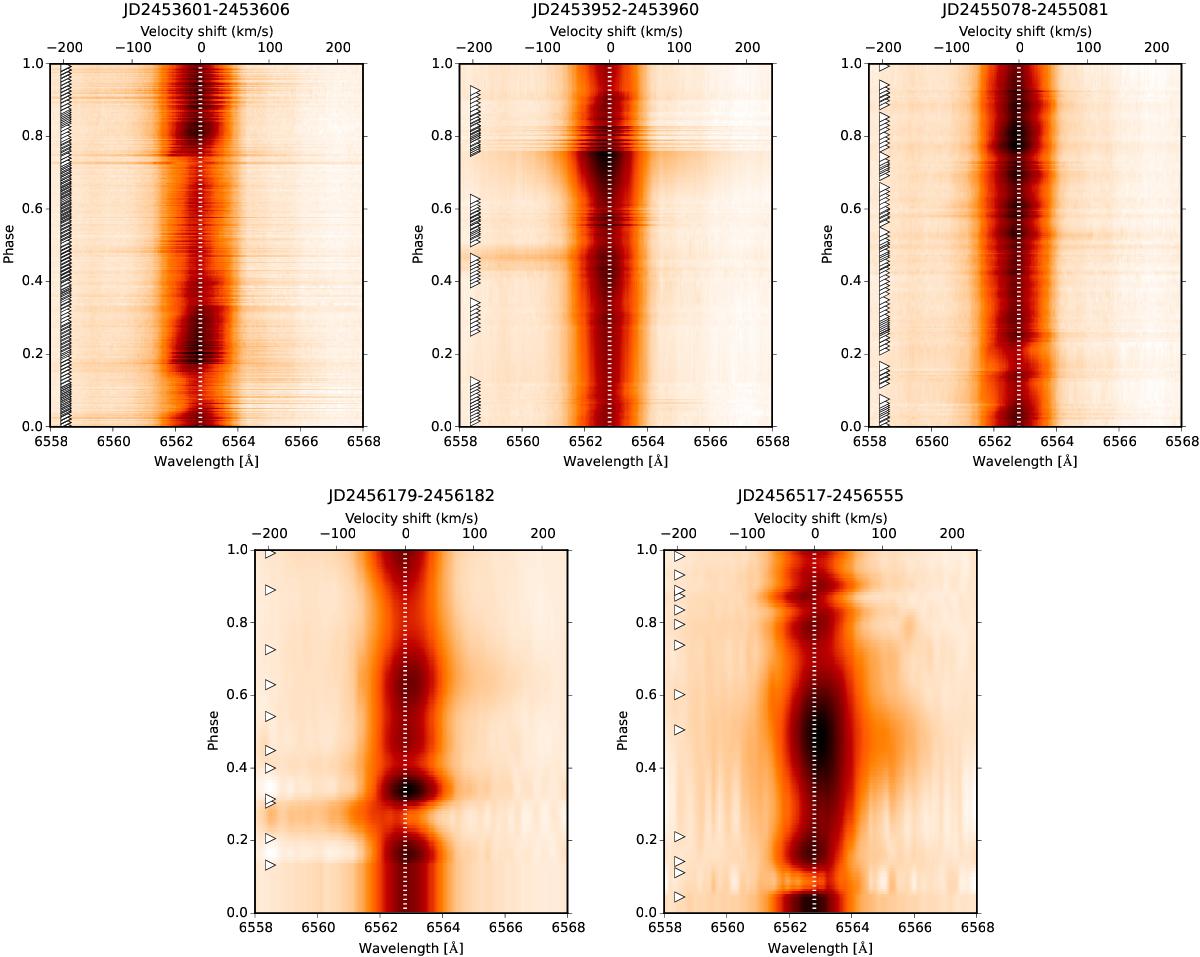
Phased dynamic Hα spectra from 2005, 2006, 2009 (CFHT observations, top row), 2012, and 2013 (RCC observations, bottom row). Triangles mark the rotational phases of the individual spectra, and a dotted line shows the 0 km s-1 velocity shift.
This figure is made of several images, please see below:
Current usage metrics show cumulative count of Article Views (full-text article views including HTML views, PDF and ePub downloads, according to the available data) and Abstracts Views on Vision4Press platform.
Data correspond to usage on the plateform after 2015. The current usage metrics is available 48-96 hours after online publication and is updated daily on week days.
Initial download of the metrics may take a while.