Free Access
Fig. 5
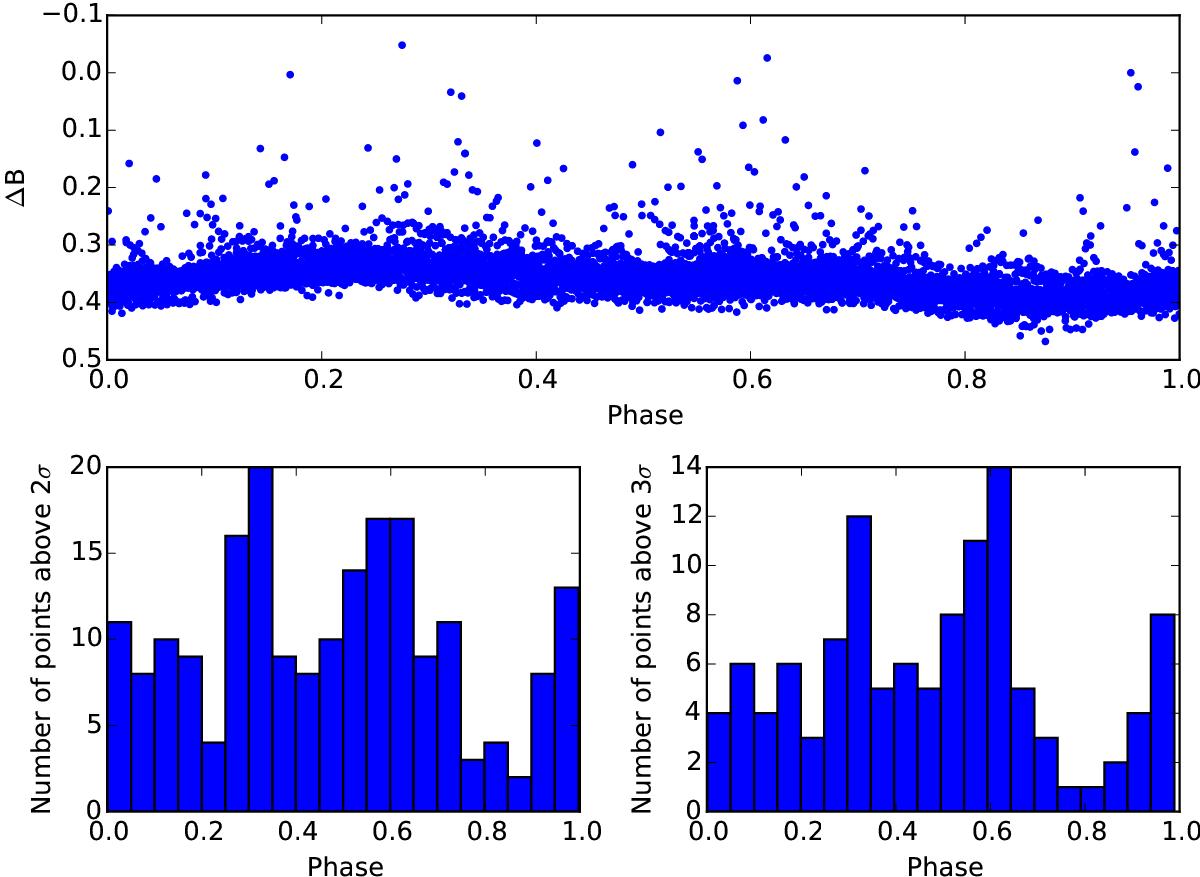
Phased ΔB light curves as used for flare statistics (top) and number of light curve points above 2σ/3σ after removing the effect of spottedness (bottom). The top plot does not show the whole magnitude range of flares to better visualise the spotted light curve.
Current usage metrics show cumulative count of Article Views (full-text article views including HTML views, PDF and ePub downloads, according to the available data) and Abstracts Views on Vision4Press platform.
Data correspond to usage on the plateform after 2015. The current usage metrics is available 48-96 hours after online publication and is updated daily on week days.
Initial download of the metrics may take a while.