Free Access
Fig. 3
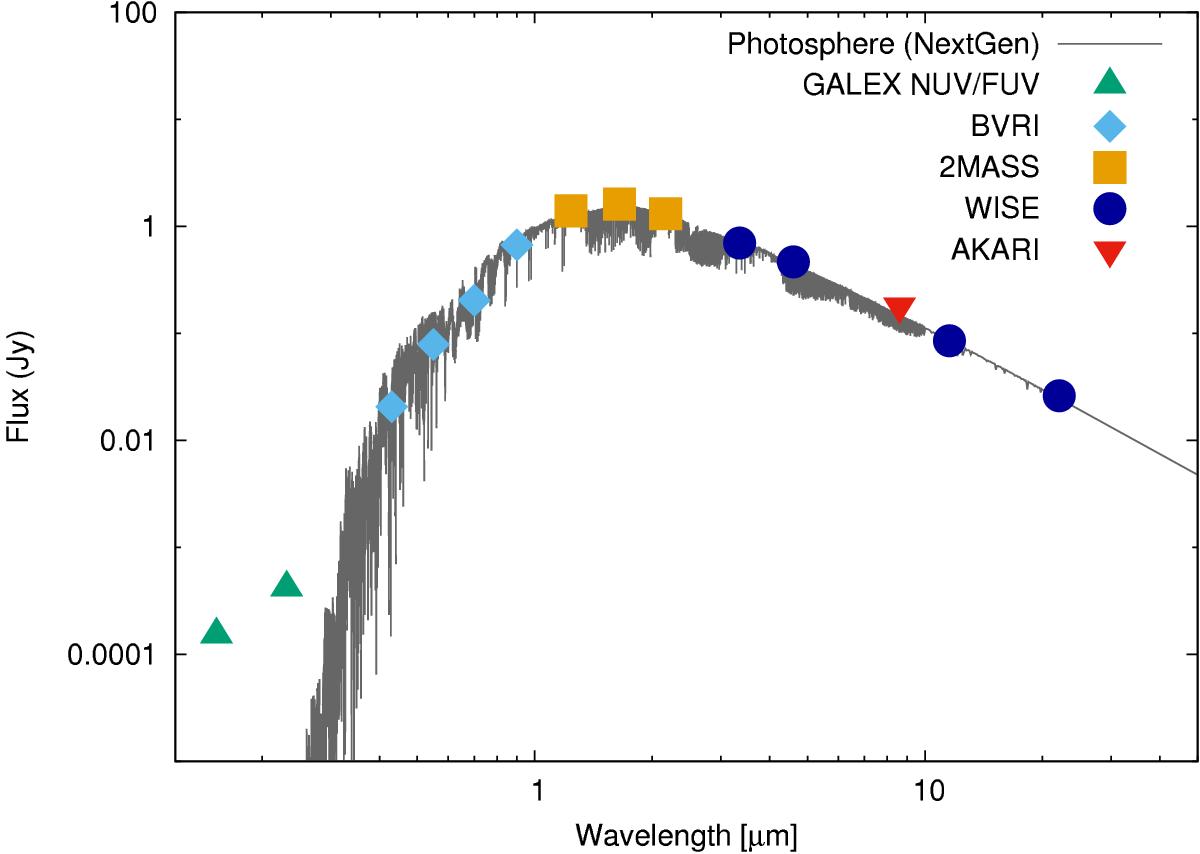
Spectral energy distribution of V374 Peg from the ultraviolet to mid-infrared using NextGen model atmospheres (see text for more details). Errors bars are smaller than the symbols used for the plot.
Current usage metrics show cumulative count of Article Views (full-text article views including HTML views, PDF and ePub downloads, according to the available data) and Abstracts Views on Vision4Press platform.
Data correspond to usage on the plateform after 2015. The current usage metrics is available 48-96 hours after online publication and is updated daily on week days.
Initial download of the metrics may take a while.