Free Access
Fig. 10
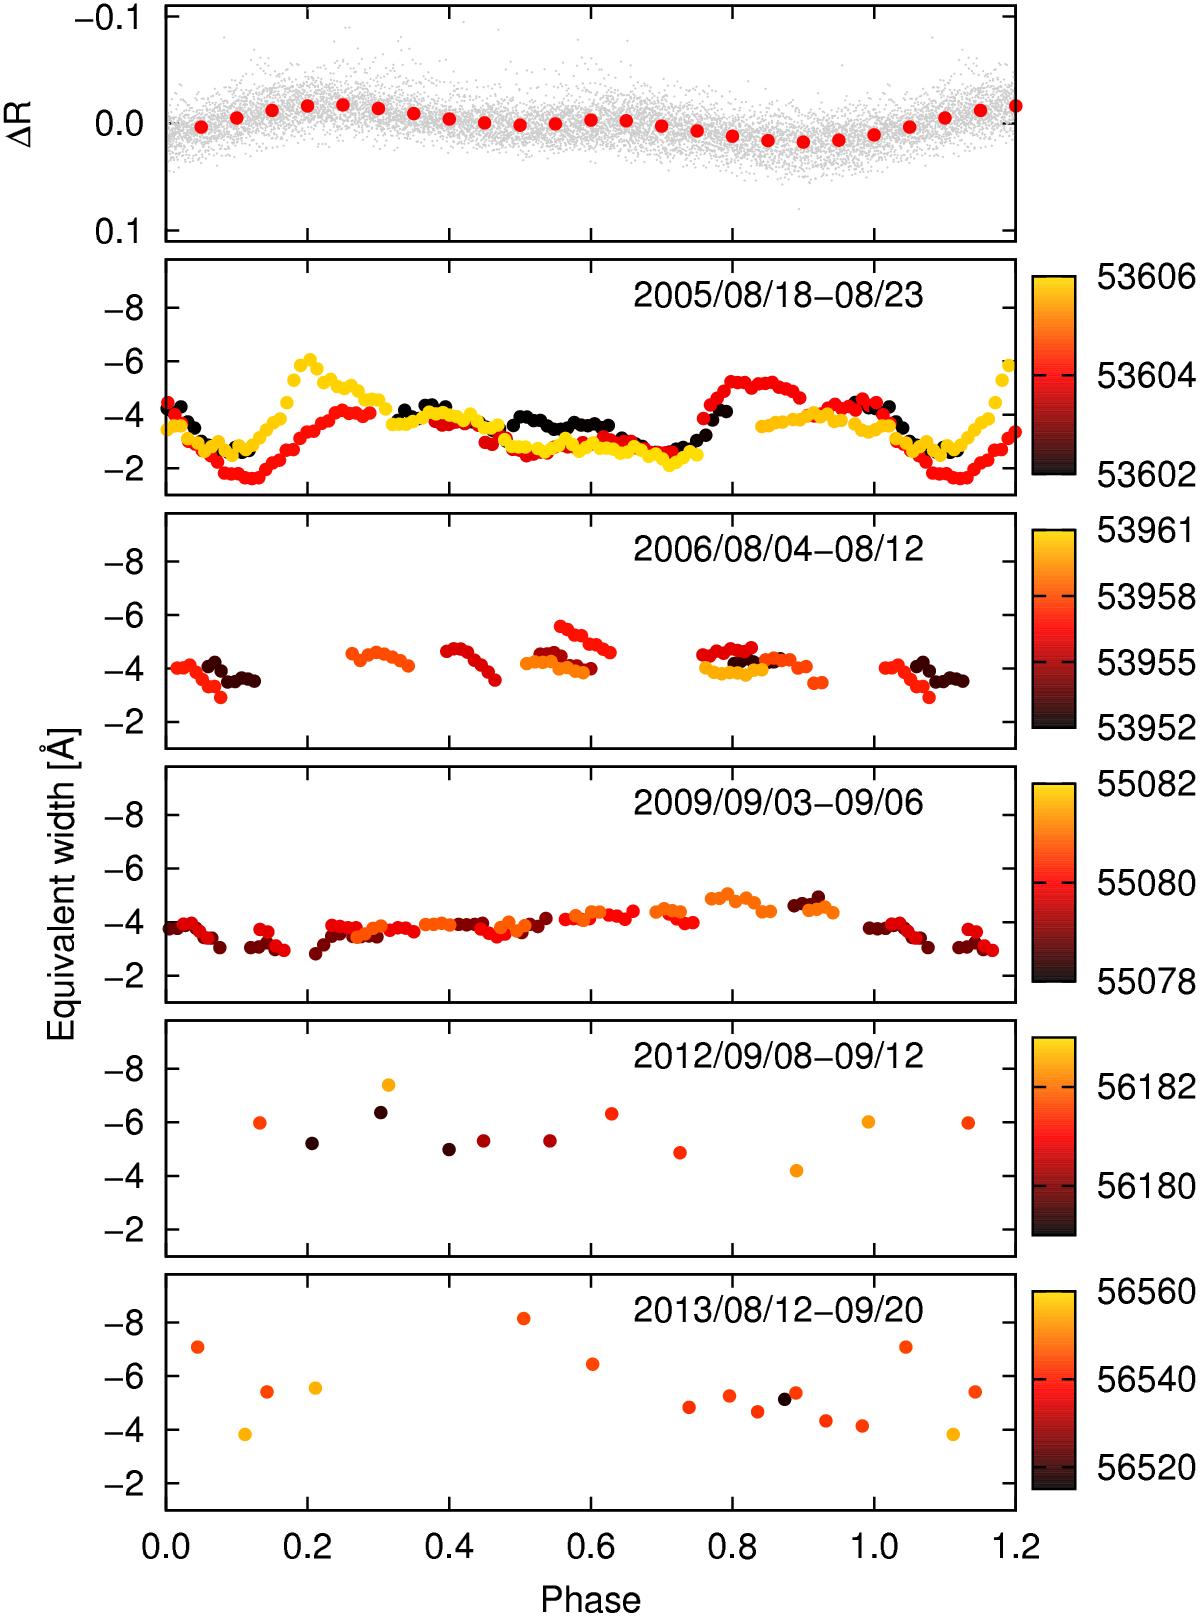
Top plot: folded and averaged ΔR light curve of V374 Peg, including the observations from 1998 and 2000, after removing long-term trends. Bottom plots: change in Hα equivalent width with rotational phase, colours brightening with time.
Current usage metrics show cumulative count of Article Views (full-text article views including HTML views, PDF and ePub downloads, according to the available data) and Abstracts Views on Vision4Press platform.
Data correspond to usage on the plateform after 2015. The current usage metrics is available 48-96 hours after online publication and is updated daily on week days.
Initial download of the metrics may take a while.