Free Access
Fig. 1
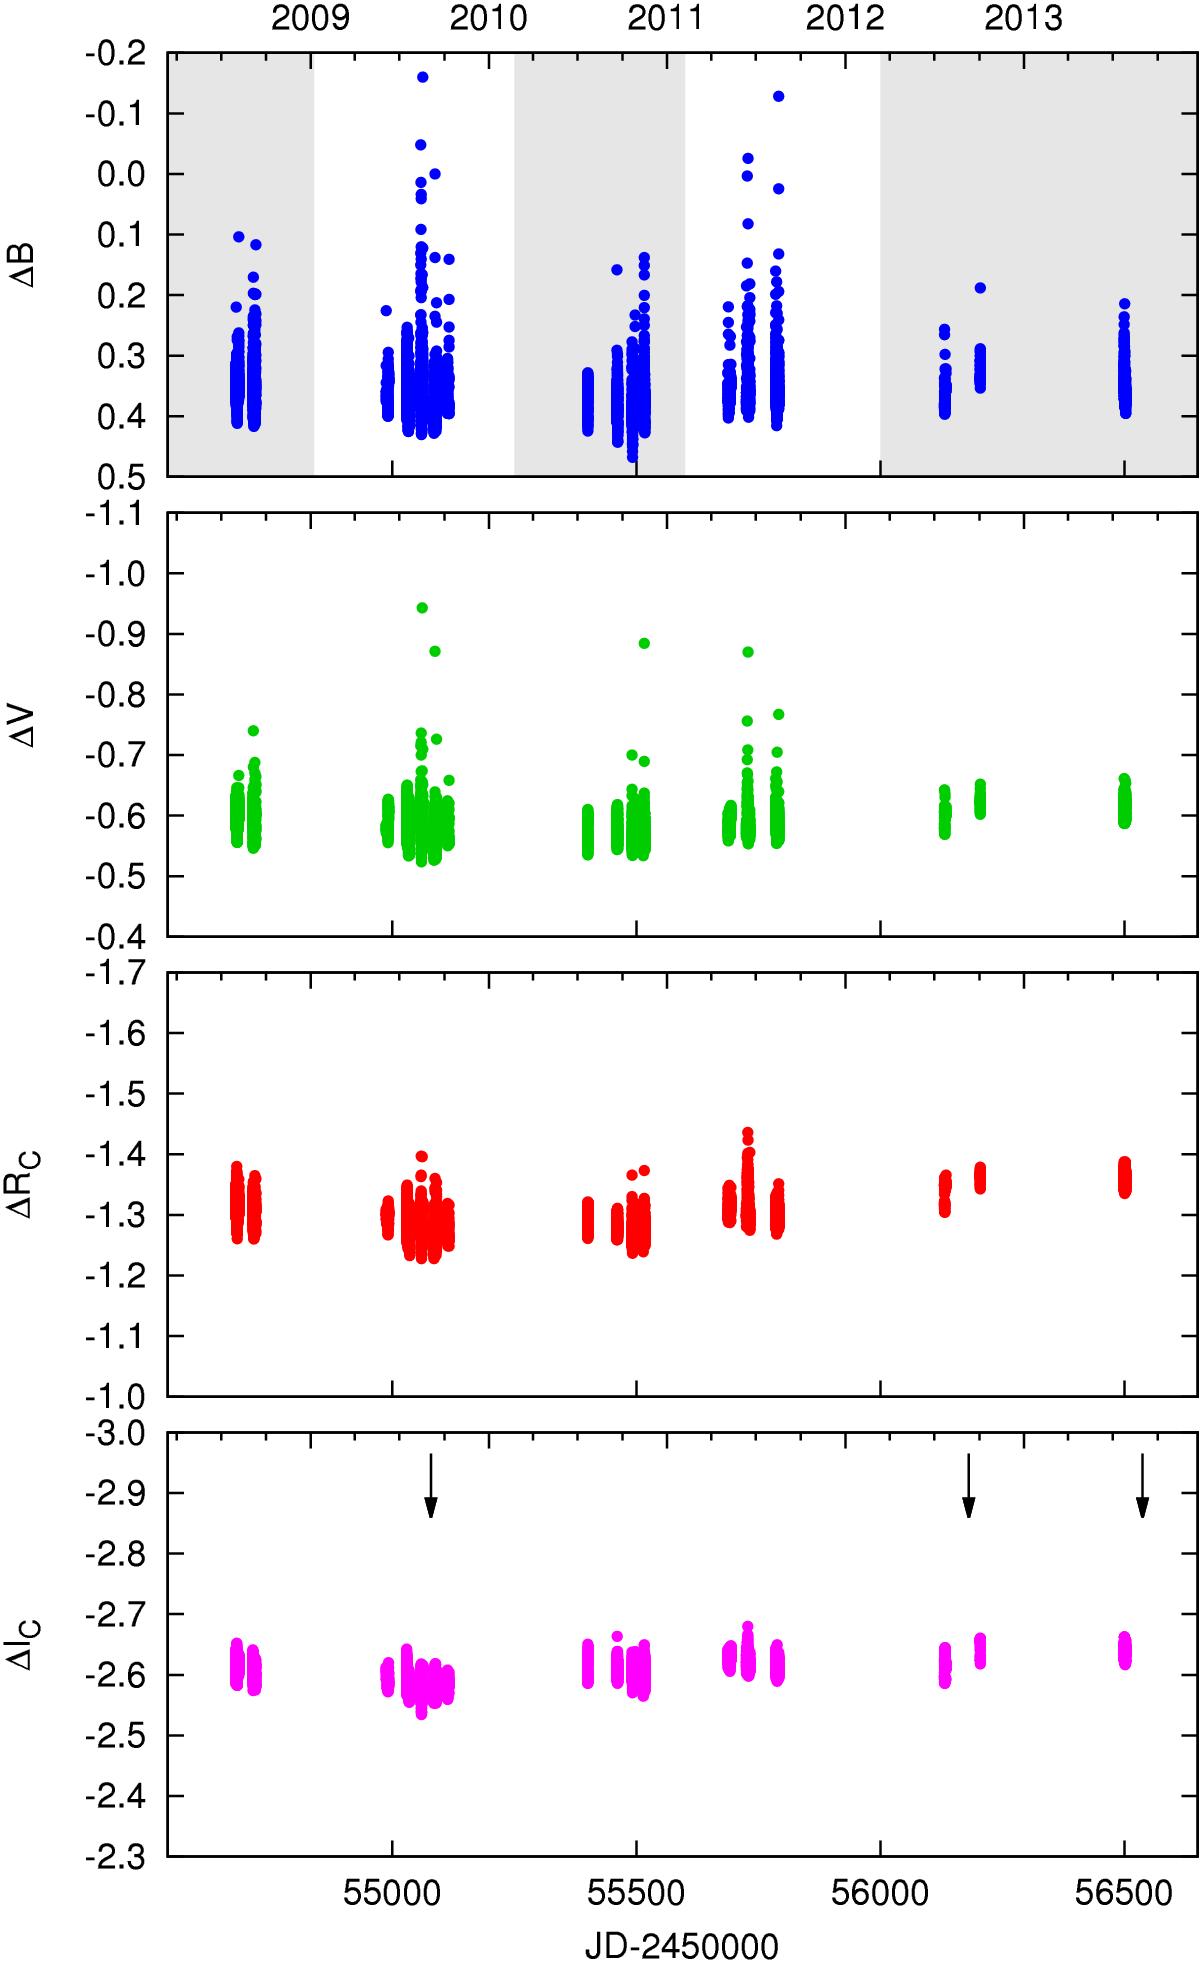
BV(RI)C photometry of V374 Peg from the Piszkéstető observations. Ranges marked in the ΔB light curve were used for flare statistics (see Sect. 4.1). Arrows over the ΔI light curve point at the dates of the spectroscopic observations during this time.
Current usage metrics show cumulative count of Article Views (full-text article views including HTML views, PDF and ePub downloads, according to the available data) and Abstracts Views on Vision4Press platform.
Data correspond to usage on the plateform after 2015. The current usage metrics is available 48-96 hours after online publication and is updated daily on week days.
Initial download of the metrics may take a while.