Fig. 8
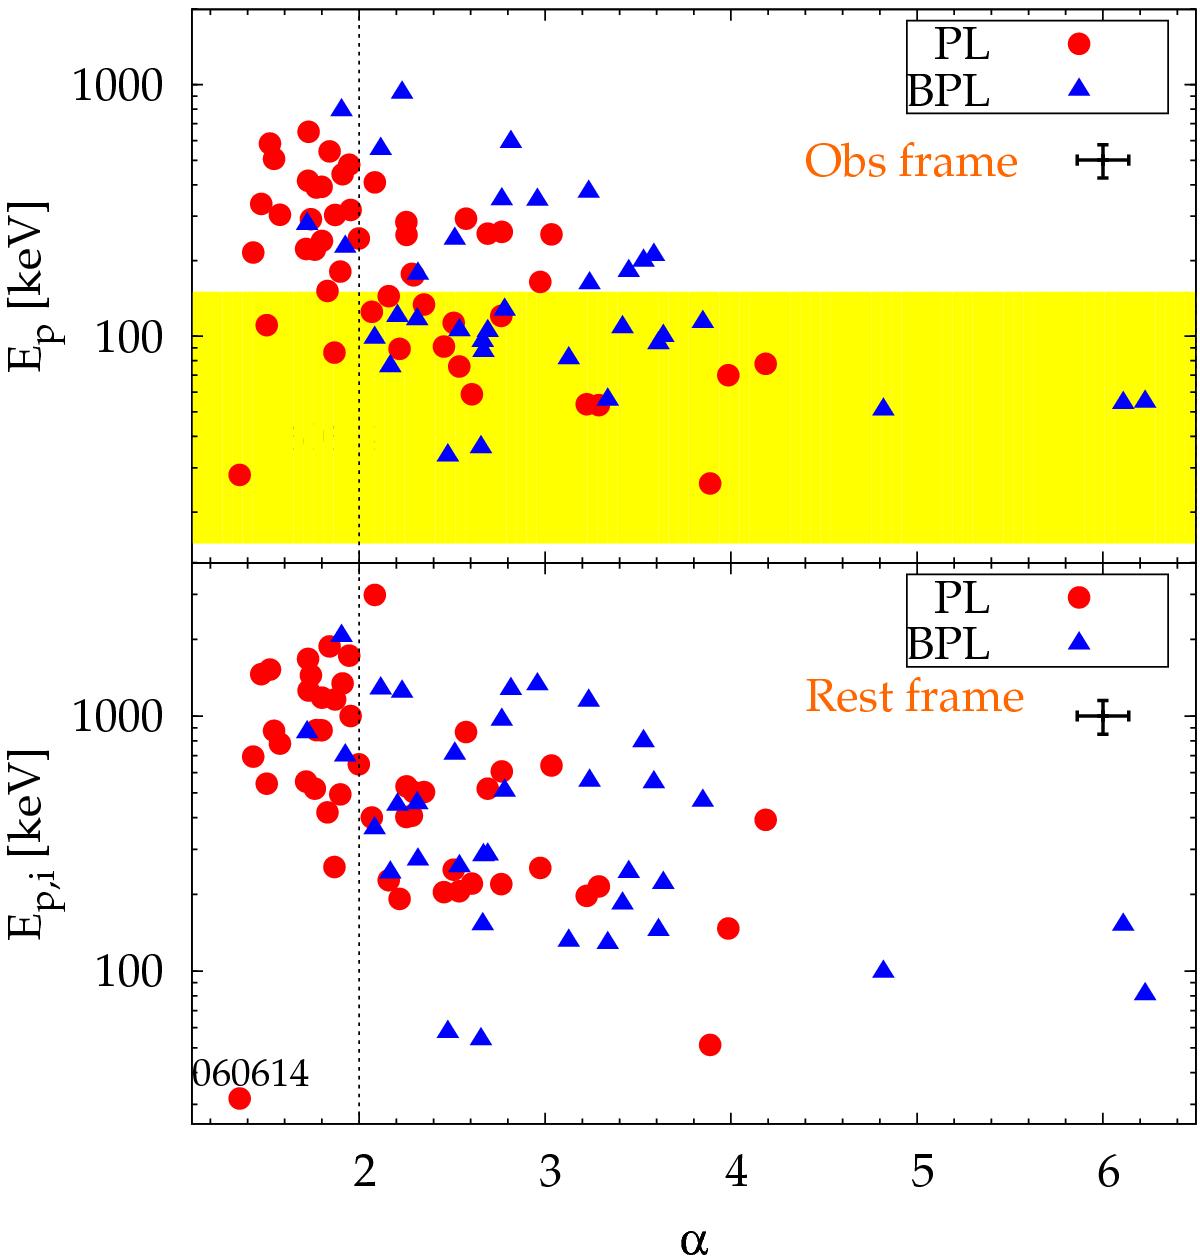
Top panel: observed peak energy Ep vs. the power-law index α of the PDS (15−150 keV) for a sample of GRBs with known redshift and well-constrained time–averaged energy spectrum. The shaded area highlights the BAT energy passband. Bottom panel: same plot in the intrinsic plane, i.e. where the peak energy Ep,i refers to the GRB comoving frame. Circles (triangles) correspond to pl (bpl) model. Median errors are shown (top right). The dashed line shows the case α = 2.
Current usage metrics show cumulative count of Article Views (full-text article views including HTML views, PDF and ePub downloads, according to the available data) and Abstracts Views on Vision4Press platform.
Data correspond to usage on the plateform after 2015. The current usage metrics is available 48-96 hours after online publication and is updated daily on week days.
Initial download of the metrics may take a while.