| Issue |
A&A
Volume 588, April 2016
|
|
|---|---|---|
| Article Number | A20 | |
| Number of page(s) | 8 | |
| Section | Stellar structure and evolution | |
| DOI | https://doi.org/10.1051/0004-6361/201527928 | |
| Published online | 11 March 2016 | |
A new insight into the variability of V1184 Tauri
1
INAF–Osservatorio Astronomico di Roma, via Frascati 33,
00040
Monte Porzio Catone,
Italy
e-mail:
This email address is being protected from spambots. You need JavaScript enabled to view it.
2
Fundación Galileo Galilei – INAF, Telescopio Nazionale Galileo,
38700 Santa Cruz de la Palma, Tenerife, Spain
3
INAF–Istituto di Astrofisica e Planetologia Spaziali, via del
Fosso del Cavaliere 100, 00133
Roma,
Italy
4
Central Astronomical Observatory of Pulkovo,
Pulkovskoe shosse
65, 196140
St. Petersburg,
Russia
5
Astronomical Institute of St. Petersburg University,
198504
St. Petersburg,
Russia
6
Dipartimento di Matematica e Fisica, Universitá del
Salento, 73100
Lecce,
Italy
Received: 9 December 2015
Accepted: 29 January 2016
Abstract
Context. V1184 Tau is a young variable that for a long time has been monitored at optical wavelengths. Its variability has been ascribed to a sudden and repetitive increase of the circumstellar extinction (UXor-type variable), but the physical origin of this kind of variation, although hypothesized, has not been fully supported on an observational basis.
Aims. With the aim of getting a new insight into the variability of V1184 Tau, we present here new photometric and spectroscopic observations that were taken in the period 2008−2015. During that time, the source reached the same high brightness level that it had before the remarkable fading of about 5 mag, which happened in 2004. The optical spectrum is the first to be obtained when the continuum was at its maximum level.
Methods. All the observational data are interpreted in the framework of extinction-driven variability. In particular, we analyze light curves, optical and near-infrared colors, spectral energy distribution, and optical spectrum.
Results. The emerging picture indicates that the source fading is due to an extinction increase of ΔAV ~ 5 mag, which is associated with the appearance of a strong infrared excess, attributable to a thermal component a T ~ 1000 K. From the flux of Hα, we derive a mass accretion rate in the range 10-11–5 × 10⁻¹⁰M⊙ yr-1 s, which is marginally consistent with what is expected for a classical T Tauri star of similar mass. The source spectral energy distribution was fitted for both the high- and low- level of brightness. Remarkably, a scenario that is consistent with the known stellar properties (such as spectral type, mass, and radius) is obtained only if the distance to the source is of few hundreds of parsecs, in contrast with the commonly assumed value of ~1.5 kpc.
Conclusions. Our analysis partially supports a previous model, according to which the circumstellar disk undergoes a periodic puffing, the observational effects of which both shield the central star and provide evidence of disk wind activity. However, since the mass accretion rate remains almost constant with time, the source is likely not subject to accretion bursts.
Key words: stars: formation / stars: variables: T Tauri, Herbig Ae/Be / infrared: stars / stars: individual: V1184 Tauri
© ESO, 2016
1. Introduction
Photometric and spectroscopic variability is a common and defining feature of young stellar objects (YSOs). When it occurrs on a short time-scale (hours or days), it is often related to flaring activity or to the formation of hot or cool spots onto the stellar surface (e.g. Herbst et al. 1994), while variability on longer time-scale (years or tens of years) is likely due to accretion bursts or to sudden changes in the local extinction.
Long-term, pre-main sequence variables are classified on the basis of the phenomenology of the fluctuations, such as amplitude, duration, recurrence time between subsequent events, presence of absorption or emission lines in the source spectrum (for a review see Audard et al. 2014). Three phenomenological classes have been identified: FUor (Hartmann & Kenyon 1985), EXor (Herbig 1989), and UXor (Herbst et al. 1994). The interaction between the circumstellar disk and the central star plays a fundamental role in all three classes: FUor and EXor bursts are caused by rapid variations of the mass accretion rate from the disk, UXor events are due the recurrent appearance of an obscuring obstacle likely located in the disk itself. Given the strong relationship with a non-spherically symmetric structure, the emerging flux is expected to be largely influenced by the inclination of the line of sight to the system. In some cases, this kind of circumstance might significantly affect the proposed scenario or even the object classification.
In this respect, V1184 Tau ( 77,
77,  79) is interesting because of its unusual photometric behavior. The source, likely seen edge-on, is a G5 III-IV pre-main-sequence star, with estimated mass ≈2 M⊙ and bolometric luminosity between 7 and 39 L⊙ (Alves et al. 1997). The object is seen in projection in the Bok globule CB 34 (Clemens & Barvainis 1988), whose estimated distance is about 1.5 kpc. The intense star formation activity that occurrs in this large globule was quantified using infrared (IR) and radio observations by Khanzadyan et al. (2002), who complemented the original discovery of Herbig-Haro (HH) objects (Moreira & Yun 1995).
Near-infrared photometry.
The star V1184 Tau attracted the attention of Alves et al. (1997) and Yun et al. (1997), who both noted a brightening of about 4 mag between the Palomar Observatory Sky Survey (POSS) exposures of 1951 and 1994. Their original classification of V1184 Tau as a FUor system has been reconsidered in the light of more recent observational studies. Its recent history has been monitored by Semkov (2004a,b, 2006) and by Semkov et al. (2008, 2015) who rejected the FUor original hypothesis and classified V1184 Tau as an UXor object that exhibits extinction-driven variations. Indeed, until 2004, the star presented a quite constant flux level (I ~ 13.0 mag), followed by a slow but deep fading (from 2004 to 2006, called the “2004 photometric catastrophe”) down to I ~ 17 mag, overlapped by short-time variability episodes (with amplitude of up to 0.6−0.8 mag in the J-band), which occur on timescales of days. Such rapid variations have been interpreted by Tackett et al. (2003) as due to the rapid formation of thermal spots onto the stellar surface.
Near-infrared photometry of V1184 Tau was presented by Grinin et al. (2009), who proposed a very interesting and comprehensive model, emphasizing the importance of the disk inner rims in both extinguishing and reflecting the star emission. According to the proposed scenario, the source variability is explained by the intermittent increase of the geometric thickness of the internal disk, which is caused by the migration of material from the external disk toward the star. Since the system is seen almost edge-on, the observational effect is to shield the central star, which is therefore seen at a low level of brightness. The initial conditions are supposed to be restored by means of a burst in the accretion rate, which provokes the deflation of the disk’s internal rim and the clearing of the central star and which, therefore, appears at its maximum level of brightness.
In the Grinin scenario, V1184 Tau is therefore an accretion-driven variable whose light curve closely resembles that of a UXor star. However, the subsequent literature does not report any increase of luminosity, a circumstance that leads Herbig (2008) to rule out the EXor hypothesis. He presents high-resolution optical spectroscopy when the source level was down to R ~ 17.4 mag.
To better clarify the nature of V1184 Tau, and in particular to test the Grinin’s model, we have collected optical/near-infrared data in the period 2008−2015, when the star has returned to the brightness level it had before 2004 (R ~ 14 mag). These data are presented in Sect. 2, then analyzed and discussed, together with previous literature data in Sect. 3. Our concluding remarks are given in Sect. 4.
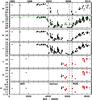 |
Fig. 1 V1184 Tau optical and near-infrared light curves vs. Modified Julian Date (MJD). Red points are new infrared observations, while black points are literature data. Vertical black lines indicate the periods when mid-infrared data have been recorded. The corresponding telescope is also labeled. In the second panel we show, as an example, the fit through the V light curve. The maximum and minimum values of the fit are assumed to be V magnitude of the low- and high-state of the source, and used to construct the corresponding SED (see Sect. 3.2). |
2. Observations
New photometric and spectroscopic data of V1184 Tau were obtained in the framework of our monitoring program of EXor dubbed EXORCISM (EXOR OptiCal and InfraRed Systematic Monitoring − Antoniucci et al. 2013, 2014; Lorenzetti et al. 2009).
2.1. Photometry
2.1.1. Near-infrared photometry
Photometric images in the JHK broad-band filters were obtained during the period 2008−2015 with the SWIRCAM camera (D’Alessio et al. 2000) at the 1.1 m AZT-24 telescope at the Campo Imperatore observatory (L’Aquila, Italy). An additional photometric point was also obtained with the NICS camera mounted on the Telescopio Nazionale Galileo (TNG) on August 23 2015. All the observations were obtained by dithering the telescope around the pointed position. The raw imaging data were reduced by using standard procedures for bad pixel removal, flat fielding, and sky subtraction. Photometric data are listed in Table 1 while the derived light curves are depicted in the three bottom panels of Fig. 1 for the J, H, and K-band, respectively (red points).
2.1.2. Literature photometry
Near-infrared JHK photometry prior to 2008 was obtained in 1993 by Yun et al. (1997), in 1997 (published in the 2MASS catalog), and between 2004 and 2008 by Grinin et al. (2009). These data are relevant for the present discussion since they clearly indicate that V1184 Tau is now in the same high state as it was before the deep fading that occurred between 2004 and 2009. These data in the literature are depicted in Fig. 1 as black points.
Optical photometry in BVRI that was obtained between 2002 and 2007 have been reported by Yun et al. (1997), Semkov (2003, 2004a,b, 2006), Semkov et al. (2008), and by Grinin et al. (2009). Photometry in the period 2008−2015 (mainly in V and I-bands) is available from the American Association of Variable Star Observers (AAVSO) webpage1 and recently published by Semkov et al. (2015). Further photometric points were obtained by us together with the optical spectra (see Sect. 2.2). The optical light curves are plotted in Fig. 1, from top to fourth panel.
Photometry at longer wavelengths was retrieved from the literature and from public databases. These data are reported in Table 2 and cover the mid-infrared domain from 3.4 μm up to 24 μm (MSX, Spitzer and WISE data).
Mid-infrared photometry.
2.2. Spectroscopy
Optical spectra were taken on December 12 2014 (MJD 57 003) and August 19 2015 (MJD 57 253). In addition, a NIR spectrum was obtained on August 23 2015 (MJD 57 257). The first optical spectrum (3200 Å−10 000 Å) was obtained with the 8.4 m Large Binocular Telescope (LBT) using the Multi-Object Double Spectrograph (MODS − Pogge et al. 2010). The dual grating mode (Blue + Red channels) was used for a total integration time of 20 min to cover the spectral range with a 0.6′′ slit (ℜ ~ 2000). The second optical spectrum was obtained with the 3.6 m TNG with the Device Optimized for the LOw RESolution (DOLORES) spectrograph. We adopted the low resolution (ℜ ~ 700) red (LR-R) grism integrating 30 min to cover the 0.50−0.95 μm spectral range. The images were bias and flat-field corrected using standard procedures. After removing sky background, the two-dimensional spectra were extracted and collapsed into one dimension. Wavelength calibration was achieved through lamp exposures, while flux calibration was obtained from observations of spectro-photometric standard stars. The MODS spectrum of V1184 Tau is depicted (in different colors for each channel) in Fig. 2. The spectrum shows a number of photospheric absorption lines along with some fine structure atomic lines in emission. In addition, we detect the Hα line and the Ca iiλλ 8498, 8542, 8862 in absorption. Fluxes and equivalent widths (EW) of the main features are listed in Table 3.
The integrated flux was therefore obtained through a Gaussian fit to the (unresolved) line profile, while the associated uncertainty was derived by multiplying the rms noise of the spectrum close to the line multiplied by the instrumental FWHM. A rough calibration in velocity was done by shifting the spectrum in wavelength so that the observed wavelength of bright photospheric lines (Li i 6707 Å and K i 7699 Å) coincides with the theoretical air-wavelength value. We estimate the velocity uncertainty to be ~50 km s-1.
The DOLORES spectrum presents only three emission lines (Hα, [O i]6300 Å, and [S ii]6730 Å), which do not appear to be significantly different from those obtained with MODS (see Table 3).
The near-infrared spectrum (ℜ ~ 500, slit width = 1″) was obtained with the Near Infrared Camera Spectrometer (NICS) at TNG with two grisms IJ (0.90−1.4 μm) and HK (1.40−2.50 μm), each integrated for 25 min. For technical problems, we could not observe a telluric standard star, which is fundamental to removing the atmospheric response. Therefore we could only examine the spectrum at the wavelengths where no atmospheric lines are present, and we do not detect any line that is intrinsic to V1184 Tau.
Relevant lines detected on V1184 Tau with LBT/MODS.
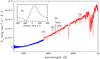 |
Fig. 2 LBT/MODS spectrum of V1184 Tau. Blue and red channels spectra are depicted with the corresponding color. Main features are labelled. In the insert we show the Hα spectral profile. |
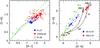 |
Fig. 3 Left panel: Optical V − R vs. R − I two-color diagram of V1184 Tau in different epochs. The solid green line represents the main sequence, while green dashed and dotted lines are the reddening vectors by Rieke & Lebofsky (1985) and Cardelli et al. (1989), respectively. Different AV are indicated with open squares and labeled. The extinction vector is applied to the colors of a G5-type star. Blue dots show, the states in which V< 17 mag, red filled dots those with 17 ≤ V ≤ 18 mag, and red open dots those with V> 18 mag, respectively. Right panel: as in the left panel for the near-infrared J − H vs. H − K two-color diagram. Blue dots are the points with H< 11.5 mag and red dots those with H ≥ 11.5 mag. The yellow square indicates the colors of the photospheric temperature (5700 K), while black solid curves are the combinations of two blackbodies, one at 5700 K and the second with temperatures between 1000 K and 2000 K. The ratio of the two emitting areas is labeled, and the iso-surface curves are depicted with black-dashed lines. |
3. Analysis and discussion
3.1. Two-color plots
Optical (VRI-bands) and NIR (JHK-bands) diagrams of V1184 Tau are depicted in the two panels of Fig. 3. Together with the photometric data, we plot the locus of the main-sequence and two extinction vectors (Rieke & Lebofsky 1985; Cardelli et al. 1989), which were applied at the location of the colors of a G5-type star.
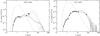 |
Fig. 4 Left panel: fit “à la Robitaille”, through the spectral energy distribution (SED) of V1184 Tau in the high-state. The filled circles show the input fluxes, while triangles are 3σ upper limits. The black line shows the best fit, and the gray lines show four subsequent good fits. The dashed line shows the stellar photosphere corresponding to the central source of the best-fitting model (considering the interstellar extinction). Right panel: as in the left panel for the low state. |
Both plots indicate that the source is bluer when brighter, a typical behavior of all the accretion- and extinction-driven fluctuations (Lorenzetti et al. 2012).
To go into more detail: the optical two-color plot shows that data with V ≤ 17 mag (blue dots) and with 17 mag ≤ V ≤ 18 mag (red filled dots) tend to align along the extinction vector of Cardelli et al. (1989), and cluster at AV ~ 3 mag and AV ~ 5 mag, respectively. Conversely, data points corresponding to V> 18 mag (open red dots) do not follow any of the extinction vectors. This effect, already noted in the V vs. V − I and V vs. V − R color−magnitude diagrams by Barsunova et al. (2006) and Semkov et al. (2008), is likely due to the scattering of the stellar light by small dust particles, which tends to prevail against the direct light from the star when this latter becomes fainter. This effect makes the optical color−color plot effectively unable to probe a further extinction variation, as testified by the fact that the plot indicates ΔAV ~ 2 mag, while the V light curve gives a fading of more than 5 mag (Fig. 1).
In the right panel we show the near-infrared J − H vs. H − K two-color diagram. Two main conclusions can be drawn: 1) the data points do not align with either of two depicted extinction curves but rather exhibit a clear shift to the right that increases with the decrease in the source brightness; 2) if only due to extinction, their spread should imply a ΔAV larger than 15 mag, incompatible with the value derived in the optical light curve. Instead, the points indicate the presence of a strong IR excess that we quantify by plotting the locus of the combination of two thermal components, one at the stellar photospheric temperature of 5700 K (that of a G5 star) and the second ranging between 1000 and 2000 K, and for different ratios between the emitting areas. In the high state, the infrared emission is largely dominated by the stellar emission, while in the faint state is it accounted for by a thermal source between 1000 K and 1200 K with an effective emitting area ≳104 larger than the stellar surface.
3.2. Spectral energy distribution
To construct the low- and high-state spectral energy distributions (SEDs), we have first examined the optical and near-infrared light curves of Fig. 1. Here it is clear that a short-time variability, whose amplitude can exceed 0.6−0.8 mag, superposes to the long-term variability in which we are interested. To integrate this short-time variability, we fitted all the data in a light-curve with a distorted Gaussian, whose maximum and minimum values are taken as the magnitude values typical of the low- and high-state. As example, we show in Fig. 1 the fit through the V light curve. We applied this procedure to all the optical and near-infrared data. In the mid-infrared, given the poor number of observations, we simply attributed the measured fluxes to the high- or low-state, depending on the observation date. In particular, as evidenced in Fig. 1, both Spitzer and WISE observations have been performed during a relatively low-state period (we averaged the data taken at similar wavelengths i.e. 3.4/3.6 μm, 4.4/4.5 μm, and 22/24 μm), while the contrary happens for MSX observations for which, however, only that at 8.3 μm is a detection above the 3σ limit. As a consequence, the high-state SED remains poorly defined.
The high- and low-state SEDs are shown in Fig. 4. We used the on-line SED fitter by Robitaille et al. (2007), which uses a Monte-Carlo radiation transfer code to compute model SEDs for different sets of physical parameters and viewing angles. The free parameters are the distance and the visual extinction to the source. As a first attempt, we fitted the data assuming a distance of between 0.5−2 kpc and AV between 0−10 mag. For consistency, we request that the fits of the two states do give similar outputs for a number of parameters, such as viewing angle, stellar temperature, mass, and radius. However, we do not find this consistency within the first five fits (ordered by increasing χ2). Moreover, the predicted parameters are in clear contrast with those known for V1184 Tau. As an example, the fitted stellar temperature is between 8000 and 22 000 K, the mass higher than 5 M⊙, and the bolometric luminosity larger than 200 L⊙.
Output of the SED fitting.
More consistent results are found if the distance to the source is reduced. If this latter is fixed in the range 100−300 pc, we find output parameters in a much better agreement with expectations. The first five model SEDs (those with  ) are shown in Fig. 4. The main output parameters are listed in Table 4, where we report the best-fit value (in boldface) together with the range predicted by subsequent models. The two low- and high-state fits both predict stellar parameters (temperature, age, bolometric luminosity, mass, and radius) in optimal agreement with literature estimates and a viewing angle consistent with an object seen approximately edge-on. The mass accretion rate is not well determined, but is roughly consistent with predictions of normal T Tauri stars of similar mass (Alcalá et al. 2014).
The above scenario implies the distance to V1184 Tau to be much lower than 1.5 kpc, as commonly accepted and the base of the distance of the Gemini OB1 cloud (Haug 1970), from which the CB34 globule is supposed to be generated. This estimate was put into doubt by Khanzadyan et al. (2002), who note that the time needed to cover the distance (2° at 1.5 kpc) between CB34 and the Gemini OB1 cloud is comparable to the average age for globule dispersal (~5 × 10⁶ yr, Launhardt & Henning 1997). Therefore, a direct estimate of the distance to CB34 is necessary to resolve the question.
3.3. Comments on the optical spectrum
While the photometric behavior of V1184 Tau has been monitored for long time, little is known about the (possible) spectroscopic variability. The first low-resolution spectra report the detection of Hα and [O i]6300 Å (Alves et al. 1997; Semkov 2003, 2004a, 2006). Later, a high-resolution spectrum was obtained by Herbig in 2005, i.e., when the star was at the lowest brightness level, showing a number of forbidden lines of O i , N i , S ii , and Fe ii, together with Hα, Hβ, and Ca ii lines (Herbig 2008).
The comparison of our MODS-LBT spectrum with the previous ones leads to the following conclusions :
-
1
The EW of Hα (~3 Å) is similar to that reported by Semkov (2006), which refers to observations taken on 2001 March, when the star was at a similar level of brightness (R = 14.08) as in 2014 (R ~ 14.3). Conversely, in 2005 EW(Hα) was ~90 Å and R = 17.38 (Herbig 2008). The simultaneous variation in EW and continuum level implies that the Hα flux remains substantially unchanged. Admittedly, expected UXor behavior envisages a simultaneous decrease of the continuum and the Hα flux, since the circumstellar dust cloud screens both of them (e.g., Kolotilov 1977; Holtzman et al. 1986; Grinin et al. 1994). Conversely, an increase of the EW(Hα) with a fading of the stellar continuum can be explained by: 1) an increase of the line luminosity; 2) a shielding of the star by a puffed-up inner disk rim that obscures just the stellar continuum, but leaves unaffected the hydrogen emission region (see the model by Dullemond et al. 2003), as observed in several UXor (Rodgers et al. 2002). This latter hypothesis seems more acceptable than 1), because in that case, to leave the Hα emission constant, the flux enhancement should fortuitously compensate for the effect of the screening of the hydrogen emitting zone.
-
2
In the 2008 spectrum, the Hα profile peaks at about +60 km s-1, with a shoulder (in emission) between − 100 and − 300 km s-1 (Fig. 7 of Herbig 2008). In our spectrum (insert in Fig. 2), this high-velocity component is seen as a faint absorption that peaks at velocity ~− 150 km s-1. In the assumption of a disk-wind origin of this kind of component, we can hypothesize that, if the star is shielded by a puffed-up disk rim, the bulk of the high-velocity component of the Hα arises from the disk itself and, therefore, it is seen in emission. Conversely, when the line of sight is free from dust, the (warmer) wind that arises from the star is absorbed by the surrounding gas and, therefore, the line is seen in absorption. We note that, in agreement with the discussion above, the hypothesis of a passive dusty cloud in orbit around the star is not favored with respect to the the formation of a dusty, puffed-up inner disk rim, from which the wind should be generated.
-
3
A rough estimate of the mass accretion rate in the high state can be derived from the Hα flux, although this line is not the best tracer for accretion (Antoniucci et al. 2011). Adopting the relationship given in Alcalá et al. (2014), and taking the range of parameters, obtained by fitting the SED, i.e. D = 100−200 pc, M⋆ ≈ 2−4 M⊙, R⋆ ≈ 2−7 R⊙ and AV ≈ 2−3 mag (considering for this parameter the range fitted for the high-state SED) we get Ṁacc ~ 10-11−5 × 10⁻¹⁰M⊙/yr, i.e. consistent with the lower end of the range that was fitted with the Robitaille et al. model. More importantly, since the Hα flux does not significantly change with the source continuum, it is likely that the mass accretion rate maintains a low value, even when the star is in its low-state phase.
-
4
In our spectrum, we detect bright Ca ii lines in absorption, while the same lines were seen in emission in the Herbig (2008) spectrum. At that time the velocity peak was ≈− 120 km s-1 and EW ~ 35 Å, while we measure a peak velocity of a few km s-1 and EW< 2 Å. As in the case of Hα, a possible explanation is that the formation of a puffed-up rim is associated with that of a disk-wind that emits Ca ii lines. Conversely, when the rim deflates, the disk wind also weakens and, therefore, the photospheric absorption component of the lines becomes visible.
-
5
The atomic forbidden line fluxes remain practically unchanged with respect to 2005. Their peak velocity is consistent with that measured by Herbig, and close to the cloud velocity. This suggests their origin in a nebular environment that should remain almost unperturbed by the phenomena that are responsible for both the stellar and permitted lines variation.
4. Conclusions
We have presented new photometric and spectroscopic data that has been collected on V1184 Tau. Together with the literature data, these have been used to depict the phenomenology presented by the source in the last 15 yr. The main observational achievements of the presented study are: (i) multi-band photometry demonstrates that V1184 Tau has recently (end 2014) reached the same level of brightness that it had before the remarkable fading of about 5 mag started in 2004; (ii) the first optical spectrum, which was obtained in the high flux state, shows both similarities and differences in comparison with that taken at minimum brightness (Herbig 2008).
This type of scenario can be substantially explained based on the concept originally proposed by Grinin et al. (2009), but now supported by many more observational evidences. In particular, we can definitively discard the EXor nature of V1184 Tau on the base of: 1) the shape of the light curve(s), which does/do not present any sudden increase, but rather a smoother behavior; 2) the appearance of a strong IR excess that corresponds with the source fading, attributable to an emitting source with a dimension and temperature that is compatible with the disk characteristics; 3) the roughly constant flux of Hα and the estimated mass accretion rate, more typical of slow accretors than outbursting variables. Consequently, all this evidence strongly favors V1184 Tau being an UXor-type star. More specifically, the variation in both Hα and Ca ii line profiles suggests a periodically broadening of the inner disk, which both enlarges enough to intercept the line of sight (taking into consideration that the source is seen approximately edge-on) and originates fast wind-emitting permitted lines. What still remains unclear is whether or not the inner disk rim’s deflation is associated with accretion events (as envisaged by Grinin), given the negative clue that is offered by the roughly constant value of the Hα flux and, therefore, of the mass accretion rate.
Although not directly connected with the above scenario is the result we got from the fit of the source SED, performed in the low- and high-state phases: the stellar parameters, independently determined in the literature, are correctly fitted only if the object is located at a distance that does not significantly exceed 200 pc, in contrast with the commonly accepted value of 1.5 kpc.
Acknowledgments
This work is based on observations made with different instruments: [1] the Large Binocular Telescope (LBT). The LBT is an international collaboration among institutions in the United States, Italy, and Germany. LBT Corporation partners are: The University of Arizona on behalf of the Arizona university system; Istituto Nazionale di Astrofisica, Italy; LBT Beteiligungsgesellschaft, Germany, representing the Max-Planck Society, the Astrophysical Institute Potsdam, and Heidelberg University; The Ohio State University and The Research Corporation, on behalf of The University of Notre Dame, University of Minnesota and University of Virginia; [2] the Italian Telescope Galileo (TNG), operated on the island of La Palma by the Fundación Galileo Galilei of the INAF (Istituto Nazionale di Astrofisica) at the Spanish Observatorio del Roque de los Muchachos of the Istituto de Astrofisica de Canarias; [3] the AZT-24 IR Telescope at Campo Imperatore (L’Aquila, Italy), operated under the responsibility of the INAF-Osservatorio Astronomico di Roma (OAR) according to the agreement between Pulkovo, Rome, and Teramo observatories. We thank the American Association for Variable Star Observers (AAVSO) for their optical monitoring of V1184 Tau. V.L. acknowledges support from St. Petersburg University research grant 6.38.335.2015.
References
- Alcalá, J. M., Natta, A., Manara, C. F., et al. 2014, A&A, 561, A2 [NASA ADS] [CrossRef] [EDP Sciences] [Google Scholar]
- Alves, J., Hartmann, L., Briceno, C., & Lada, C. J. 1997, AJ, 113, 1395 [NASA ADS] [CrossRef] [Google Scholar]
- Antoniucci, S., García López, R., Nisini, B., et al. 2011, A&A, 534, A32 [NASA ADS] [CrossRef] [EDP Sciences] [Google Scholar]
- Antoniucci, S., Arkharov, A. A., Di Paola, A., et al. 2013, Protostars and Planets VI Posters, 55 [Google Scholar]
- Antoniucci, S., Arkharov, A. A., Di Paola, A., et al. 2014, A&A, 565, L7 [NASA ADS] [CrossRef] [EDP Sciences] [Google Scholar]
- Audard, M., Ábrahám, P., Dunham, M. M., et al. 2014, Protostars and Planets VI, 387 [Google Scholar]
- Barsunova, O. Y., Grinin, V. P., & Sergeev, S. G. 2006, Astron. Lett., 32, 832 [Google Scholar]
- Cardelli, J. A., Clayton, G. C., & Mathis, J. S. 1989, ApJ, 345, 245 [NASA ADS] [CrossRef] [Google Scholar]
- Clemens, D. P., & Barvainis, R. 1988, ApJS, 68, 257 [NASA ADS] [CrossRef] [Google Scholar]
- D’Alessio, F., Di Cianno, A., Di Paola, A., et al. 2000, Proc. SPIE, 4008, 748 [NASA ADS] [CrossRef] [Google Scholar]
- Dullemond, C. P., van den Ancker, M. E., Acke, B., & van Boekel, R. 2003, ApJ, 594, L47 [NASA ADS] [CrossRef] [Google Scholar]
- Grinin, V. P., Arkharov, A. A., Barsunova, O. Y., Sergeev, S. G., & Tambovtseva, L. V. 2009, Astron. Lett., 35, 114 [NASA ADS] [CrossRef] [Google Scholar]
- Grinin, V. P., The, P. S., de Winter, D., et al. 1994, A&A, 292, 165 [NASA ADS] [Google Scholar]
- Gutermuth, R. A., Megeath, S. T., Myers, P. C., et al. 2009, ApJS, 184, 18 [NASA ADS] [CrossRef] [Google Scholar]
- Hartmann, L., & Kenyon, S. J. 1985, ApJ, 299, 462 [NASA ADS] [CrossRef] [Google Scholar]
- Haug, U. 1970, A&AS, 1, 35 [NASA ADS] [Google Scholar]
- Herbig, G. H. 1989, European Southern Observatory Conference and Workshop Proc., 33, 233 [Google Scholar]
- Herbig, G. H. 2008, AJ, 135, 637 [NASA ADS] [CrossRef] [Google Scholar]
- Herbst, W., Herbst, D. K., Grossman, E. J., & Weinstein, D. 1994, AJ, 108, 1906 [NASA ADS] [CrossRef] [Google Scholar]
- Holtzman, J. A., Herbst, W., & Booth, J. 1986, AJ, 92, 1387 [NASA ADS] [CrossRef] [Google Scholar]
- Huard, T. L., Weintraub, D. A., & Sandell, G. 2000, A&A, 362, 635 [NASA ADS] [Google Scholar]
- Khanzadyan, T., Smith, M. D., Gredel, R., Stanke, T., & Davis, C. J. 2002, A&A, 383, 502 [NASA ADS] [CrossRef] [EDP Sciences] [Google Scholar]
- Kolotilov, E. A., Zaitseva, G. V., & Shenavrin, V. I. 1977, Astrophysics, 13, 253 [NASA ADS] [CrossRef] [Google Scholar]
- Launhardt, R., & Henning, T. 1997, A&A, 326, 329 [NASA ADS] [Google Scholar]
- Lorenzetti, D., Larionov, V. M., Giannini, T., et al. 2009, ApJ, 693, 1056 [NASA ADS] [CrossRef] [Google Scholar]
- Lorenzetti, D., Antoniucci, S., Giannini, T., et al. 2012, ApJ, 749, 188 [NASA ADS] [CrossRef] [Google Scholar]
- Moreira, M. C., & Yun, J. L. 1995, ApJ, 454, 850 [NASA ADS] [CrossRef] [Google Scholar]
- Pogge, R. W., Atwood, B., Brewer, D. F., et al. 2010, Proc. SPIE, 7735, 77350A [CrossRef] [Google Scholar]
- Rieke, G. H., & Lebofsky, M. J. 1985, ApJ, 288, 618 [NASA ADS] [CrossRef] [Google Scholar]
- Robitaille, T. P., Whitney, B. A., Indebetouw, R., & Wood, K. 2007, ApJS, 169, 328 [NASA ADS] [CrossRef] [Google Scholar]
- Rodgers, B., Wooden, D. H., Grinin, V., Shakhovsky, D., & Natta, A. 2002, ApJ, 564, 405 [NASA ADS] [CrossRef] [Google Scholar]
- Semkov, E. H. 2003, A&A, 404, 655 [NASA ADS] [CrossRef] [EDP Sciences] [Google Scholar]
- Semkov, E. H. 2004a, Balt. Astron., 13, 538 [NASA ADS] [Google Scholar]
- Semkov, E. H. 2004b, A&A, 419, L59 [NASA ADS] [CrossRef] [EDP Sciences] [Google Scholar]
- Semkov, E. H. 2006, Astron. Nachr., 327, 328 [Google Scholar]
- Semkov, E. H., & Peneva, S. P. 2012, Ap&SS, 338, 95 [NASA ADS] [CrossRef] [Google Scholar]
- Semkov, E. H., Tsvetkov, M. K., Borisova, A. P., et al. 2008, A&A, 483, 537 [NASA ADS] [CrossRef] [EDP Sciences] [Google Scholar]
- Semkov, E. H., Peneva, S. P., & Ibryamov, S. I. 2015, A&A, 582, A113 [NASA ADS] [CrossRef] [EDP Sciences] [Google Scholar]
- Tackett, S., Herbst, W., & Williams, E. 2003, AJ, 126, 348 [NASA ADS] [CrossRef] [Google Scholar]
- Yun, J. L., Moreira, M. C., Alves, J. F., & Storm, J. 1997, A&A, 320, 167 [NASA ADS] [Google Scholar]
All Tables
All Figures
|
Fig. 1 V1184 Tau optical and near-infrared light curves vs. Modified Julian Date (MJD). Red points are new infrared observations, while black points are literature data. Vertical black lines indicate the periods when mid-infrared data have been recorded. The corresponding telescope is also labeled. In the second panel we show, as an example, the fit through the V light curve. The maximum and minimum values of the fit are assumed to be V magnitude of the low- and high-state of the source, and used to construct the corresponding SED (see Sect. 3.2). |
| In the text | |
|
Fig. 2 LBT/MODS spectrum of V1184 Tau. Blue and red channels spectra are depicted with the corresponding color. Main features are labelled. In the insert we show the Hα spectral profile. |
| In the text | |
|
Fig. 3 Left panel: Optical V − R vs. R − I two-color diagram of V1184 Tau in different epochs. The solid green line represents the main sequence, while green dashed and dotted lines are the reddening vectors by Rieke & Lebofsky (1985) and Cardelli et al. (1989), respectively. Different AV are indicated with open squares and labeled. The extinction vector is applied to the colors of a G5-type star. Blue dots show, the states in which V< 17 mag, red filled dots those with 17 ≤ V ≤ 18 mag, and red open dots those with V> 18 mag, respectively. Right panel: as in the left panel for the near-infrared J − H vs. H − K two-color diagram. Blue dots are the points with H< 11.5 mag and red dots those with H ≥ 11.5 mag. The yellow square indicates the colors of the photospheric temperature (5700 K), while black solid curves are the combinations of two blackbodies, one at 5700 K and the second with temperatures between 1000 K and 2000 K. The ratio of the two emitting areas is labeled, and the iso-surface curves are depicted with black-dashed lines. |
| In the text | |
|
Fig. 4 Left panel: fit “à la Robitaille”, through the spectral energy distribution (SED) of V1184 Tau in the high-state. The filled circles show the input fluxes, while triangles are 3σ upper limits. The black line shows the best fit, and the gray lines show four subsequent good fits. The dashed line shows the stellar photosphere corresponding to the central source of the best-fitting model (considering the interstellar extinction). Right panel: as in the left panel for the low state. |
| In the text | |
Current usage metrics show cumulative count of Article Views (full-text article views including HTML views, PDF and ePub downloads, according to the available data) and Abstracts Views on Vision4Press platform.
Data correspond to usage on the plateform after 2015. The current usage metrics is available 48-96 hours after online publication and is updated daily on week days.
Initial download of the metrics may take a while.