Fig. 3
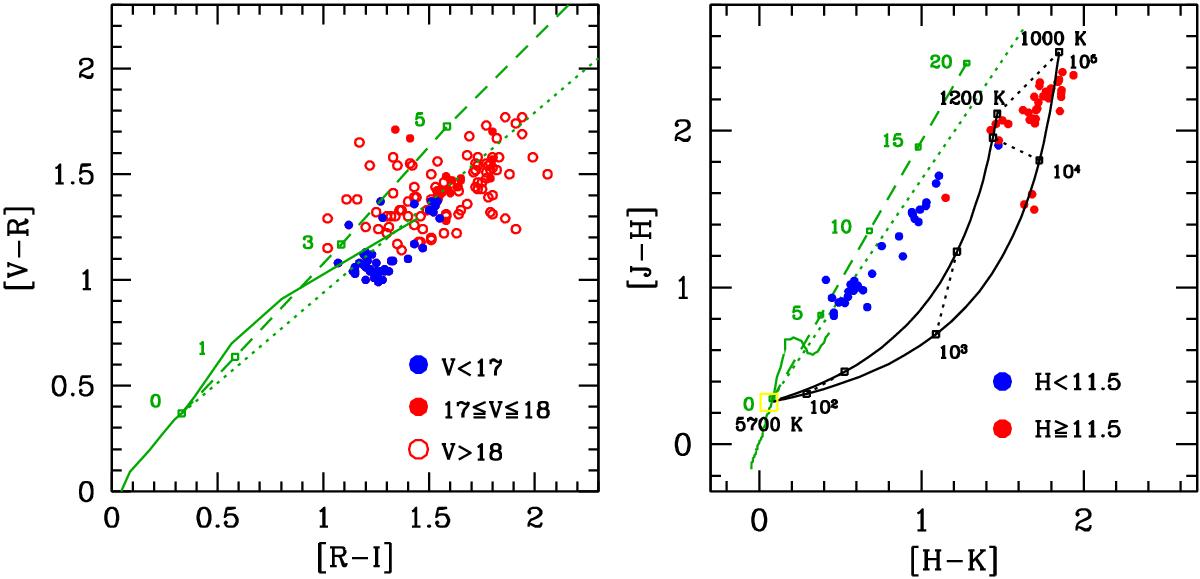
Left panel: Optical V − R vs. R − I two-color diagram of V1184 Tau in different epochs. The solid green line represents the main sequence, while green dashed and dotted lines are the reddening vectors by Rieke & Lebofsky (1985) and Cardelli et al. (1989), respectively. Different AV are indicated with open squares and labeled. The extinction vector is applied to the colors of a G5-type star. Blue dots show, the states in which V< 17 mag, red filled dots those with 17 ≤ V ≤ 18 mag, and red open dots those with V> 18 mag, respectively. Right panel: as in the left panel for the near-infrared J − H vs. H − K two-color diagram. Blue dots are the points with H< 11.5 mag and red dots those with H ≥ 11.5 mag. The yellow square indicates the colors of the photospheric temperature (5700 K), while black solid curves are the combinations of two blackbodies, one at 5700 K and the second with temperatures between 1000 K and 2000 K. The ratio of the two emitting areas is labeled, and the iso-surface curves are depicted with black-dashed lines.
Current usage metrics show cumulative count of Article Views (full-text article views including HTML views, PDF and ePub downloads, according to the available data) and Abstracts Views on Vision4Press platform.
Data correspond to usage on the plateform after 2015. The current usage metrics is available 48-96 hours after online publication and is updated daily on week days.
Initial download of the metrics may take a while.