Fig. 4
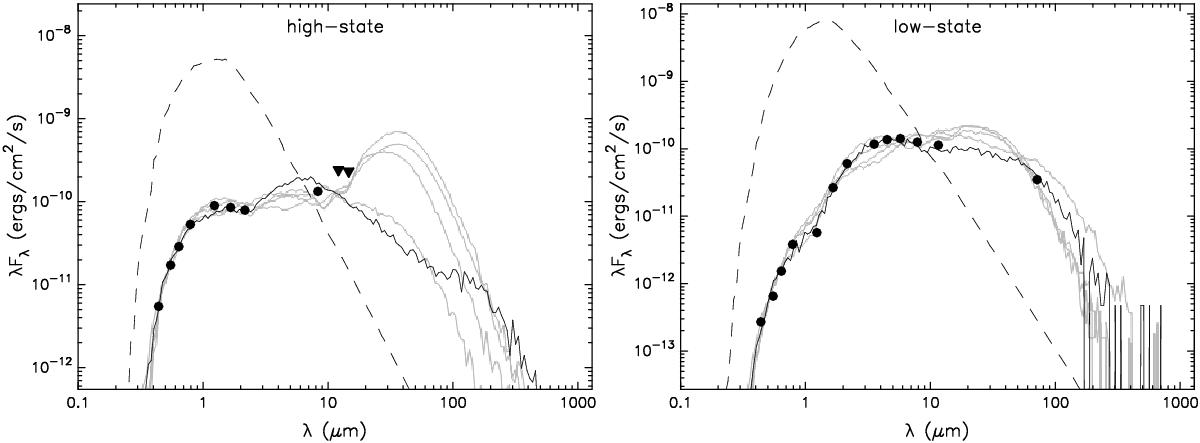
Left panel: fit “à la Robitaille”, through the spectral energy distribution (SED) of V1184 Tau in the high-state. The filled circles show the input fluxes, while triangles are 3σ upper limits. The black line shows the best fit, and the gray lines show four subsequent good fits. The dashed line shows the stellar photosphere corresponding to the central source of the best-fitting model (considering the interstellar extinction). Right panel: as in the left panel for the low state.
Current usage metrics show cumulative count of Article Views (full-text article views including HTML views, PDF and ePub downloads, according to the available data) and Abstracts Views on Vision4Press platform.
Data correspond to usage on the plateform after 2015. The current usage metrics is available 48-96 hours after online publication and is updated daily on week days.
Initial download of the metrics may take a while.