Fig. 1
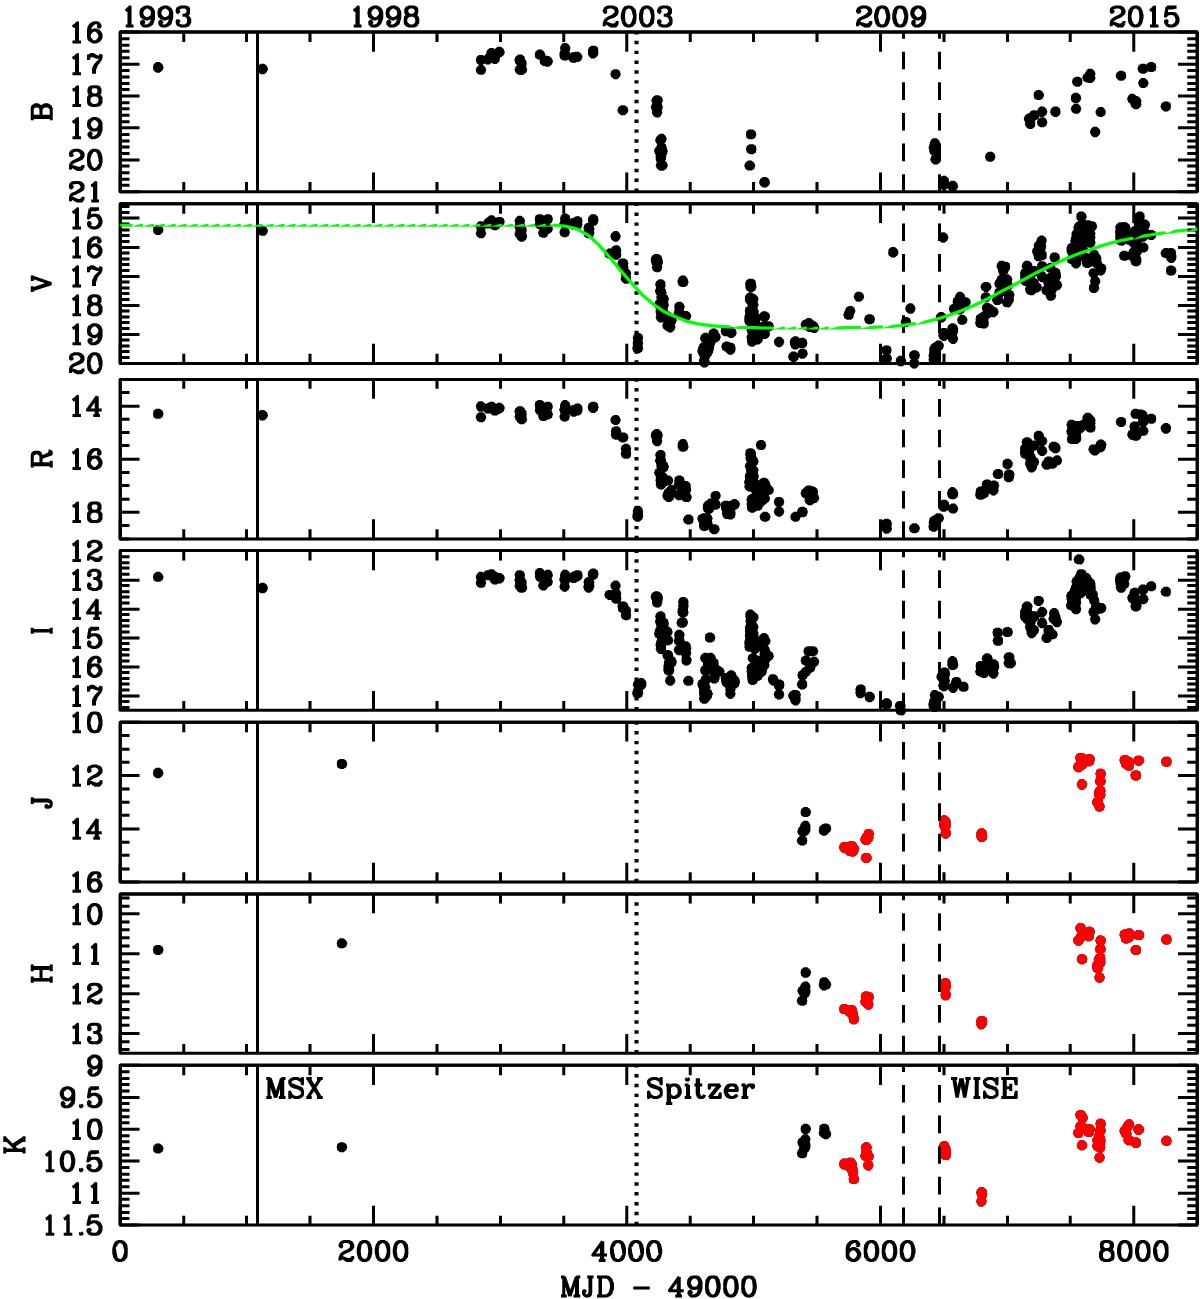
V1184 Tau optical and near-infrared light curves vs. Modified Julian Date (MJD). Red points are new infrared observations, while black points are literature data. Vertical black lines indicate the periods when mid-infrared data have been recorded. The corresponding telescope is also labeled. In the second panel we show, as an example, the fit through the V light curve. The maximum and minimum values of the fit are assumed to be V magnitude of the low- and high-state of the source, and used to construct the corresponding SED (see Sect. 3.2).
Current usage metrics show cumulative count of Article Views (full-text article views including HTML views, PDF and ePub downloads, according to the available data) and Abstracts Views on Vision4Press platform.
Data correspond to usage on the plateform after 2015. The current usage metrics is available 48-96 hours after online publication and is updated daily on week days.
Initial download of the metrics may take a while.