| Issue |
A&A
Volume 588, April 2016
|
|
|---|---|---|
| Article Number | A108 | |
| Number of page(s) | 15 | |
| Section | Interstellar and circumstellar matter | |
| DOI | https://doi.org/10.1051/0004-6361/201526791 | |
| Published online | 25 March 2016 | |
Observations and modelling of CO and [C i] in protoplanetary disks
First detections of [C i] and constraints on the carbon abundance⋆
1 Leiden Observatory, PO Box 9513, 2300 RA, Leiden, The Netherlands
e-mail: This email address is being protected from spambots. You need JavaScript enabled to view it.
2 Max Planck Institut für Extraterrestrische Physik, Giessenbachstrasse 1, 85748 Garching, Germany
3 SRON Netherlands Institute for Space Research, 3584, The Netherlands
4 Kapteyn Astronomical Institute, PO Box 800, 9700 AV Groningen, The Netherlands
5 NOVA, J.H. Oort Building, PO Box 9513, 2300 RA Leiden, The Netherlands
6 Max-Planck-Institut für Radioastronomie, Auf dem Hügel 69, 53121 Bonn, Germany
7 Kavli Institute of Nanoscience, Delft University of Technology, Lorentzweg 1, 2628 CJ Delft, The Netherlands
8 ASTRON, the Netherlands Institute for Radio Astronomy, Postbus 2, 7990 AA Dwingeloo, The Netherlands
9 Astronomical Observatory Institute, Faculty of Physics, A. Mickiewicz University, Sloneczna 36, 60-286 Poznan, Poland
10 UK Astronomy Technology Center, Royal Observatory Edinburgh, Blackford Hill, Edinburgh EH9 3HJ, UK
11 Harvard-Smithsonian Center for Astrophysics, 60 Garden Street, Cambridge, MA 02138, USA
12 Department of Physics and Astronomy, University of Toledo, 2801 West Bancroft Street, Toledo, OH 43606, USA
13 Jet Propulsion Laboratory, California Institute of Technology, 4800 Oak Grove Drive, Pasadena, CA 91109, USA
Received: 19 June 2015
Accepted: 5 January 2016
Abstract
Context. The gas-solid budget of carbon in protoplanetary disks is related to the composition of the cores and atmospheres of the planets forming in them. The principal gas-phase carbon carriers CO, C0, and C+ can now be observed regularly in disks.
Aims. The gas-phase carbon abundance in disks has thus far not been well characterized observationally. We obtain new constraints on the [C]/[H] ratio in a large sample of disks, and compile an overview of the strength of [C i] and warm CO emission.
Methods. We carried out a survey of the CO 6–5 line and the [C i] 1–0 and 2–1 lines towards 37 disks with the APEX telescope, and supplemented it with [C ii] data from the literature. The data are interpreted using a grid of models produced with the DALI disk code. We also investigate how well the gas-phase carbon abundance can be determined in light of parameter uncertainties.
Results. The CO 6–5 line is detected in 13 out of 33 sources, [C i] 1–0 in 6 out of 12, and [C i] 2–1 in 1 out of 33. With separate deep integrations, the first unambiguous detections of the [C i] 1–0 line in disks are obtained, in TW Hya and HD 100546.
Conclusions. Gas-phase carbon abundance reductions of a factor of 5–10 or more can be identified robustly based on CO and [C i] detections, assuming reasonable constraints on other parameters. The atomic carbon detection towards TW Hya confirms a factor of 100 reduction of [C]/[H]gas in that disk, while the data are consistent with an ISM-like carbon abundance for HD 100546. In addition, BP Tau, T Cha, HD 139614, HD 141569, and HD 100453 are either carbon-depleted or gas-poor disks. The low [C i] 2–1 detection rates in the survey mostly reflect insufficient sensitivity for T Tauri disks. The Herbig Ae/Be disks with CO and [C ii] upper limits below the models are debris-disk-like systems. An increase in sensitivity of roughly order of magnitude compared to our survey is required to obtain useful constraints on the gas-phase [C]/[H] ratio in most of the targeted systems.
Key words: surveys / protoplanetary disks / submillimeter: planetary systems
The reduced spectra (FITS files) are only available at the CDS via anonymous ftp to cdsarc.u-strasbg.fr (130.79.128.5) or via http://cdsarc.u-strasbg.fr/viz-bin/qcat?J/A+A/588/A108
© ESO, 2016
1. Introduction
Carbon is one of the most abundant elements in the Universe; it is central to interstellar and terrestrial chemistry and to planetary climate (Henning & Salama 1998; Unterborn et al. 2014). The carbon content of planets is determined by chemical and physical processes before and during the protoplanetary disk stage. To elucidate this stage-setting for planetary compositions, we present a survey of carbon reservoirs in 37 protoplanetary disk systems, including the first clear detections of submillimetre atomic carbon lines from disks.
The carbon budget in inter- and circumstellar material broadly consists of refractory material (e.g. graphite or amorphous carbon) and volatile material (atoms, simple and complex molecules, and ices). The elemental abundance of gas-phase carbon with respect to hydrogen, [C]/[H]gas, in the interstellar medium (ISM) is (1−2) × 10-4 (Cardelli et al. 1996; Parvathi et al. 2012), while the solar value is 2.69 × 10⁻⁴ (Asplund et al. 2009). This implies that volatile and refractory reservoirs in the ISM each contain about 50% of the total elemental carbon. A smaller fraction of interstellar carbon atoms, up to ≲ 5%, are bound in polycyclic aromatic hydrocarbon molecules (PAHs, Tielens 2008).
In the surface layers of protoplanetary disks, with increasing shielding from (inter)stellar ultraviolet photons C+, C0, and CO are the dominant gas-phase carbon carriers. Depending on the ionization state, chemical history, and gas temperature, CO2 and small hydrocarbons may carry large fractions of the volatile carbon (e.g. Bergin et al. 2014; Pontoppidan & Blevins 2014). At low dust temperatures (below ~25 K for CO), the molecular carriers form icy layers on dust where they can be further processed into complex organics. These may evaporate when brought into warmer conditions. Vertical and radial mixing may give rise to a flow of carbon from the warm, tenuous gas in the disk atmosphere into cold, icy reservoirs, which evolve and migrate into the inner disk where volatile and perhaps even refractory carbon is channeled into the gas phase (e.g. Lee et al. 2010; Pontoppidan et al. 2014). The co-evolution of the various reservoirs is reflected in the gas-phase elemental abundance of carbon in the outer disk atmosphere where volatiles likely cannot return once locked in large icy grains and transported to the inner disk.
Observational estimates of the carbon budget in disks are difficult. The gas phase is the most accessible, with CO being the dominant reservoir in molecular gas. However, the disk-averaged CO abundance can be much lower than the canonical value of CO/H2≈ 10-4 owing to the above-mentioned freezeout and due to photodissociation in the upper layers (e.g. van Zadelhoff et al. 2001; Dutrey et al. 2003; Chapillon et al. 2010). This, combined with optical depth effects, makes recovering the elemental [C]/[H]gas from CO alone tricky.
Neutral and ionized atomic carbon, C0 and C+ (denoted [C i] and [C ii] for line emission), consecutively become the main gaseous carbon reservoirs in the UV-irradiated surface layers of the disk. However, [C ii] cannot be observed from the ground and Herschel Space Observatory data contain emission from residual envelope material around disks (Fedele et al. 2013b,a; Dent et al. 2013). Neutral atomic carbon may also have a non-disk emission component, but this is easier to check as the observations are resolved in velocity and additional pointings can be taken. It is thus a promising tracer of the carbon abundance in disk atmospheres, but its disk contribution has not yet been unambiguously detected (Chapillon et al. 2010; Panić et al. 2010; Casassus et al. 2013; van der Wiel et al. 2014; Tsukagoshi et al. 2015).
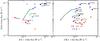 |
Fig. 1 Fluxes and upper limits (at 3σ confidence) from our APEX observations of the [C i] 1−0 and 2–1 and the CO 6−5 transitions. Large circles indicate sources with a detection on at least one axis. Empty symbols mark sources for which only the [C i] 1−0 line was observed. CO 6−5 and [C i] 2−1 were always observed in parallel. Colours show the stellar effective temperature: late-type stars are red and early-type stars blue. The black line connects fiducial disk models from Sect. 4 for the stellar spectral type range of our observations (diamonds from red to blue, Teff∈ [4000,12 000] K in steps of 2000 K, assumed distance 140 pc). |
Summary of the disks and line fluxes observed with APEX.
Through comprehensive modelling, the total gas-phase abundance of carbon was found to be depleted by a factor of 2 to 10 with respect to an adopted volatile carbon abundance of [C]/[H]gas= 2.4 × 10⁻⁴ in the HD 100546 disk (Bruderer et al. 2012). For the T Tauri disk system TW Hya, Favre et al. (2013) inferred a deficiency of up to two orders of magnitude in carbon abundance, based on C18O observations and a thus far unique bulk gas mass measurement via HD (Bergin et al. 2013). However, the C18O-to-H2 conversion may be affected somewhat by isotopologue-selective CO photodissociation (Miotello et al. 2014).
We observed [C i] towards a large number of disks using the Atacama Pathfinder EXperiment (APEX) telescope at Cerro Chajnantor. We also present deep follow-up observations that resulted in disk detections. In our analysis, we focus on the disk atmosphere, where physical-chemical models allow observations of [C i] and CO emission to be related to the total gas-phase elemental carbon abundance.
2. Observations
2.1. Sample selection
The disks targeted in our survey (Table 1) are some of the closest and best studied ones. The main selection criteria were observability with APEX, the availability of supplementary data, and proximity to the solar system. The spectral types range from late-B (HD 141569) to mid-M (Haro 6-5B, Sz 33).
Studies of disks with single-dish instruments are complicated because the large beam can capture extended emission from a surrounding cloud. The current sample includes a number of sources for which previous single-dish observations of CO and other species have demonstrated that most of the emission originates from the disk (e.g. Thi et al. 2004; van Kempen et al. 2007; Panić & Hogerheijde 2009; Kastner et al. 2008; Zuckerman et al. 1995). The observed sample includes protoplanetary disks with no known inner hole (e.g. HD 163296) as well as transitional disks with inner holes of up to several tens of au in radius (e.g. HD 100546, HD 169142). Since the disk emission component is dominated by the outer disk, which has similar characteristics in both types of sources, the presence or absence of such holes is of little importance for the purposes of this study. After the initial shallow survey, HD 97048, HD 100546 and TW Hya were chosen for deep follow-up integrations.
2.2. APEX observations
The shallow survey observations of 37 disks were carried out with the 2 × 7-pixel CHAMP+ (Kasemann et al. 2006) and the single-pixel FLASH (Heyminck et al. 2006) instruments on APEX (Güsten et al. 2006) during several runs from 2008 until 2013. The CHAMP+ observations targeted the [C i] 2−1 line at 809 GHz with the high-frequency array, with the 12CO 6−5 line observed simultaneously in the low frequency array. The FLASH observations targeted [C i] 1−0. Deep FLASH follow up integrations on the [C i] 1−0 line towards HD 100546, HD 97048 and TW Hya were carried out in 2014. The backends used were AFFTS (CHAMP+, with a highest resolution channel spacing of 0.18 MHz or 0.11 km s-1 at 492 GHz) and XFFTS (FLASH, 0.04 MHz or 0.02 km s-1). The targeted [C i] and CO lines are summarized in Table 3. Diffraction-limited beam sizes range from 8′′ to 13′′. Most CHAMP+ observations were taken in single pointing mode, with a typical wobbler switch of 2′ in azimuth. CHAMP+ has a central pixel, with the other six radially offset by 18′′ (14′′) at 660 GHz (850 GHz) in a hexagonal pattern. Raster mapping was used for AA Tau, BP Tau, DL Tau, GG Tau, RY Tau, HD 36112 and Haro 65 B. The additional sky coverage was used to check for extended emission.
Typical survey observations had from 10 to 400 scans with individual exposure times of 0.1 to 0.5 min and on-source exposure times of 10 to 60 min. The column of precipitable water vapour was typically 0.3 mm H2O, but as low as 0.1 and as high as 0.7 during some observations. Smoothed to dv = 0.17 km s-1, the median rms noise was 0.31 K for CO 6−5, 0.18 K for [C i] 1−0 and 0.67 K for [C i] 2−1. Initial processing was done using the APECS software (Muders et al. 2006). Baseline subtraction and other higher level reductions were done with GILDAS/CLASS1. Telescope parameters were obtained from Güsten et al. (2006). The intensities,  , are corrected for atmospheric and radiative loss and spillover; they can be converted to main beam temperature via Tmb= (Feff/ηmb) ×, where Feff = 0.95. Based on Güsten et al. (2006), the Kelvin-to-Jansky conversion and main beam efficiency at 650 GHz are 57 Jy K-1 and 0.53, respectively. At 812 GHz, they are 70 Jy K-1 and 0.43. At 491 GHz, the conversion factor is 49 Jy K-1 and ηmb = 0.59.
All sources and flux values from our survey are listed in Table 1 and shown in Fig. 1, including the detections of [C i] 1−0 towards TW Hya and HD 100546. The spectra are presented in Fig. 2, and an example of extended emission in Fig. 3.
2.3. Complementary data
To complement our [C i] 1−0 data for HD 142527, the CO 6−5 and [C i] 2−1 lines from Casassus et al. (2013) are included in Table 1. We also use observations of the [C ii] J = 3/2–1/2 transition at 158 μm towards a number of disks, obtained with the Herschel/PACS low-resolution spectrometer by the GASPS (Thi et al. 2010; Meeus et al. 2012; Dent et al. 2013; Howard et al. 2013) and DIGIT (Fedele et al. 2013b) key programmes.
3. Observational results
The APEX spectra of 37 disks are shown in Fig. 2 and the measurements are summarized in Table 1. Not all lines were observed towards all disks. Emission in the CO 6−5 line was detected (observed) towards 13 (33) sources; the corresponding numbers are 6 (12) for the [C i] 1−0 line and 1 (33) for the [C i] 2−1 line. When considering detections and upper limits, sources of all spectral types cover a similar range in line flux, although the CO and [C i] detections towards Herbig disks are typically a factor of a few stronger than towards T Tauri disks.
The CO 6−5 lines are single-peaked and narrow, except for three sources which show wide, double-peaked lines. The first is HD 100546, where the line displays the same blue-over-red peak asymmetry seen in lower-J CO observations (e.g. Panić et al. 2010, where the CO 6–5 line was also previously shown). The second is HD 97048, which has a filled-in line centre suggestive of a non-disk emission component. The third is IM Lup, a very large T Tauri disk (van Kempen et al. 2007; Panić et al. 2009). The CO 6−5 line has been observed towards a number of disks. The upper limit obtained by van Zadelhoff et al. (2001) towards TW Hya lies 30% above the detection reported in Table 1. A comparison of the six overlapping sources with Thi et al. (2001) shows good consistency, with APEX yielding improved upper limits and detections. In the case of GM Aur, our upper limit lies a factor of 1.5 below the detection from 2001, but is within its errorbars. The CO 6−5 flux detected towards HD 142527 by Casassus et al. (2013), 1.5 ± 0.9 K km s-1, is roughly in the middle of the range of values across our entire sample. The values reported for HD 100546 and HD 97048 in the much larger Herschel/SPIRE beam by van der Wiel et al. (2014) are also consistent with our detections.
In most sources where [C i] emission is detected, the emission is extended or contaminated by the reference position. The exceptions are HD 100546 and TW Hya. These two are the first two unambiguous detections of [C i] in protoplanetary disks, with a line flux of 0.49 K km s-1 (S/N = 10) towards HD 100546 and 0.05 K km s-1 (S/N = 3) towards TW Hya. Gaussian fit parameters for both detections are given in Table 2. We also detect a strongly asymmetric double-peaked line towards HD 97048. This detection likely has a disk contribution, but it is difficult to quantify because of contamination that affects the line centre. The [C i] 1−0 line is detected towards Oph IRS 48 (also known as WLY 2-48), but the line profile is asymmetric, with emission redshifted from the rest velocity of 4.6 km s-1 and absorption on the red side. The disk contribution, therefore, cannot be determined at the moment.
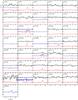 |
Fig. 2 All observed spectra, rebinned to a resolution of 0.5 km s-1. From bottom to top in each panel, the spectra are CO 6−5 (red), [C i] 1−0 (blue) and [C i] 2−1 (black). The measured fluxes and noise levels are listed in Table 1. Vertical offsets of 1 K have been applied for clarity. |
The [C i] transitions have recently been surveyed with Herschel/SPIRE by van der Wiel et al. (2014), who report no firm detections. Generally, the [C i] 1−0 limits from APEX have better sensitivity than SPIRE, while SPIRE provides deeper limits to the 2–1 line. However, SPIRE could not spectrally or spatially resolve disk emission. Its beam at 809 GHz was 26′′, compared to 8′′ for APEX. The tentative SPIRE detection of [C i] 2−1 for HD 100546 lies within errorbars of our upper limit, which is a re-evaluation of the data reported by Panić et al. (2010). For HD 100453, HD 169142, HD 36112 and HD 50138, the 2–1 limits are similar. We also detect [C i] 2−1 towards HD 97048, but above the upper limit of van der Wiel et al. (2014), suggesting that the emission is extended and was subtracted out in the SPIRE analysis where off-source spaxels were used as a reference pointing. This also makes our [C i] 1−0 detection towards that source suspect. For RY Tau, the SPIRE limit is a factor of five deeper than the APEX value. The proximity of TW Hya allowed our deep APEX integrations to yield a detection of the faint [C i] 1−0 transition and the lowest distance-corrected upper limit on the 2–1 line in our survey.
DM Tau shows purely on-source CO 6−5 emission and extended [C i] emission, as shown in Fig. 3. For CO, a broad line consistent with the disk inclination is detected on-source while the off-source position is clean. The on-source [C i] emission has two narrow components, one strong and narrow peak due to extended emission at (9.3 ± 0.1) km s-1, also seen in the reference spectrum, and the other at (6.3 ± 0.2) km s-1 probably originating in a compact envelope. The latter matches the CO detection, but is narrower. Our on-source detection of [C i] 1−0 is within the errorbars of the value from Tsukagoshi et al. (2015); however, the [C i] line from this inclined disk is single-peaked and narrower than the CO line, suggesting an envelope or wind contribution. The same narrow kinematic components are seen for this source in the low-J CO lines (Guilloteau & Dutrey 1994). In addition to having the 9 km s-1 component, the low-J CO isotopologue lines at 6 km s-1 are double-peaked and the 12CO 2–1 line shows an additional narrow emission peak at the systemic velocity. The CO 6−5 line appears to originate purely in the disk. Follow-up observations are needed to firmly establish the origin of the [C i] 1−0 emission towards DM Tau.
A single-peaked [C i] 1−0 line is also marginally detected towards AA Tau. No offset position was observed, but given that this disk is seen edge-on and accordingly has very broad emission lines (e.g. Brown et al. 2013), the narrow line is likely cloud emission.
The CO 6−5 line towards HD 144668 is uniform across all seven CHAMP+ pixels, with a flux increase towards northern positions, suggesting that the line originates entirely in an extended cloud. The T Tauri systems AS 205, Sz 33, and V806 Tau have very strong CO 6−5 emission, but display no emission in the off-source CHAMP+ pixels, ruling out extended emission. Their single-peaked on-source line profiles suggest a contribution from a remnant envelope or a disk wind (Pontoppidan et al. 2011; Salyk et al. 2014). AS 205 is a hierarchical T Tauri triple within 1.3′′ (Eisner et al. 2005). For AS 205A, single-peaked profiles are also seen in ro-vibrational CO lines (Bast et al. 2011; Brown et al. 2013).
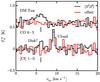 |
Fig. 3 [C i] 1−0 and CO 6−5 lines observed towards DM Tau (black) and typical offset positions (red; + 30′′,0′′ for [C i], + 18′′, + 6′′ for CO). The [C i] line towards the source is single-peaked and narrower than CO 6−5. The spectra are binned to 0.4 km s-1 per channel. |
Gaussian fit parameters for the definitive [C i] 1−0 detections.
Atomic and molecular lines used in this paper.
4. Modelling
Our next goals are to relate the observed [C i] and CO emission to the elemental [C]/[H]gas ratio in the warm atmosphere of a disk, where surface chemistry is unimportant, and to understand the low detection rates and upper limits in our survey. To this end, we make use of the DALI physical-chemical code (Bruderer et al. 2012; Bruderer 2013). Starting with a parameterized gas and dust density distribution (Sect. 4.1) and an input stellar spectrum (Sect. 4.2), DALI first solves the continuum radiative transfer to determine the UV radiation field and the dust temperature. This yields an initial guess for the gas temperature, which is the starting point of an iterative sequence in which the chemistry and thermal balance are calculated. Once the solution is converged, the code can output emission maps, spectra and integrated fluxes. We present below a grid of generic models, with parameter ranges covering the source sample. All observables are hereafter normalized to 140 pc. Tailored models for TW Hya and HD 100546 with detailed fitting of the carbon abundance will be presented in a companion paper (Kama et al. 2015).
4.1. Disk parameters
The disk density structure in our version of DALI is fully parameterized. The gas-to-dust mass ratio is Δgas/dust. The surface density has the standard form of a power law with an outer exponential taper: ![Mathematical equation: \begin{equation} \Sigma_{\rm gas} = \Sigma_{\rm c}\cdot \left( \frac{r}{R_{\rm c}} \right)^{-\gamma} \cdot \exp{\left[- \left(\frac{r}{R_{\rm c}}\right)^{2-\gamma} \right]}. \end{equation}](/articles/aa/full_html/2016/04/aa26791-15/aa26791-15-eq345.png) (1)To simulate an inner cavity, material can be removed inside of some radius rhole. The scaleheight angle h at distance r is given by h(r) = hc (r/Rc)ψ, such that the scaleheight is H = h·r and the vertical density structure of the small grains is
(1)To simulate an inner cavity, material can be removed inside of some radius rhole. The scaleheight angle h at distance r is given by h(r) = hc (r/Rc)ψ, such that the scaleheight is H = h·r and the vertical density structure of the small grains is ![Mathematical equation: \begin{equation} \label{eq:rhosmall} \rho_{\rm d,small} = \frac{(1-f)\,\Sigma_{\rm dust}}{\sqrt{2\,\pi}\,r\,h} \times \exp{ \left[-\frac{1}{2} \left( \frac{\pi/2 - \theta}{h} \right)^{2} \right] }, \end{equation}](/articles/aa/full_html/2016/04/aa26791-15/aa26791-15-eq351.png) (2)where f is the mass fraction of large grains and θ is the opening angle from the midplane as viewed from the central star. The settling of large grains is prescribed as a fraction χ ∈ (0,1] of the scaleheight of the small grains, so the mass density of large grains is similar to Eq. (2), with f replacing (1−f) and χh replacing h. The vertical distribution of gas is calculated in each grid cell as ρgas = Δg/d × ρd,small × [1 + f/ (1−f)]. The latter factor adds the mass of large grains as if they were not settled in order to preserve the global Δgas/dust. The ranges and fiducial values of all parameters in our model grid are given in Table 4. The range of Rc, ψ and γ are guided by results from homogeneous sample fitting studies (Andrews et al. 2009, 2010). The main fiducial disk model has a total mass of 10-2M⊙ and a reference surface density of Σc = 5.5 g cm-2 at Rc = 50 au. We also calculate some models for a very small fiducial disk, with Rc = 10 au and Σc = 140 g cm-2.
(2)where f is the mass fraction of large grains and θ is the opening angle from the midplane as viewed from the central star. The settling of large grains is prescribed as a fraction χ ∈ (0,1] of the scaleheight of the small grains, so the mass density of large grains is similar to Eq. (2), with f replacing (1−f) and χh replacing h. The vertical distribution of gas is calculated in each grid cell as ρgas = Δg/d × ρd,small × [1 + f/ (1−f)]. The latter factor adds the mass of large grains as if they were not settled in order to preserve the global Δgas/dust. The ranges and fiducial values of all parameters in our model grid are given in Table 4. The range of Rc, ψ and γ are guided by results from homogeneous sample fitting studies (Andrews et al. 2009, 2010). The main fiducial disk model has a total mass of 10-2M⊙ and a reference surface density of Σc = 5.5 g cm-2 at Rc = 50 au. We also calculate some models for a very small fiducial disk, with Rc = 10 au and Σc = 140 g cm-2.
Fiducial values and grid ranges of the model parameters.
4.2. Stellar parameters and accretion rates
The stellar spectra were approximated as pure blackbodies. For consistency, the Teff of a star was uniquely related to a combination of mass, radius and luminosity using the PISA pre-main-sequence evolutionary tracks of Tognelli et al. (2011) at a model age of 5 Myr. We adopt a Teff= 10 000 K star as representative for the Herbig Ae/Be group (spectral types B, A, F) and a 4000 K star with UV-excess for the T Tauri group (G, K, M). For Teff= 4000 K, accretion at a rate of Ṁ = 10-8M⊙ yr-1 was assumed to release energy in blackbody emission at the stellar photosphere at Tacc = 10 000 K. The relevant stellar and ultraviolet luminosities are listed in Table 5. Lyman α radiation was not explicitly considered. This does not affect the photodissociation of CO or the -ionization of C0 as only photons at ≲ 1100 Å are important. The fiducial X-ray luminosity adopted in the models, LX = 1029 erg s-1, is close to the median value for the classical T Tauri star sample from Neuhäuser et al. (1995).
4.3. Chemical network
The adopted chemical network is based on UMIST 06 (Woodall et al. 2007). It consists of 109 species, including neutral and charged PAHs, and 1463 individual reactions. In addition to two-body reactions, the code includes freezeout, thermal and photodesorption, and photodissociation and -ionization. Hydrogenation is the only grain surface reaction considered. This has no impact on the chemistry of the disk atmosphere species considered in this work.
We adopt a fiducial gas-phase elemental carbon and oxygen abundance of [C]/[H]gas = 1.35 × 10⁻⁴ and [O]/[H]gas = 2.88 × 10⁻⁴, respectively. These values are close to the medians observed in diffuse and translucent interstellar clouds by UV absorption lines of C+ and O0. The total elemental abundance of carbon is still subject to considerable uncertainties. The solar abundance is 2.69 × 10⁻⁴ (Asplund et al. 2009), whereas that of the material from which the solar system formed is estimated at 2.88 × 10⁻⁴ (Lodders 2003). Values as high as 4 × 10⁻⁴ have been advocated for the cosmic carbon abundance in the solar neighbourhood (Parvathi et al. 2012). The [C]/[H]gas ratio sets the amount of carbon that is cycled in our model between the volatile phases, i.e. atoms, molecules, and ices. The refractory carbonaceous dust reservoir is not explicitly considered. Polycyclic aromatic hydrocarbons, which absorb stellar UV photons, are a major gas heating agent in the disk atmosphere (e.g. Bakes & Tielens 1994; Habart et al. 2004). Following typical values inferred from observations (0.1...0.01; Geers et al. 2006; Kamp 2011, and references therein), the PAH abundance was set to 0.1 of the interstellar value of [PAH]/[H] ~ 10-7. When varying [C]/[H]gas, we also vary [O]/[H]gas to keep the C/O ratio constant. Keeping [O]/[H]gas fixed would make the C0 abundance more strongly dependent on [C]/[H]gas, as more oxygen would be available to bind up carbon.
Total and ultraviolet stellar luminosities.
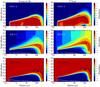 |
Fig. 4 Maps of the abundance (colour shading) and emission contribution (black lines) of the main gas-phase carbon reservoirs in a disk around a star with Teff = 10 000 K (left) and a Teff = 4000 K star with 0.1 L⊙ of UV excess (right). The solid black lines indicate areas containing 75% (thinner line) and 25% (thicker) of the emission. White lines show the vertical τ = 1 surface for the line (solid) and continuum (dashed) emission. |
5. Modelling results
In Figs. A.1 and A.2, we present the gas density, gas and dust temperature, and the extinction for the fiducial disk models. The fiducial Herbig disk is substantially warmer; notably, the CO freezeout zone (Tdust ≲ 25 K) is much larger in the T Tauri disk than in the Herbig Ae/Be one.
5.1. Origin of the CO, [CI] and [CII] emission
Abundance and emission contribution maps for the CO 6−5, [C i] 1−0, [C i] 2−1 and [C ii] 158 μm transitions are shown in Fig. 4. The exterior layers of a protoplanetary disk form a complex photodissociation region (PDR), but covering a much larger range of ngas, G0 and dust properties than standard PDRs in the ISM (Tielens & Hollenbach 1985; van Dishoeck et al. 2006). The general outcome is outside-in layering where the dominant gas-phase carbon reservoir switches from C+ to C0 and then CO. The rotational lines of CO are optically thick to high J levels and thus probe the surface area and temperature of the disk, while the optically thin [C i] and [C ii] lines are “carbon counters” for the disk atmosphere.
The emission of the CO 6−5 transition (Eu = 116.2 K) originates primarily in the outer disk, but has contributions from the entire warm molecular layer. It is optically thick out to several hundred astronomical units. The [C i] 1−0 and [C i] 2−1 transitions have upper level energies that are a factor of a few lower than CO 6−5, while the C0 atom has its peak abundance exterior to that of CO. Thus, the [C i] lines predominantly originate in the surface layers of the outer disk, with a small contribution from the inner disk. Carbon is always ionized exterior to the C0 layer and its optically thin emission probes the warm tenuous gas around the disk. Atomic carbon offers the clear advantage of counting carbon atoms in the warm atmosphere of the disk. The disk contribution can be verified with additional pointings and the line profile shape. The [C ii] line is more susceptible to nebular contamination and is usually spatially and spectrally unresolved, while the interpretation of CO usually suffers from optical depth issues.
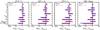 |
Fig. 5 Effect of model parameter variations on the line fluxes of carbon species in the disk atmosphere. Two central stars are considered: a 4000 K star with UV excess (red) and a pure 10 000 K photosphere (blue). Horizontal bars show the range of variation resulting from the parameter values given in Table 4. The fiducial model (black vertical line) is a disk with Rc = 50 au and with [C]/[H]gas = 1.35 × 10⁻⁴, and the reference fluxes for the 4000 K models are, from left to right, 9.6 × 10⁻¹⁹, 9.0 × 10⁻²⁰, 2.2 × 10⁻¹⁹ and 3.4 × 10⁻¹⁸W m-2; for 10 000 K they are 4.6 × 10⁻¹⁸, 2.6 × 10⁻¹⁹, 1.1 × 10⁻¹⁸ and 3.1 × 10⁻¹⁷W m-2. |
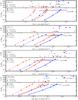 |
Fig. 6 APEX observations (circles, triangles) and DALI full disk models (diamonds) of the CO 6−5 (top), [C i] 1−0, [C i] 2−1, and [C ii] 158 μm (bottom) transitions. All values are colour-coded for the stellar Teff; T Tauri stars are red and Herbig Ae/Be stars blue. The fluxes are plotted with stellar Teff values in the upper subpanels (with [C]/[H]gas= 1.35 × 10⁻⁴ and Rc = 50 au fixed for the fiducial model), and with the gas-phase total elemental carbon abundance, [C]/[H]gas, in the lower subpanels (solid lines connect models with Rc = 50 au, dashed lines Rc = 10 au). Horizontal lines in the lower subpanels show the flux changes from varying the gas-to-dust ratio by a factor of ten around the fiducial T Tauri and Herbig Ae/Be models. |
5.2. Degeneracy of [C]/[H]gas with other parameters
In Fig. 5, the effect of various disk model parameters on the emergent line fluxes of CO, [C i] and [C ii] is shown and compared with the effect of varying [C]/[H]gas for the stars representing the T Tauri and Herbig Ae/Be classes. The parameters with the smallest influence on the line fluxes include the flaring parameters (ψ and hc), the mass and scaleheight ratio of large to small grains (f and χ), the inner hole size (rhole) and the cosmic ray ionization rate (ζcr). Considering the [C i] 1−0 line flux, these parameters individually lead to variations of a factor of no more than two within the full range of values listed in Table 4. These parameter dependencies are discussed in more detail in Appendix B.
The disk surface density scaling (Σc(Rc) for Rc = const) and power-law index (γ) both yield variations of up to a factor of five in line flux, but the corresponding change in Σc(Rc) is equivalent to two orders of magnitude in disk mass.
As the mass of dust contributing to the optical through millimetre opacity is known to reasonable accuracy, the next main uncertainty is the gas-to-dust ratio (Δgas/dust). A change of one order of magnitude in this ratio induces a change of a factor of three in the [C i] lines, and a factor of two in CO and [C ii]. This is comparable to one order of magnitude in [C]/[H]gas. A gas-phase carbon underabundance of one to two orders of magnitude, such as has been proposed for TW Hya (Favre et al. 2013), is easily distinguishable from all the reasonable parameter variations explored above. Furthermore, while factor of two changes in [C]/[H]gas are easily masked by various parameter uncertainties, a carbon underabundance of one order of magnitude can be readily identified as long as Rc is determined to within a factor of two and the disk flaring type – flat, with ψ ≈ 0.1, or flared, with ψ ≳ 0.2 – is known. Both of these are reasonable requirements, especially as the spatial resolution of ALMA will allow the radial size of disks to be determined within a few hundred parsecs to much better than a factor of two.
In summary, if the large-scale radial structure of the disk is known to a level reasonably expected in the ALMA era, and the flaring state of the disk is known (from the mid- to far-infrared SED, for example), a gas-phase carbon underabundance of an order of magnitude or more can be distinguished from reasonable variations of individual parameters. A more accurate estimate of [C]/[H]gas will require detailed modelling of the disk of interest in order to avoid unfavourable combinations of parameter uncertainties. Masking an underabundance as severe as two orders of magnitude in [C]/[H]gas would require unreasonable fine-tuning of such parameter variations, however.
5.3. Comparison with observations
In Fig. 6, we compare the APEX observations of CO 6−5, [C i] 1−0, and [C i] 2−1with a grid of DALI models. We also show the literature [C ii] fluxes. To cover the spectral types in our sample, we vary the stellar properties from a Teff4000 K T Tauri star with UV excess to a 12 000 K Herbig star in steps of 2000 K. The luminosities are given in Table 5. For the Teff= 4000 K and 10 000 K stars, we show two disk sizes, Rc = 10 and 50 au, and vary the gas-phase carbon abundance, [C]/[H]gas∈ [10-6,2 × 10⁻⁴]. The total disk mass is fixed at Mdisk = 10-2M⊙, except when varying the gas-to-dust ratio by a factor of ten where we keep the dust mass fixed. All fluxes are normalized to a distance of 140 pc, and colour-coded for the stellar effective temperature.
As detailed in the following two subsections, most of our observations fall within reasonable variations of the model parameters. Owing to limited sensitivity, none of the observed lines strongly constrains the carbon abundance in most sources. A subset of sources are brighter than the models at some of the targeted frequencies. These are very flared disks with large inner cavities (HD 142527, HD 97048, Oph IRS 48) or with a powerful jet ([C ii] towards DG Tau).
5.3.1. T Tauri systems (spectral types G, K, M)
CO 6−5: the observations fall almost entirely between the fiducial Rc = 10 and 50 au models with an ISM-like [C]/[H]gas. This underlines the importance of knowing the radial extent of the gas disk for constraining [C]/[H]gas. The three disks with the deepest CO limits (BP Tau, T Cha) or detections (TW Hya) may be carbon-depleted, while the three disks with the brightest detections (AS 205, Sz 33, V806 Tau) are likely contaminated by envelope or disk wind emission.
[C i] 1−0: the detection towards TW Hya confirms its low [C]/[H]gas ratio, while the other four observations lie above most of the models. The two detections among these four are likely residual envelope or molecular cloud emission, as the line profiles are very narrow. Narrow lines are unexpected for both AA Tau, which is a well-known edge-on disk, as well as for DM Tau, which has i = 32°, and where the CO 6−5 line is substantially broader than the [C i] 1−0 (see Fig. 3).
[C i] 2−1: all targeted disks with the exception of TW Hya have upper limits above the model grid. The upper limit for TW Hya does not strongly constrain [C]/[H]gas, but is consistent with the low value inferred from CO 6−5 and [C i] 1−0.
[C ii] 158 μm: the upper limits from Howard et al. (2013) are generally not yet sensitive enough to lie in the model parameter space, with the exception of the datapoint for TW Hya from Thi et al. (2010). The second-lowest [C ii] 158 μm upper limit is obtained for AA Tau. The point lies close to an ISM-like model [C]/[H]gas and does not provide a strong constraint.
Additional comments: BP Tau and T Cha have distance-normalized CO 6−5 upper limits below the detection of TW Hya, which is an extremely weak CO, [C i] and [C ii] emitter. Combined with the known gas disk radius of ≈ 215 au (Andrews et al. 2012), the CO and [C i] line fluxes for TW Hya are consistent with a factor of 10−100 underabundance of gas-phase carbon (Favre et al. 2013; Kama et al. 2015). The gas disk of BP Tau extends to ≈ 100 au, and the CO-based disk mass is only Mdisk = 1.2 × 10⁻³ (Dutrey et al. 2003). The gas disk of T Cha extends to ≈ 200 au (Huelamo et al. 2015). Given their considerable radial sizes, comparable to that of TW Hya, the disks of both BP Tau and T Cha thus have either a low Δgas/dust or a low [C]/[H]gas ratio. DM Tau and IM Lup are large disks with CO 6−5 fluxes comparable to our models with interstellar [C]/[H]gas. GG Tau A appears similar, but is a special case as it is a large circum-triple ring and is not directly comparable to any of our models (Guilloteau et al. 1999; Di Folco et al. 2014). AS 205, Sz 33 and V806 Tau have substantially larger CO 6−5 fluxes than predicted by our fiducial models, placing them close to the Herbig disks. As discussed earlier, remnant envelopes and disk winds could dominate emission in these systems. If the systems are very young, the stellar luminosity for a given Teff could also be substantially larger.
5.3.2. Herbig Ae/Be systems (spectral types B, A, F)
CO 6−5: all non-extended, non-contaminated detections of CO around early-type stars are from group I systems. This notation follows the Meeus et al. (2001) classification of Herbig Ae/Be disks as flaring/warm (group I) and flat/cold (group II). Our findings are consistent with the flaring disks being warmer, which means they are stronger emitters (see also the effects of ψ and hC in Fig. 5). All the detected disks have inner holes – HD 97048, HD 100546 and HD 169142 (hole radii 34, 13, and 23 au, respectively, Maaskant et al. 2013; Panić et al. 2014; Walsh et al. 2014). However, the line is not detected towards HD 139614 (5.6 au Matter et al. 2014), which has a dust mass and spectral type very similar to HD 169142 (≈ 1 × 10⁻⁴M⊙ and A8/A5 Dent et al. 2005; Panić et al. 2008; Maaskant et al. 2013). This, combined with its large outer radius of 150 au (Matter et al. 2016), suggests a low Δgas/dust or [C]/[H]gas. Two early-type disks lie below even the late-type locus on the CO 6−5 axis. Two of these resemble debris disks: HD 141569 is a transitional disk with no substantial surface density at radii below ~ 95 au (Dent et al. 2005; Jonkheid et al. 2006), and HD 100453 has a CO-based gas mass of only 10-4M⊙ and an inner cavity of 20 au (Khalafinejad et al. 2016; Collins et al. 2009).
[C i] 1−0: detections are obtained towards three flaring, group I disks. The detection in HD 100546 shows a clear double-peaked Keplerian profile, while the other two (HD 97048 and Oph IRS 48) are likely contaminated by foreground or extended emission. The upper limits towards HD 163296 and HD 169142 allow both small and large disk models with an ISM-like [C]/[H]gas, while the upper limit towards HD 104237 lies between the Rc = 10 and 50 au models.
[C i] 2−1: the only detection is towards the very flared and embedded disk, HD 97048. Nearly all the upper limits lie close to, or above, the large (Rc = 50 au) disk models with an ISM-like [C]/[H]gas. The deepest distance-normalized upper limit is obtained for HD 100453, a gas- or carbon-depleted transitional disk described earlier in this subsection.
[C ii] 158 μm: similarly to CO 6−5, all detections of this line are from group I disks, although contamination cannot be checked as easily as for CO. None of the Herschel/PACS [C ii] 158 μm upper limits from Meeus et al. (2012), Dent et al. (2013), Fedele et al. (2013b) on our Herbig Ae/Be targets provide strong constraints on the gas content or carbon abundance. Most of the upper limits lie between the fiducial Rc = 10 and 50 au models with an ISM-like [C]/[H]gas. We have also compared our model grid with the full sample of the above Herschel studies (not plotted), and find that the only anomalously deep upper limits are for debris disks, where the gas content is low (e.g. HR 1998, 49 Cet, HD 158352).
Additional comments: HD 50138 may be an evolved star. It was included in the sample as a possible protoplanetary disk and is often treated as such in the literature, but see e.g. Ellerbroek et al. (2015) for a discussion of its unclear nature. Its CO 6−5 upper limit falls between our Rc = 10 and 50 au models, while the [C ii] detection is an order of magnitude brighter than any of our Herbig Ae/Be disk models.
5.4. Summary of carbon abundance constraints
Our APEX survey observations of the [C i] 1−0 and [C i] 2−1 lines, with typical detection limits within a factor of a few of 10-18W m-2 at 140 pc, are not yet sensitive enough to strongly constrain [C]/[H]gas in most disks. They require an improvement of a factor of three to ten. This corresponds to observations of ≈ 10 h per source with APEX, if overheads are included. Our deep exposures towards HD 100546 and TW Hya demonstrate that detections can be made in this way in the brightest disks. On ALMA, a similar sensitivity can be reached in ≈ 1 h for a synthesized beam of ≈ 0.5′′. ALMA is essential for extending the [C i] detection sample beyond the few nearest, brightest disks. Equally importantly, any extended emission around the disk will be filtered out by ALMA. Its spatial resolution is sufficient to resolve the CO snowline and study any associated gas-phase carbon abundance variations in many systems, including TW Hya.
The sensitive detection of [C i] 1−0 towards TW Hya (corresponding to 7 × 10-20W m-2 at 140 pc; we note that the source is at 55 pc) is consistent with a factor of 100 underabundance of gas-phase carbon, confirming the result of Favre et al. (2013). For HD 100546, the detection (2 × 10-19W m-2 at 140 pc; the source is at 97 pc) suggests a gas-phase abundance close to the interstellar value, consistent with earlier work by Bruderer et al. (2012). For both sources, detailed models of the disk structure, in particular constraining the radial extent of the disk, are needed to determine [C]/[H]gas with better precision. We present this modelling in a companion paper (Kama et al. 2015).
Several sources in our sample have relatively deep upper limits on CO or [C i]. They could be either gas- or carbon-poor. These systems are BP Tau, T Cha, HD 139614, HD 141569, and HD 100453. The last two have low CO-based gas mass estimates and are often considered debris-disk-like systems; however, without an absolute gas mass determination, a carbon depletion cannot be entirely ruled out.
6. Conclusions
We present observations and modelling of the main gas-phase carbon reservoirs in protoplanetary disk atmospheres, C0 and CO. We observed 37 disks with the APEX telescope, and employed DALI physical-chemical models to interpret the data and investigate the relation of CO, [C i] and [C ii] emission with the gas-phase carbon abundance, [C]/[H]gas.
-
1.
Among our full sample, CO 6−5 is detected(observed) towards 13 (33) sources;[C i] 1−0 in 6 (12); and[C i] 2−1 in 1 (33). The[C i] detections are extended orof unclear origin in all sources except TW Hya andHD 100546.
-
2.
We detect [C i] 1−0 from the disks around TW Hya and HD 100546, the first unambiguous detections of this line in protoplanetary disks. The HD 100546 emission has a symmetric double-peaked line profile.
-
3.
Based on a grid of models, we find that the survey sensitivity, typically 10-19W m-2 for [C i] 1−0 and 10-18W m-2 for [C i] 2−1, needs to be improved by a factor of at least three to obtain useful constraints on [C]/[H]gas for most systems.
-
4.
An underabundance of one order of magnitude for gas-phase carbon cannot easily be masked by other disk properties, if they are known to a level made possible by ALMA, Herschel and Spitzer (Fig. 5). Larger underabundances are even more reliably identified. The most essential information for constraining the gas-phase carbon abundance is the radial extent of the gas disk.
-
5.
A comparison with our general grid of models suggests that gas-phase carbon is underabundant by up to a factor 100 in TW Hya, while for HD 100546 the comparison suggests a roughly interstellar abundance. For a detailed analysis, see Kama et al. (2015).
-
6.
BP Tau, T Cha, HD 139614, HD 141569, and HD 100453 warrant follow-up as potentially carbon-depleted disks.
-
7.
The low detection rate of [C ii] emission with Herschel/PACS in T Tauri disks is due to insufficient sensitivity, while the Herbig Ae/Be systems with no detection are typically gas-poor debris disks.
Acknowledgments
We thank the anonymous referee for constructive comments which helped to improve the paper, Arnaud Belloche and the APEX staff for assistance during the observations, and Matthijs van der Wiel for discussing his SPIRE observations with us. This work is supported by a Royal Netherlands Academy of Arts and Sciences (KNAW) professor prize, the Netherlands Research School for Astronomy (NOVA), and by the European Union A-ERC grant 291141 CHEMPLAN. A.K. acknowledges support from the Foundation for Polish Science (FNP) and the Polish National Science Center grant 2013/11/N/ST9/00400. R.J.W. is supported by NASA through the Einstein Postdoctoral grant number PF2-130104 awarded by the Chandra X-ray Center, which is operated by the Smithsonian Astrophysical Observatory for NASA under contract NAS8-03060. This publication is based on data acquired with the Atacama Pathfinder Experiment (APEX). APEX is a collaboration between the Max-Planck-Institut für Radioastronomie, the European Southern Observatory, and the Onsala Space Observatory. CHAMP+ was constructed with support from the Netherlands Organization for Scientific Research (NWO), grant 600.063.310.10.
References
- Acke, B., & van den Ancker, M. E. 2004, A&A, 426, 151 [NASA ADS] [CrossRef] [EDP Sciences] [Google Scholar]
- Andersson, B.-G., Idzi, R., Uomoto, A., et al. 2002, AJ, 124, 2164 [NASA ADS] [CrossRef] [Google Scholar]
- Andrews, S. M., Wilner, D. J., Hughes, A. M., Qi, C., & Dullemond, C. P. 2009, ApJ, 700, 1502 [NASA ADS] [CrossRef] [Google Scholar]
- Andrews, S. M., Wilner, D. J., Hughes, A. M., Qi, C., & Dullemond, C. P. 2010, ApJ, 723, 1241 [NASA ADS] [CrossRef] [Google Scholar]
- Andrews, S. M., Wilner, D. J., Hughes, A. M., et al. 2012, ApJ, 744, 162 [NASA ADS] [CrossRef] [Google Scholar]
- Asplund, M., Grevesse, N., Sauval, A. J., & Scott, P. 2009, ARA&A, 47, 481 [NASA ADS] [CrossRef] [Google Scholar]
- Bakes, E. L. O., & Tielens, A. G. G. M. 1994, ApJ, 427, 822 [NASA ADS] [CrossRef] [Google Scholar]
- Bast, J. E., Brown, J. M., Herczeg, G. J., van Dishoeck, E. F., & Pontoppidan, K. M. 2011, A&A, 527, A119 [NASA ADS] [CrossRef] [EDP Sciences] [Google Scholar]
- Bergin, E. A., Cleeves, L. I., Gorti, U., et al. 2013, Nature, 493, 644 [NASA ADS] [CrossRef] [PubMed] [Google Scholar]
- Bergin, E. A., Cleeves, L. I., Crockett, N., & Blake, G. A. 2014, Faraday Discussions, 168, 61 [NASA ADS] [CrossRef] [Google Scholar]
- Bertout, C., Siess, L., & Cabrit, S. 2007, A&A, 473, L21 [NASA ADS] [CrossRef] [EDP Sciences] [Google Scholar]
- Brown, J. M., Herczeg, G. J., Pontoppidan, K. M., & van Dishoeck, E. F. 2012, ApJ, 744, 116 [NASA ADS] [CrossRef] [Google Scholar]
- Brown, J. M., Pontoppidan, K. M., van Dishoeck, E. F., et al. 2013, ApJ, 770, 94 [NASA ADS] [CrossRef] [Google Scholar]
- Bruderer, S. 2013, A&A, 559, A46 [NASA ADS] [CrossRef] [EDP Sciences] [Google Scholar]
- Bruderer, S., van Dishoeck, E. F., Doty, S. D., & Herczeg, G. J. 2012, A&A, 541, A91 [NASA ADS] [CrossRef] [EDP Sciences] [Google Scholar]
- Canovas, H., Ménard, F., Hales, A., et al. 2013, A&A, 556, A123 [NASA ADS] [CrossRef] [EDP Sciences] [Google Scholar]
- Cardelli, J. A., Meyer, D. M., Jura, M., & Savage, B. D. 1996, ApJ, 467, 334 [NASA ADS] [CrossRef] [Google Scholar]
- Carmona, A., van den Ancker, M. E., Henning, T., et al. 2007, A&A, 476, 853 [NASA ADS] [CrossRef] [EDP Sciences] [Google Scholar]
- Casassus, S., Hales, A., de Gregorio, I., et al. 2013, A&A, 553, A64 [NASA ADS] [CrossRef] [EDP Sciences] [Google Scholar]
- Chapillon, E., Parise, B., Guilloteau, S., Dutrey, A., & Wakelam, V. 2010, A&A, 520, A61 [NASA ADS] [CrossRef] [EDP Sciences] [Google Scholar]
- Collins, K. A., Grady, C. A., Hamaguchi, K., et al. 2009, ApJ, 697, 557 [NASA ADS] [CrossRef] [Google Scholar]
- Cox, A. W., Grady, C. A., Hammel, H. B., et al. 2013, ApJ, 762, 40 [NASA ADS] [CrossRef] [Google Scholar]
- Daemgen, S., Petr-Gotzens, M. G., Correia, S., et al. 2013, A&A, 554, A43 [NASA ADS] [CrossRef] [EDP Sciences] [Google Scholar]
- de Gregorio-Monsalvo, I., Ménard, F., Dent, W., et al. 2013, A&A, 557, A133 [NASA ADS] [CrossRef] [EDP Sciences] [Google Scholar]
- Dent, W. R. F., Greaves, J. S., & Coulson, I. M. 2005, MNRAS, 359, 663 [NASA ADS] [CrossRef] [Google Scholar]
- Dent, W. R. F., Thi, W. F., Kamp, I., et al. 2013, PASP, 125, 477 [NASA ADS] [CrossRef] [Google Scholar]
- Di Folco, E., Dutrey, A., Le Bouquin, J.-B., et al. 2014, A&A, 565, L2 [NASA ADS] [CrossRef] [EDP Sciences] [Google Scholar]
- Doucet, C., Habart, E., Pantin, E., et al. 2007, A&A, 470, 625 [CrossRef] [EDP Sciences] [Google Scholar]
- Dutrey, A., Guilloteau, S., & Simon, M. 2003, A&A, 402, 1003 [NASA ADS] [CrossRef] [EDP Sciences] [Google Scholar]
- Eisner, J. A., Hillenbrand, L. A., White, R. J., Akeson, R. L., & Sargent, A. I. 2005, ApJ, 623, 952 [NASA ADS] [CrossRef] [Google Scholar]
- Ellerbroek, L. E., Benisty, M., Kraus, S., et al. 2015, A&A, 573, A77 [NASA ADS] [CrossRef] [EDP Sciences] [Google Scholar]
- Espaillat, C., Calvet, N., D’Alessio, P., et al. 2007, ApJ, 664, L111 [NASA ADS] [CrossRef] [Google Scholar]
- Favre, C., Cleeves, L. I., Bergin, E. A., Qi, C., & Blake, G. A. 2013, ApJ, 776, L38 [NASA ADS] [CrossRef] [Google Scholar]
- Fedele, D., Bruderer, S., van Dishoeck, E. F., et al. 2013a, A&A, 559, A77 [NASA ADS] [CrossRef] [EDP Sciences] [Google Scholar]
- Fedele, D., Bruderer, S., van Dishoeck, E. F., et al. 2013b, ApJ, 776, L3 [NASA ADS] [CrossRef] [Google Scholar]
- France, K., Schindhelm, E., Bergin, E. A., Roueff, E., & Abgrall, H. 2014, ApJ, 784, 127 [NASA ADS] [CrossRef] [Google Scholar]
- Geers, V. C., Augereau, J.-C., Pontoppidan, K. M., et al. 2006, A&A, 459, 545 [NASA ADS] [CrossRef] [EDP Sciences] [Google Scholar]
- Guilloteau, S., & Dutrey, A. 1994, A&A, 291, L23 [NASA ADS] [Google Scholar]
- Guilloteau, S., Dutrey, A., & Simon, M. 1999, A&A, 348, 570 [NASA ADS] [Google Scholar]
- Guilloteau, S., Dutrey, A., Piétu, V., & Boehler, Y. 2011, A&A, 529, A105 [NASA ADS] [CrossRef] [EDP Sciences] [Google Scholar]
- Güsten, R., Nyman, L. Å., Schilke, P., et al. 2006, A&A, 454, L13 [NASA ADS] [CrossRef] [EDP Sciences] [Google Scholar]
- Habart, E., Natta, A., & Krügel, E. 2004, A&A, 427, 179 [NASA ADS] [CrossRef] [EDP Sciences] [Google Scholar]
- Henning, T., & Salama, F. 1998, Science, 282, 2204 [NASA ADS] [CrossRef] [PubMed] [Google Scholar]
- Heyminck, S., Kasemann, C., Güsten, R., de Lange, G., & Graf, U. U. 2006, A&A, 454, L21 [NASA ADS] [CrossRef] [EDP Sciences] [Google Scholar]
- Howard, C. D., Sandell, G., Vacca, W. D., et al. 2013, ApJ, 776, 21 [NASA ADS] [CrossRef] [Google Scholar]
- Huelamo, N., de Gregorio-Monsalvo, I., Macias, E., et al. 2015, A&A, 575, L5 [NASA ADS] [CrossRef] [EDP Sciences] [Google Scholar]
- Hussain, G. A. J., Collier Cameron, A., Jardine, M. M., et al. 2009, MNRAS, 398, 189 [NASA ADS] [CrossRef] [Google Scholar]
- Isella, A., Natta, A., Wilner, D., Carpenter, J. M., & Testi, L. 2010, ApJ, 725, 1735 [NASA ADS] [CrossRef] [Google Scholar]
- Jonkheid, B., Kamp, I., Augereau, J.-C., & van Dishoeck, E. F. 2006, A&A, 453, 163 [NASA ADS] [CrossRef] [EDP Sciences] [Google Scholar]
- Kama, M., Bruderer, S., van Dishoeck, E. F., et al. 2015, A&A, submitted [Google Scholar]
- Kamp, I. 2011, in EAS Publ. Ser., 46, eds. C. Joblin, & A. G. G. M. Tielens, 271 [Google Scholar]
- Kasemann, C., Güsten, R., Heyminck, S., et al. 2006, in SPIE Conf. Ser., 6275, 62750N [Google Scholar]
- Kastner, J. H., Zuckerman, B., Hily-Blant, P., & Forveille, T. 2008, A&A, 492, 469 [NASA ADS] [CrossRef] [EDP Sciences] [Google Scholar]
- Khalafinejad, S., Maaskant, K. M., Marinas, N., & Tielens, A. G. G. M. 2016, A&A, 587, A62 [NASA ADS] [CrossRef] [EDP Sciences] [Google Scholar]
- Knude, J., & Hog, E. 1998, A&A, 338, 897 [NASA ADS] [Google Scholar]
- Koerner, D. W., & Sargent, A. I. 1995, AJ, 109, 2138 [NASA ADS] [CrossRef] [Google Scholar]
- Lee, J.-E., Bergin, E. A., & Nomura, H. 2010, ApJ, 710, L21 [NASA ADS] [CrossRef] [Google Scholar]
- Lodders, K. 2003, ApJ, 591, 1220 [NASA ADS] [CrossRef] [Google Scholar]
- Lombardi, M., Lada, C. J., & Alves, J. 2008, A&A, 480, 785 [NASA ADS] [CrossRef] [EDP Sciences] [Google Scholar]
- Luhman, K. L. 2001, ApJ, 560, 287 [NASA ADS] [CrossRef] [Google Scholar]
- Luhman, K. L. 2004, ApJ, 602, 816 [NASA ADS] [CrossRef] [Google Scholar]
- Maaskant, K. M., Honda, M., Waters, L. B. F. M., et al. 2013, A&A, 555, A64 [NASA ADS] [CrossRef] [EDP Sciences] [Google Scholar]
- Malfait, K., Bogaert, E., & Waelkens, C. 1998, A&A, 331, 211 [NASA ADS] [Google Scholar]
- Mamajek, E. E. 2008, Astron. Nachr., 329, 10 [Google Scholar]
- Matter, A., Labadie, L., Kreplin, A., et al. 2014, A&A, 561, A26 [NASA ADS] [CrossRef] [EDP Sciences] [Google Scholar]
- Matter, A., Labadie, L., Augereau, J.-C., et al. 2016, A&A, 586, A11 [NASA ADS] [CrossRef] [EDP Sciences] [Google Scholar]
- McCleary, J., Stecklum, B., Grady, C., Woodgate, B., & York, D. 2007, BAAS, 39, 849 [NASA ADS] [Google Scholar]
- Meeus, G., Waters, L. B. F. M., Bouwman, J., et al. 2001, A&A, 365, 476 [NASA ADS] [CrossRef] [EDP Sciences] [Google Scholar]
- Meeus, G., Montesinos, B., Mendigutía, I., et al. 2012, A&A, 544, A78 [NASA ADS] [CrossRef] [EDP Sciences] [Google Scholar]
- Miotello, A., Bruderer, S., & van Dishoeck, E. F. 2014, A&A, 572, A96 [NASA ADS] [CrossRef] [EDP Sciences] [Google Scholar]
- Monnier, J. D., Tannirkulam, A., Tuthill, P. G., et al. 2008, ApJ, 681, L97 [NASA ADS] [CrossRef] [Google Scholar]
- Muders, D., Hafok, H., Wyrowski, F., et al. 2006, A&A, 454, L25 [NASA ADS] [CrossRef] [EDP Sciences] [Google Scholar]
- Neuhäuser, R., Sterzik, M. F., Schmitt, J. H. M. M., Wichmann, R., & Krautter, J. 1995, A&A, 297, 391 [NASA ADS] [Google Scholar]
- Panić, O., & Hogerheijde, M. R. 2009, A&A, 508, 707 [NASA ADS] [CrossRef] [EDP Sciences] [Google Scholar]
- Panić, O., Hogerheijde, M. R., Wilner, D., & Qi, C. 2008, A&A, 491, 219 [NASA ADS] [CrossRef] [EDP Sciences] [Google Scholar]
- Panić, O., Hogerheijde, M. R., Wilner, D., & Qi, C. 2009, A&A, 501, 269 [NASA ADS] [CrossRef] [EDP Sciences] [Google Scholar]
- Panić, O., van Dishoeck, E. F., Hogerheijde, M. R., et al. 2010, A&A, 519, A110 [NASA ADS] [CrossRef] [EDP Sciences] [Google Scholar]
- Panić, O., Ratzka, T., Mulders, G. D., et al. 2014, A&A, 562, A101 [NASA ADS] [CrossRef] [EDP Sciences] [Google Scholar]
- Parvathi, V. S., Sofia, U. J., Murthy, J., & Babu, B. R. S. 2012, ApJ, 760, 36 [NASA ADS] [CrossRef] [Google Scholar]
- Pontoppidan, K. M., & Blevins, S. M. 2014, Faraday Discussions, 169, 49 [Google Scholar]
- Pontoppidan, K. M., Blake, G. A., & Smette, A. 2011, ApJ, 733, 84 [NASA ADS] [CrossRef] [Google Scholar]
- Pontoppidan, K. M., Salyk, C., Bergin, E. A., et al. 2014, Protostars and Planets VI, 363 [Google Scholar]
- Preibisch, T., Kraus, S., Driebe, T., van Boekel, R., & Weigelt, G. 2006, A&A, 458, 235 [NASA ADS] [CrossRef] [EDP Sciences] [Google Scholar]
- Qi, C., Ho, P. T. P., Wilner, D. J., et al. 2004, ApJ, 616, L11 [NASA ADS] [CrossRef] [Google Scholar]
- Rucinski, S. M., & Krautter, J. 1983, A&A, 121, 217 [NASA ADS] [Google Scholar]
- Salyk, C., Pontoppidan, K., Corder, S., et al. 2014, ApJ, 792, 68 [NASA ADS] [CrossRef] [Google Scholar]
- Simon, M., Dutrey, A., & Guilloteau, S. 2000, ApJ, 545, 1034 [NASA ADS] [CrossRef] [Google Scholar]
- Stark, D. P., Whitney, B. A., Stassun, K., & Wood, K. 2006, ApJ, 649, 900 [NASA ADS] [CrossRef] [Google Scholar]
- Thi, W. F., van Dishoeck, E. F., Blake, G. A., et al. 2001, ApJ, 561, 1074 [NASA ADS] [CrossRef] [Google Scholar]
- Thi, W.-F., van Zadelhoff, G.-J., & van Dishoeck, E. F. 2004, A&A, 425, 955 [NASA ADS] [CrossRef] [EDP Sciences] [Google Scholar]
- Thi, W.-F., Mathews, G., Ménard, F., et al. 2010, A&A, 518, L125 [NASA ADS] [CrossRef] [EDP Sciences] [Google Scholar]
- Tielens, A. G. G. M. 2008, ARA&A, 46, 289 [NASA ADS] [CrossRef] [EDP Sciences] [Google Scholar]
- Tielens, A. G. G. M., & Hollenbach, D. 1985, ApJ, 291, 722 [NASA ADS] [CrossRef] [Google Scholar]
- Tognelli, E., Prada Moroni, P. G., & Degl’Innocenti, S. 2011, A&A, 533, A109 [NASA ADS] [CrossRef] [EDP Sciences] [Google Scholar]
- Torres, C. A. O., Quast, G. R., da Silva, L., et al. 2006, A&A, 460, 695 [NASA ADS] [CrossRef] [EDP Sciences] [Google Scholar]
- Torres, C. A. O., Quast, G. R., Melo, C. H. F., & Sterzik, M. F. 2008, Young Nearby Loose Associations, ed. B. Reipurth, 757 [Google Scholar]
- Torres, R. M., Loinard, L., Mioduszewski, A. J., & Rodríguez, L. F. 2009, ApJ, 698, 242 [NASA ADS] [CrossRef] [Google Scholar]
- Torres, R. M., Loinard, L., Mioduszewski, A. J., et al. 2012, ApJ, 747, 18 [NASA ADS] [CrossRef] [Google Scholar]
- Tsukagoshi, T., Momose, M., Saito, M., et al. 2015, ApJ, 802, L7 [NASA ADS] [CrossRef] [Google Scholar]
- Unterborn, C. T., Kabbes, J. E., Pigott, J. S., Reaman, D. M., & Panero, W. R. 2014, ApJ, 793, 124 [NASA ADS] [CrossRef] [Google Scholar]
- van Boekel, R., Min, M., Waters, L. B. F. M., et al. 2005, A&A, 437, 189 [NASA ADS] [CrossRef] [EDP Sciences] [Google Scholar]
- van der Marel, N., van Dishoeck, E. F., Bruderer, S., et al. 2013, Science, 340, 1199 [NASA ADS] [CrossRef] [PubMed] [Google Scholar]
- van der Wiel, M. H. D., Naylor, D. A., Kamp, I., et al. 2014, MNRAS, 444, 3911 [NASA ADS] [CrossRef] [Google Scholar]
- van Dishoeck, E. F., Jonkheid, B., & van Hemert, M. C. 2006, Faraday Discussions, 133, 231 [NASA ADS] [CrossRef] [PubMed] [Google Scholar]
- van Kempen, T. A., van Dishoeck, E. F., Brinch, C., & Hogerheijde, M. R. 2007, A&A, 461, 983 [NASA ADS] [CrossRef] [EDP Sciences] [Google Scholar]
- van Leeuwen, F. 2007, A&A, 474, 653 [NASA ADS] [CrossRef] [EDP Sciences] [Google Scholar]
- van Zadelhoff, G.-J., van Dishoeck, E. F., Thi, W.-F., & Blake, G. A. 2001, A&A, 377, 566 [NASA ADS] [CrossRef] [EDP Sciences] [Google Scholar]
- Walsh, C., Juhász, A., Pinilla, P., et al. 2014, ApJ, 791, L6 [NASA ADS] [CrossRef] [Google Scholar]
- Weinberger, A. J., Becklin, E. E., Schneider, G., et al. 1999, ApJ, 525, L53 [NASA ADS] [CrossRef] [PubMed] [Google Scholar]
- White, R. J., & Ghez, A. M. 2001, ApJ, 556, 265 [Google Scholar]
- Wichmann, R., Bastian, U., Krautter, J., Jankovics, I., & Rucinski, S. M. 1998, MNRAS, 301, L39 [NASA ADS] [CrossRef] [Google Scholar]
- Woodall, J., Agúndez, M., Markwick-Kemper, A. J., & Millar, T. J. 2007, A&A, 466, 1197 [NASA ADS] [CrossRef] [EDP Sciences] [Google Scholar]
- Zuckerman, B., Forveille, T., & Kastner, J. H. 1995, Nature, 373, 494 [NASA ADS] [CrossRef] [PubMed] [Google Scholar]
Appendix A: Structure of the disk models
In Figs. A.1 and A.2, we show the density structure and the gas and dust temperature, as well as the ultraviolet field in interstellar units (denoted G0) for the fiducial T Tauri and Herbig Ae/Be disk models.
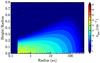 |
Fig. A.1 Gas density structure of the fiducial disk model. |
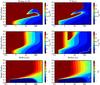 |
Fig. A.2 Fiducial disk models for a Teff10000 K star (Herbig Ae/Be, left column) and a Teff4000 K star with an ultraviolet excess (representing T Tauri disks, right column). From top to bottom, the panels show the gas temperature, dust temperature, and the ultraviolet field in standard interstellar field units G0. |
Appendix B: Degeneracy of [C]/[H]gas with other parameters
Elemental gas-phase carbon abundance ([C]/[H]gas). Order-of-magnitude changes in [C]/[H]gas outweigh the impact of reasonable variations of any other individual parameter. The fluxes of all lines except CO 6−5 change by a factor of five for a factor of ten change in [C]/[H]gas, implying that large underabundances of the magnitude proposed for TW Hya – more than one order of magnitude – can be reliably identified if the disk structure is reasonably constrained.
Gas-to-dust ratio (Δgas/dust). This parameter is varied by changing the gas mass. Assuming a line becomes optically thick at some fixed column density of gas, and ignoring other effects, the emitting area scales as  , where γ′ is the power-law index of the local surface density profile Σ(r) ∝ r− γ′. For the global γ = 1.0, the CO emission thus scales weakly with the gas mass in the exponentially decreasing outer tail of
the surface density (large local γ′). Once the optically thick surface is limited to smaller radii, the relation becomes steeper (small local γ′). The initial slow decrease of the line emission with gas mass is also related to the smaller importance of the cold outer disk, which can be interpreted as a further decline in the surface density of particles in the required upper energy state. For C0 line fluxes, one order of magnitude in Δgas/dust ratio gives the same change as a factor of three in [C]/[H]gas. Therefore, an order-of-magnitude scale underabundance of gas-phase carbon can be identified even with a poorly known Δgas/dust.
Disk surface density power-law index (γ). If Σc and Rc are fixed, increasing gamma increases the fluxes of all lines. From γ = 0.8 to 1.5, the C0 line fluxes can increase by a factor of three to ten. This is related to an increase in disk mass, which doubles. In the power-law surface density with an exponential taper, we note that γ = 1.5 yields quite a shallow surface density profile in the exponential tail, which is reflected in an increased CO emitting area in the outer disk.
Disk surface density anchorpoint (Rc). Given a γ and Σc, this parameter sets the radial size of the disk, which can be defined as the extent of optically thick CO emission.
The disk surface density scaling (Σc(Rc)). For a fixed Rc, this parameter varies the disk mass. For a range of three orders of magnitude in gas mass, the largest line flux variation amplitude (CO 6−5) is a factor of ten.
The flaring parameters (ψ and hc). The variation amplitude of ψ leads to up to a factor of five in CO and [C i] line fluxes, but [C ii] can vary by an order of magnitude. The CO and C0 line fluxes depend on ψ in all cases, while C+ becomes more sensitive with increasing ultraviolet flux (10 000 K emission). For a pure 4000 K radiation field, Tkin is too low in the tenuous upper layers of the disk to produce substantial [C ii] 158 μm emission. Varying hc has up to a factor of two impact on the lines, as it changes the volume of warm gas.
Mass ratio of large to small grains (f). Decreasing the fraction of large grains increases the optical depth of the disk material at short wavelengths, making the emitting regions colder. The ionized carbon is in completely optically thin gas and is less affected. From f = 0.2 to 0.999, the variation in CO line flux does not exceed a factor of three, with C0 and C+ less affected.
Inner hole size (rhole). An inner hole of up to 100 au in size has only a factor of ≤ 2 impact on any of the line fluxes. This parameter is only important if the disk is very small.
All Tables
All Figures
|
Fig. 1 Fluxes and upper limits (at 3σ confidence) from our APEX observations of the [C i] 1−0 and 2–1 and the CO 6−5 transitions. Large circles indicate sources with a detection on at least one axis. Empty symbols mark sources for which only the [C i] 1−0 line was observed. CO 6−5 and [C i] 2−1 were always observed in parallel. Colours show the stellar effective temperature: late-type stars are red and early-type stars blue. The black line connects fiducial disk models from Sect. 4 for the stellar spectral type range of our observations (diamonds from red to blue, Teff∈ [4000,12 000] K in steps of 2000 K, assumed distance 140 pc). |
| In the text | |
|
Fig. 2 All observed spectra, rebinned to a resolution of 0.5 km s-1. From bottom to top in each panel, the spectra are CO 6−5 (red), [C i] 1−0 (blue) and [C i] 2−1 (black). The measured fluxes and noise levels are listed in Table 1. Vertical offsets of 1 K have been applied for clarity. |
| In the text | |
|
Fig. 3 [C i] 1−0 and CO 6−5 lines observed towards DM Tau (black) and typical offset positions (red; + 30′′,0′′ for [C i], + 18′′, + 6′′ for CO). The [C i] line towards the source is single-peaked and narrower than CO 6−5. The spectra are binned to 0.4 km s-1 per channel. |
| In the text | |
|
Fig. 4 Maps of the abundance (colour shading) and emission contribution (black lines) of the main gas-phase carbon reservoirs in a disk around a star with Teff = 10 000 K (left) and a Teff = 4000 K star with 0.1 L⊙ of UV excess (right). The solid black lines indicate areas containing 75% (thinner line) and 25% (thicker) of the emission. White lines show the vertical τ = 1 surface for the line (solid) and continuum (dashed) emission. |
| In the text | |
|
Fig. 5 Effect of model parameter variations on the line fluxes of carbon species in the disk atmosphere. Two central stars are considered: a 4000 K star with UV excess (red) and a pure 10 000 K photosphere (blue). Horizontal bars show the range of variation resulting from the parameter values given in Table 4. The fiducial model (black vertical line) is a disk with Rc = 50 au and with [C]/[H]gas = 1.35 × 10⁻⁴, and the reference fluxes for the 4000 K models are, from left to right, 9.6 × 10⁻¹⁹, 9.0 × 10⁻²⁰, 2.2 × 10⁻¹⁹ and 3.4 × 10⁻¹⁸W m-2; for 10 000 K they are 4.6 × 10⁻¹⁸, 2.6 × 10⁻¹⁹, 1.1 × 10⁻¹⁸ and 3.1 × 10⁻¹⁷W m-2. |
| In the text | |
|
Fig. 6 APEX observations (circles, triangles) and DALI full disk models (diamonds) of the CO 6−5 (top), [C i] 1−0, [C i] 2−1, and [C ii] 158 μm (bottom) transitions. All values are colour-coded for the stellar Teff; T Tauri stars are red and Herbig Ae/Be stars blue. The fluxes are plotted with stellar Teff values in the upper subpanels (with [C]/[H]gas= 1.35 × 10⁻⁴ and Rc = 50 au fixed for the fiducial model), and with the gas-phase total elemental carbon abundance, [C]/[H]gas, in the lower subpanels (solid lines connect models with Rc = 50 au, dashed lines Rc = 10 au). Horizontal lines in the lower subpanels show the flux changes from varying the gas-to-dust ratio by a factor of ten around the fiducial T Tauri and Herbig Ae/Be models. |
| In the text | |
|
Fig. A.1 Gas density structure of the fiducial disk model. |
| In the text | |
|
Fig. A.2 Fiducial disk models for a Teff10000 K star (Herbig Ae/Be, left column) and a Teff4000 K star with an ultraviolet excess (representing T Tauri disks, right column). From top to bottom, the panels show the gas temperature, dust temperature, and the ultraviolet field in standard interstellar field units G0. |
| In the text | |
Current usage metrics show cumulative count of Article Views (full-text article views including HTML views, PDF and ePub downloads, according to the available data) and Abstracts Views on Vision4Press platform.
Data correspond to usage on the plateform after 2015. The current usage metrics is available 48-96 hours after online publication and is updated daily on week days.
Initial download of the metrics may take a while.