Free Access
Fig. 2
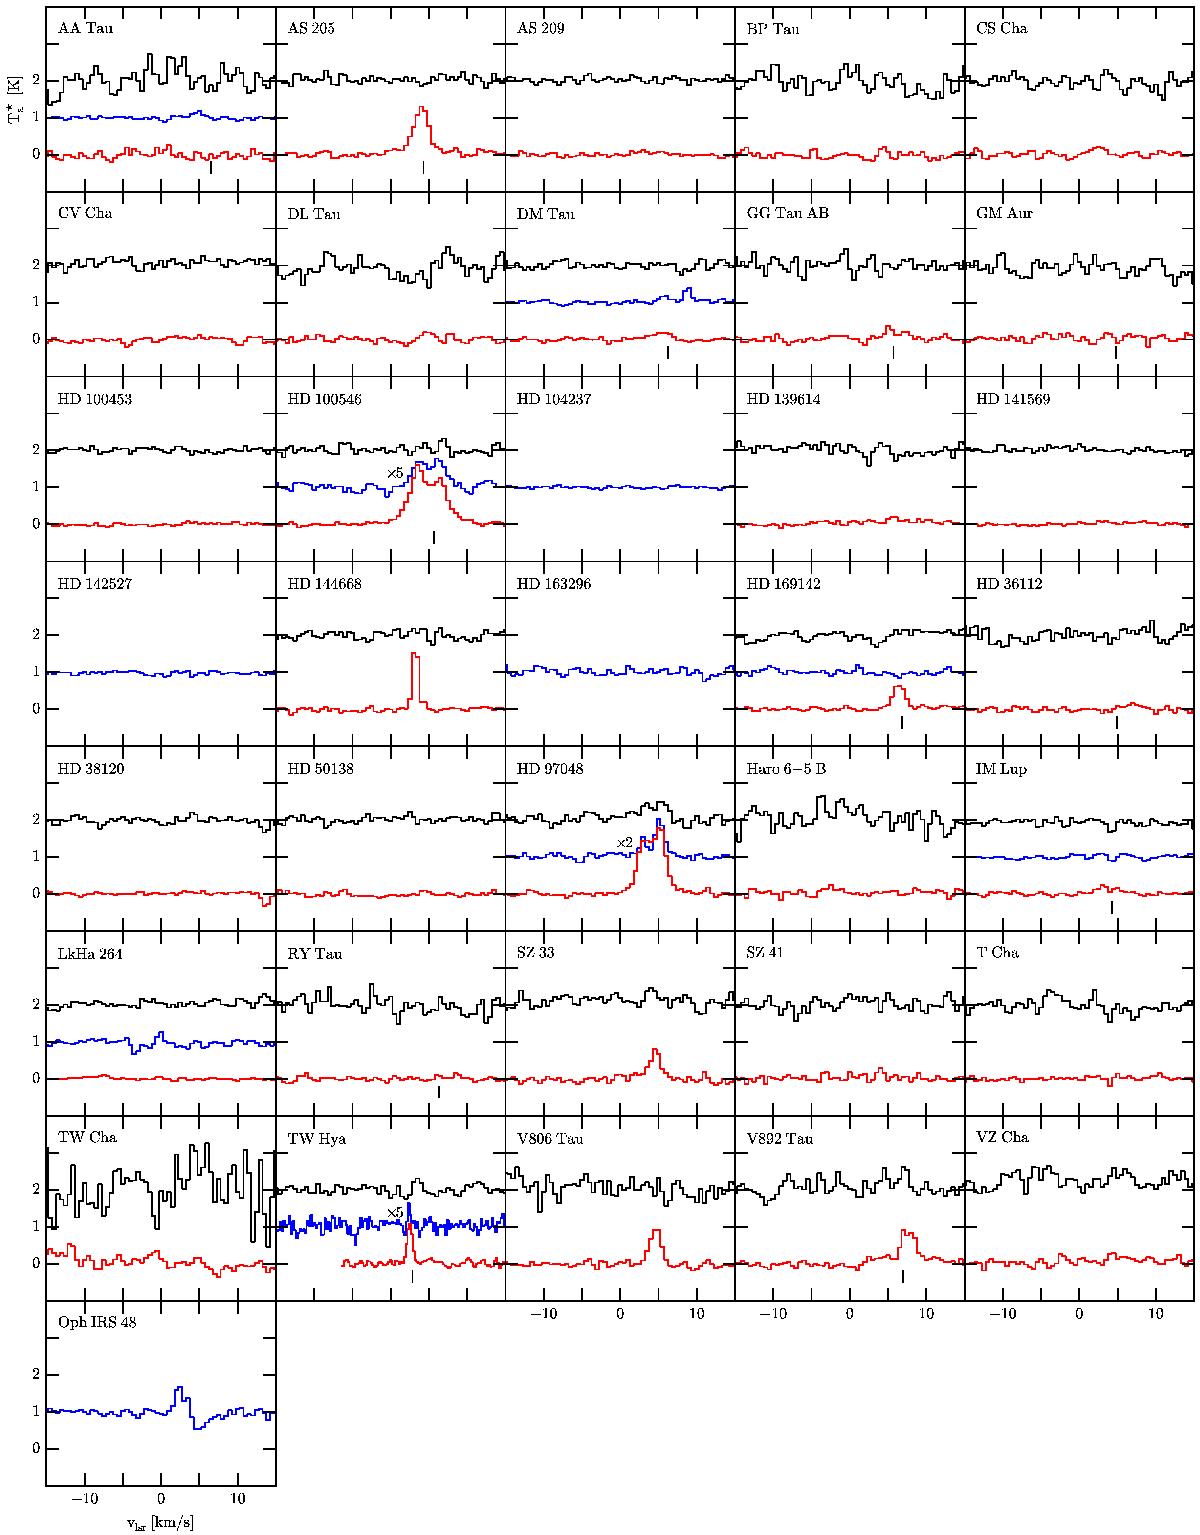
All observed spectra, rebinned to a resolution of 0.5 km s-1. From bottom to top in each panel, the spectra are CO 6−5 (red), [C i] 1−0 (blue) and [C i] 2−1 (black). The measured fluxes and noise levels are listed in Table 1. Vertical offsets of 1 K have been applied for clarity.
Current usage metrics show cumulative count of Article Views (full-text article views including HTML views, PDF and ePub downloads, according to the available data) and Abstracts Views on Vision4Press platform.
Data correspond to usage on the plateform after 2015. The current usage metrics is available 48-96 hours after online publication and is updated daily on week days.
Initial download of the metrics may take a while.