Fig. 6
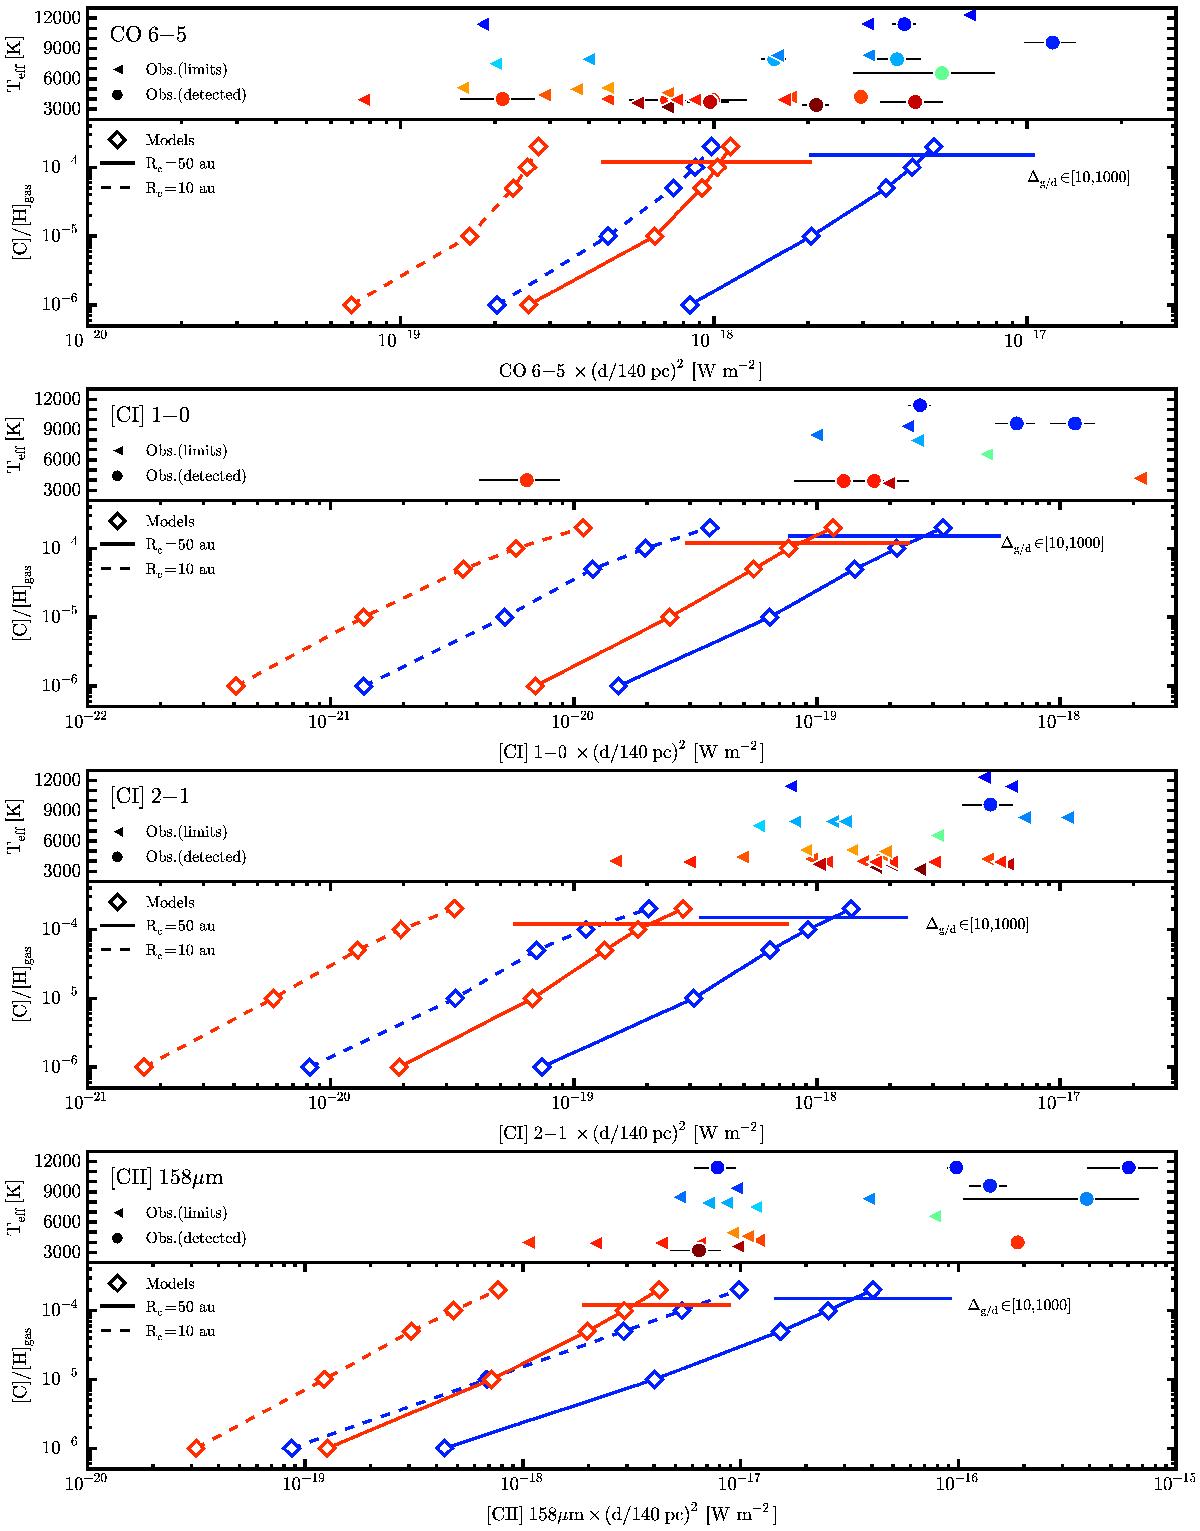
APEX observations (circles, triangles) and DALI full disk models (diamonds) of the CO 6−5 (top), [C i] 1−0, [C i] 2−1, and [C ii] 158 μm (bottom) transitions. All values are colour-coded for the stellar Teff; T Tauri stars are red and Herbig Ae/Be stars blue. The fluxes are plotted with stellar Teff values in the upper subpanels (with [C]/[H]gas= 1.35 × 10⁻⁴ and Rc = 50 au fixed for the fiducial model), and with the gas-phase total elemental carbon abundance, [C]/[H]gas, in the lower subpanels (solid lines connect models with Rc = 50 au, dashed lines Rc = 10 au). Horizontal lines in the lower subpanels show the flux changes from varying the gas-to-dust ratio by a factor of ten around the fiducial T Tauri and Herbig Ae/Be models.
Current usage metrics show cumulative count of Article Views (full-text article views including HTML views, PDF and ePub downloads, according to the available data) and Abstracts Views on Vision4Press platform.
Data correspond to usage on the plateform after 2015. The current usage metrics is available 48-96 hours after online publication and is updated daily on week days.
Initial download of the metrics may take a while.