| Issue |
A&A
Volume 586, February 2016
|
|
|---|---|---|
| Article Number | A127 | |
| Number of page(s) | 8 | |
| Section | Interstellar and circumstellar matter | |
| DOI | https://doi.org/10.1051/0004-6361/201527579 | |
| Published online | 05 February 2016 | |
Reconstructing the history of water ice formation from HDO/H2O and D2O/HDO ratios in protostellar cores
1 Leiden Observatory, Leiden University, PO Box 9513, 2300 RA Leiden, The Netherlands
e-mail: This email address is being protected from spambots. You need JavaScript enabled to view it.
2 Max-Planck-Institut für Extraterrestrische Physik, Giessenbachstrasse, 85741 Garching, Germany
3 Center for Computer Sciences, University of Tsukuba, 305-8577 Tsukuba, Japan
Received: 16 October 2015
Accepted: 11 December 2015
Abstract
Recent interferometer observations have found that the D2O/HDO abundance ratio is higher than that of HDO/H2O by about one order of magnitude in the vicinity of low-mass protostar NGC 1333–IRAS 2A, where water ice has sublimated. Previous laboratory and theoretical studies show that the D2O/HDO ice ratio should be lower than the HDO/H2O ice ratio, if HDO and D2O ices are formed simultaneously with H2O ice. In this work, we propose that the observed feature, D2O/HDO > HDO/H2O, is a natural consequence of chemical evolution in the early cold stages of low-mass star formation as follows: 1) majority of oxygen is locked up in water ice and other molecules in molecular clouds, where water deuteration is not efficient; and 2) water ice formation continues with much reduced efficiency in cold prestellar/protostellar cores, where deuteration processes are highly enhanced as a result of the drop of the ortho-para ratio of H2, the weaker UV radiation field, etc. Using a simple analytical model and gas-ice astrochemical simulations, which traces the evolution from the formation of molecular clouds to protostellar cores, we show that the proposed scenario can quantitatively explain the observed HDO/H2O and D2O/HDO ratios. We also find that the majority of HDO and D2O ices are likely formed in cold prestellar/protostellar cores rather than in molecular clouds, where the majority of H2O ice is formed. This work demonstrates the power of the combination of the HDO/H2O and D2O/HDO ratios as a tool to reveal the past history of water ice formation in the early cold stages of star formation, and when the enrichment of deuterium in the bulk of water occurred. Further observations are needed to explore if the relation, D2O/HDO > HDO/H2O, is common in low-mass protostellar sources.
Key words: astrochemistry / ISM: molecules / ISM: clouds / stars: protostars
© ESO, 2016
1. Introduction
The degree of deuterium fractionation in molecules in general, and that of water in particular, depends on its formation environments. This characteristic enables us to gain insights into the water trail from its formation in molecular clouds to, ultimately, the delivery to planets by comparing the deuterium fractionation in objects at different evolutionary stages (e.g., recent reviews by Ceccarelli et al. 2014; van Dishoeck et al. 2014).
It is well established that water is formed on grain surfaces in molecule clouds. At dust temperatures lower than 100–150 K, water is predominantly present on the surfaces of dust grains as ice (Fraser et al. 2001). There has been no clear detection of HDO ice in the interstellar medium (ISM), and the deuteration of water ice is not well-constrained (HDO/H2O < (2−5) × 10-3; Dartois et al. 2003; Parise et al. 2003). Instead, there have been numerous observational studies on the deuteration of water vapor, which may reflect that of water ice through thermal and non-thermal desorption of ice.
In particular, recent interferometer and single-dish observations have quantified the degree of deuteration of water vapor in four low-mass protostellar sources, IRAS 16293-2422, NGC 1333–IRAS 2A, IRAS 4A, and IRAS 4B (Jørgensen & van Dishoeck 2010; Liu et al. 2011; Coutens et al. 2012, 2013, 2014; Persson et al. 2013, 2014; Taquet et al. 2013). The interferometer observations provide the emission from the inner hot regions (T > 100 K), where water ice is sublimated, while the single-dish observations, including the Herschel Space Observatory, provide the integrated emission from larger spacial scales (Jørgensen & van Dishoeck 2010; Coutens et al. 2012). The combination of the two types of the observations have revealed that 1) the gaseous HDO/H2O ratio in the inner hot regions (~10-3) is lower than that in the cold outer envelopes by more than one order of magnitude; and 2) the gaseous D2O/HDO ratio is much higher than the HDO/H2O ratio (~10-2 versus ~10-3) in the inner hot regions of NGC 1333–IRAS 2A (Coutens et al. 2014) and at least one other source (A. Coutens, priv. comm.).
Water deuteration in low-mass protostellar sources has also been studied using physical and astrochemical models (e.g., recent work by Aikawa et al. 2012; Taquet et al. 2014; Wakelam et al. 2014). These studies adopt one-dimensional gravitational collapse models, which describe the physical evolution of collapsing prestellar cores to protostellar sources, with detailed gas-ice chemical networks. The models successfully reproduce observed feature #1, the radial gradient of the HDO/H2O ratio, by gas-phase ion-neutral chemistry in the outer cold regions and sublimation of ice in the inner hot regions. The models, however, tend to overpredict the HDO/H2O ratio in the inner hot regions by a factor of several or more compared to the observations. Furthermore, in contrast to the observed feature #2, all models predict that the gaseous D2O/HDO ratio in the inner hot regions is lower than or comparable to the HDO/H2O ratio. Coutens et al. (2014) have proposed that, either there is something missing in the current understanding of deuterium chemistry on icy grain surfaces, or that water formation at high temperatures (Tgas> 200–300 K) through reactions O + H2→ OH + H and OH + H2→ H2O + H play a role in the inner quiescent regions, following sublimation of ice. In the latter case, the D2O/HDO ratio reflects that in ice, while the HDO/H2O ratio is diluted by the additional formation of H2O vapor, so that the D2O/HDO ratio can be higher than the HDO/H2O ratio. However, it requires that a large amount of oxygen is in atomic form rather than in molecules in the high density inner regions.
In this paper, we propose an alternative scenario that can account for the higher D2O/HDO ratio compared with HDO/H2O by the combination of cold deuterium chemistry and sublimation of ice without the need for the enhanced H2O formation in hot gas. This paper is organized as follows. In Sect. 2, the proposed scenario is presented through a simple analytical model. In Sect. 3, we simulate the gas-ice chemical evolution in star-forming cores with a numerical model to verify the scenario. We briefly discuss molecular oxygen and the ortho-to-para ratio of H2, the deuteration of methanol, and thermally induced H–D exchange reactions in ice in Sect. 4. Our findings are summarized in Sect. 5.
2. Scenario
We assume that both the HDO/H2O and D2O/HDO gas ratios in the inner hot regions around protostars reflect those in ice. In this subsection we denote the HDO/H2O ratio as fD1, while we denote the D2O/HDO ratio as fD2.
We first note that previous laboratory and theoretical studies show that fD2 should be lower than fD1, if H2O, HDO, and D2O ices are formed via grain surface reactions at the same time. Let us assume that they all are formed via sequential reactions of atomic hydrogen/deuterium with atomic oxygen. These reactions have no activation energy barrier (Allen & Robinson 1977). If the surface reactions distribute deuterium statistically (or, in other words, mass-independently), the following relation holds (Rodgers & Charnley 2002): ![Mathematical equation: \begin{equation} [f_{\rm D2}/f_{\rm D1}]_{\rm statistic} = 0.25. \label{eq:f1f2_statistic} \end{equation}](/articles/aa/full_html/2016/02/aa27579-15/aa27579-15-eq18.png) (1)Laboratory experiments have demonstrated that there are other formation pathways of water ice: sequential surface reactions initiated by reactions of O2/O3 with atomic hydrogen (Ioppolo et al. 2008; Miyauchi et al. 2008; Mokrane et al. 2009), and the reaction OH + H2→ H2O + H (Oba et al. 2012). These pathways include reactions with activation energy barriers, and thus proceed through quantum tunneling (Oba et al. 2012, 2014). The barrier-mediated reactions favor hydrogenation over deuteration, because deuterium is twice heavier than hydrogen (Oba et al. 2014). In addition, once water is formed, it does not efficiently react with atomic deuterium to be deuterated at low temperatures, unlike formaldehyde and methanol (Nagaoka et al. 2005). At warm temperatures (>70 K), H–D exchange reaction, H2O + D2O → 2HDO, is thermally activated, and the fD2/fD1 ratio can be lowered (e.g., Lamberts et al. 2015, see also Sect. 4.3). Taken together, 0.25 is the upper limit of the fD2/fD1 ratio.
(1)Laboratory experiments have demonstrated that there are other formation pathways of water ice: sequential surface reactions initiated by reactions of O2/O3 with atomic hydrogen (Ioppolo et al. 2008; Miyauchi et al. 2008; Mokrane et al. 2009), and the reaction OH + H2→ H2O + H (Oba et al. 2012). These pathways include reactions with activation energy barriers, and thus proceed through quantum tunneling (Oba et al. 2012, 2014). The barrier-mediated reactions favor hydrogenation over deuteration, because deuterium is twice heavier than hydrogen (Oba et al. 2014). In addition, once water is formed, it does not efficiently react with atomic deuterium to be deuterated at low temperatures, unlike formaldehyde and methanol (Nagaoka et al. 2005). At warm temperatures (>70 K), H–D exchange reaction, H2O + D2O → 2HDO, is thermally activated, and the fD2/fD1 ratio can be lowered (e.g., Lamberts et al. 2015, see also Sect. 4.3). Taken together, 0.25 is the upper limit of the fD2/fD1 ratio.
The above constraint, fD2/fD1 ≤ 0.25, can be directly applied to the compositions of ice in the ISM, if H2O, HDO, and D2O ices are predominantly formed simultaneously (Butner et al. 2007). However, in the sequence of star formation, they are not necessarily formed at the same evolutionary stage (Dartois et al. 2003). The onset of the water ice mantle formation requires a threshold extinction, above which the photodesorption rate of water ice is lower than the formation rate of water ice and its precursors (e.g., Tielens 2005). The H2O ice-formation rate decreases with time since elemental oxygen is locked into O-bearing molecules. Later, in the evolution, at higher extinction and densities, CO freezes out and the products of its hydrogenation, such as formaldehyde (H2CO) and methanol (CH3OH), are thought to be the main constituent of the outer layers of the ice mantle (e.g., Pontoppidan 2006; Öberg et al. 2011). On the other hand, the formation rates of HDO and D2O ices do not necessarily decrease together with that of H2O ice; deuterium fractionation is more efficient at later times, as CO is frozen out, the ortho-to-para nuclear spin ratio of H2 (OPR(H2)) decreases, and interstellar UV radiation is heavily shielded (e.g., Caselli & Ceccarelli 2012, and references therein).
Infrared observations show that H2O ice starts to become abundant in molecular clouds above a threshold line-of-sight visual extinction, depending on environments, e.g., ~3 mag for Taurus dark clouds (Whittet 1993; Boogert et al. 2015, and references therein). The scenario we propose is that, in contrast to H2O ice, HDO and D2O ices are mainly formed at the later stages of star formation, i.e., in cold prestellar and protostellar cores, where deuterium fractionation processes would be more efficient than in ambient molecular clouds. Then, taking the layered structure of ice mantles into consideration, HDO and D2O are mainly present in the CO/CH3OH-rich outer layers, rather than in the H2O-dominated inner layers. Assuming complete sublimation of the ice mantles in the inner hot regions of low-mass protostars, the gaseous D2O/HDO ratio directly reflects that in the outer layers of the ice mantles, while the gaseous HDO/H2O ratio is much lower than that in the outer layers because of the dilution by the abundant H2O in the inner layers. Thus, the gaseous D2O/HDO ratio can be higher than the HDO/H2O ratio in the vicinity of protostars. A schematic view of the layered ice structure in our scenario is shown in Fig. 1. Our scenario is essentially similar to that proposed by Dartois et al. (2003) for HDO enhancement. They suggest that water ice is formed without deuterium enrichment, followed by the additional water formation with high levels of deuterium fractionation at later times. The motivation behind their scenario was to explain the upper limits of the icy HDO/H2O ratio in the cold outer envelope of protostars, which are lower than the D/H ratios of other gaseous species.
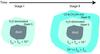 |
Fig. 1 Schematic view of our scenario and the layered ice structure. Stage I) The main formation stage of H2O ice. Water deuteration is not efficient, fD2< fD1 < 10-3. The majority of oxygen is locked in O-bearing molecules in this stage. Stage II) CO/CH3OH-rich outer ice layers are formed, while the formation of water ice continues with much reduced efficiency, compared to Stage I. Nevertheless, the formation of HDO and D2O ices is more efficient than in Stage I, owing to the enhanced deuteration processes, 10-3 ≪ fD2<fD1. |
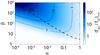 |
Fig. 2 [fD2/fD1] I + II ratio as a function of α (=NO, II/NO, I) and β (=PHDO, II/PHDO, I) in the two stage model given by Eq. (4) with q = 0.25. Above the dashed line (αβ ≳ 1), [fD1] I + II is larger than [fD1] I by a factor of two or more. See the text for more information. |
To get a rough idea of how high the fD2/fD1 ratio can be in our scenario and to investigate the critical parameters, let us consider a two-stage model (or a two-layer ice model). We denote the total amount of oxygen locked into H2O, HDO, or D2O ices at each stage (or in each layer) k, where k = I or II, as NO,k. We denote the fraction of oxygen locked into X2O ice, where X is H or D, as PX2O,k. Then, PX2O,kNO,k represents the amount of X2O ice formed in the stage k. We can express fD1 and fD2 in the bulk of the ice mantle as follows: ![Mathematical equation: \begin{eqnarray} &&[f_{\rm D1}]_{\rm I+II} = \sum_{k\,=\,{\rm I,\,II}}\prob{HDO}{k}\fr{O}{k}\bigg/ \sum_{k\,=\,{\rm I,\,II}}\prob{H_2O}{k}\fr{O}{k}, \\ &&[f_{\rm D2}]_{\rm I+II} = \sum_{k\,=\,{\rm I,\,II}}\prob{D_2O}{k}\fr{O}{k} \bigg/ \sum_{k\,=\,{\rm I,\,II}}\prob{HDO}{k}\fr{O}{k}. \end{eqnarray}](/articles/aa/full_html/2016/02/aa27579-15/aa27579-15-eq41.png) It would be reasonable to assume PH2O,k ~ 1. Motivated by Eq. (1), we introduce a free parameter q as PD2O,k/PHDO,k = qPHDO,k/PH2O,k in the range of 0 < q ≤ 0.25. When q = 0.25, deuterium is statistically distributed, i.e., the most optimistic case to obtain a high fD2/fD1. Although q can vary between the two stages, we assume it is constant for simplicity. With those relations, the fD2/fD1 ratio in the bulk of the ice mantle is expressed as
It would be reasonable to assume PH2O,k ~ 1. Motivated by Eq. (1), we introduce a free parameter q as PD2O,k/PHDO,k = qPHDO,k/PH2O,k in the range of 0 < q ≤ 0.25. When q = 0.25, deuterium is statistically distributed, i.e., the most optimistic case to obtain a high fD2/fD1. Although q can vary between the two stages, we assume it is constant for simplicity. With those relations, the fD2/fD1 ratio in the bulk of the ice mantle is expressed as ![Mathematical equation: \begin{eqnarray} \left[\frac{f_{\rm D2}}{f_{\rm D1}} \right]_{\rm I+II} \approx \frac{q(1+\alpha)(1+\alpha \beta^2)}{(1+\alpha\beta)^2}, \label{eq:f2_f1_final} \end{eqnarray}](/articles/aa/full_html/2016/02/aa27579-15/aa27579-15-eq46.png) (4)where α is NO, II/NO, I and β is PHDO, II/PHDO, I. Figure 2 shows [fD2/fD1] I + II as a function of α and β with q = 0.25. It shows that the proposed scenario can lead to [fD2/fD1] I + II ≫ 1. The conditions to reproduce the observed values in NGC 1333–IRAS 2A, HDO/H2O ~ 10-3 and (D2O/HDO)/(HDO/H2O) ~ 10, are that 1) most of water ice is formed with HDO/H2O < 10-3 and that 2) an additional small amount (α < 0.1) of highly fractionated (β ≳ 100) water ice is formed at later times.
(4)where α is NO, II/NO, I and β is PHDO, II/PHDO, I. Figure 2 shows [fD2/fD1] I + II as a function of α and β with q = 0.25. It shows that the proposed scenario can lead to [fD2/fD1] I + II ≫ 1. The conditions to reproduce the observed values in NGC 1333–IRAS 2A, HDO/H2O ~ 10-3 and (D2O/HDO)/(HDO/H2O) ~ 10, are that 1) most of water ice is formed with HDO/H2O < 10-3 and that 2) an additional small amount (α < 0.1) of highly fractionated (β ≳ 100) water ice is formed at later times.
Furuya et al. (2015, hereafter Paper I) studied the chemical evolution from H i dominated clouds to denser molecular clouds, following the scenario that H i-dominated gas is swept up and accumulated by global accretion flows (e.g., Hartmann et al. 2001; Inoue & Inutsuka 2012). Their primary goal was to investigate the evolution of the OPR(H2) and the HDO/H2O ratio without an arbitrary assumption that concerns the initial OPR(H2). It was found that the HDO/H2O ratio in the bulk ice can be much lower than 10-3 at the end of the main formation stage of H2O ice, i.e., condition #1 can be satisfied. In the following, we conduct the gas-ice chemical simulations of collapsing prestellar cores to the formation of protostars to explore if condition #2 is fulfilled.
Based on the two stage model, we find that there are two regimes at the same [fD2/fD1] I + II. Above the dashed line of Fig. 2, where αβ ≳ 1, the difference between [fD1] I + II and [fD1] I is more than a factor of two, i.e., the HDO/H2O ratio that is established at the main formation stage of H2O ice is mostly hidden by water ice additionally formed at later times. Below the dashed line, on the other hand, [fD1] I + II and [fD1] I are similar. The former corresponds exactly to our scenario, where HDO and D2O ices are predominantly formed after the main formation stage of H2O ice. The latter is the case where H2O and HDO ices are formed together, while D2O ice is mainly formed after the main formation stage of H2O and HDO ices. For the same [fD2/fD1] I + II, the latter case requires more significant freeze out of oxygen, especially atomic oxygen and CO; water ice can be formed from CO gas through CO + He+ → C+ + O. Which regime is more likely in the ISM, or in other words, does the HDO/H2O ratio in the hot gas directly reflect the HDO/H2O ice ratio at the main formation stage of H2O ice? Numerical simulations are needed to answer this question.
3. Numerical simulation
3.1. Model description
Initial abundances of selected species with respect to hydrogen nuclei.
We simulate water deuteration from a prestellar core to a protostellar core adopting one-dimensional radiation hydrodynamics simulations of Masunaga & Inutsuka (2000). Initially the core has an isothermal hydrostatic structure with a fixed outer boundary of 4 × 10⁴ AU from the core center. The total mass of the core is 3.9 M⊙, which is greater than the critical mass for gravitational instability. The protostar is born at 2.5 × 10⁵ yr after the beginning of the collapse, corresponding to 1.4tff, where tff is the free-fall time of the initial central density of hydrogen nuclei ~6 × 104 cm-3. After the birth of the protostar, the model further follows the physical evolution for 9.3 × 10⁴ yr.
Fluid parcels are traced in the hydrodynamics simulation, and we perform gas-ice chemical simulations along the stream lines to obtain the radial distribution of molecules in the protostellar envelope. This approach is the same as Aikawa et al. (2012). For simplicity, we set the temperature as 10 K when the temperature in the original data is lower than 10 K. We adopt a rate equation method and the chemistry is described by a three-phase model, which consists of gas, a chemically active icy surface, and inert ice mantles (Hasegawa & Herbst 1993b). The top four monolayers of ice mantles are assumed to be chemically active, following Vasyunin & Herbst (2013). We refer to all of the layers including both the ice surface and the inert ice mantle as the bulk ice mantle. We take into account gas-phase reactions, interaction between gas and (icy) grain surface, and surface reactions. For non-thermal desorption processes, we consider stochastic heating by cosmic-rays (Hasegawa & Herbst 1993a), photodesorption (Westley et al. 1995), and chemical desorption (Garrod et al. 2007). Our chemical reaction network is originally based on Garrod & Herbst (2006). The network has been extended to include high-temperature gas-phase reactions from Harada et al. (2010), mono, doubly, and triply deuterated species (Aikawa et al. 2012; Furuya et al. 2013), and nuclear spin states of H2, H , and their isotopologues (Hincelin et al. 2014). The rate coefficients for the H2 + H system are taken from Hugo et al. (2009). More details can be found in Paper I.
We consider six sets of the initial abundances for the collapse model, which are summarized in Table 1. In the sets labeled “MC”, the molecular abundances are adopted from Paper I. In Paper I, a one-dimensional shock model (Bergin et al. 2004; Hassel et al. 2010) was used to study the chemical evolution during the formation and growth of a molecular cloud via the accumulation of H i gas. Note that the evolution of the molecular cloud is dominated by ram pressure that is due to the accretion flow rather than self-gravity, which is in contrast with our collapse model. The time it takes for the column density of the cloud to reach AV = 1 mag is ~4 Myr (AV/1 mag)(n0/10 cm-3)-1 (v0/15 km s-1)-1, where n0 and v0 are the preshock H i gas density and velocity of the accretion flow, respectively. The density and temperature of the molecular cloud are ~104 cm-3 and 10–15 K, respectively. We adopt the abundances when the column density of the molecular cloud reaches 1 mag (MC1), 2 mag (MC2), or 3 mag (MC3). In all three sets, H2O ice is abundant (x(H2Oice) ~ 10-4, where x(i) is the abundance of species i with respect to hydrogen nuclei) and the HDO/H2O ice ratio is ~10-4. On the other hand, the abundances of atomic oxygen and CO in the gas phase and the OPR(H2) vary by orders of magnitude among the three sets; all three values decrease with the increasing column density of the cloud. H2 rather than CO is the key regulator of deuterium chemistry driven by  , as long as OPR(H2) /x(CO) ≳ 40 at temperatures of ≲20 K (Paper I). This condition is fulfilled in all three sets. The parameters α and β,as discussed in Sect. 2, are related to (x(CO) + x(O i)) and the OPR(H2), respectively. In MC3, CO is largely frozen out, and its gas-phase abundance is only 5 × 10⁻⁶. The observations of CO isotopologues toward the low-mass prestellar cores have found that the CO abundance in the gas phase is lower than the canonical value, ~10-4, by a factor of around 10 (e.g., Crapsi et al. 2005). Then, the level of CO freeze-out in MC3 is similar to that measured in prestellar cores. Although the physical parameters vary continuously as a function of time in our numerical simulation, it can be considered as a two-stage model, since we connect the two different physical models, i.e., cloud formation and core collapse.
In previous studies of deuterium chemistry in collapsing cores, species were initially assumed to be in atomic form, except for H2 and HD (e.g., Aikawa et al. 2012). For comparisons, we also perform chemical calculations in the collapsing core in which species are initially in atomic form except for H2 and HD with the initial OPR(H2) of 10-1 (AT1), 10-2 (AT2), or 10-4 (AT4).
The visual extinction at the outer edge of the core is set to be 5 mag, being irradiated by the Draine field (Draine 1978). Paper I found that water ice deuteration can be significantly suppressed by interstellar UV radiation through the cycle of photodissociation and reformation of water ice, which efficiently removes deuterium from water ice chemistry. In this paper, our focus is placed on the water deuteration in the well-shielded regions. The cosmic-ray ionization rate of H2 is set to be 1.3 × 10⁻¹⁷ s-1, while the flux of FUV photons that is induced by cosmic-rays is set to be 3 × 103 cm-2 s-1. In these settings, photochemistry is not important for water ice.
Before the onset of the collapse, we assume that the prestellar core keeps its hydrostatic structure for some time. We consider three cases in which the elapsed time before the onset of the collapse is 0 yr (labeled “A”), 106 yr (corresponding to 5.6tff, labeled “B”), or 3 × 10⁶ yr (16tff, “C”). Our fiducial model is MC2B; i.e., the initial molecular abundance is set by the cloud-formation model at the epoch when the column density reaches 2 mag, and the duration of the static prestellar phase is 106 yr.
3.2. Results
3.2.1. Fiducial model
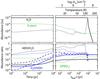 |
Fig. 3 Temporal variations of molecular abundances (top) and abundance ratios (bottom) in the static phase (left) and during the collapse (right) in model MC2B in the fluid parcel, which reaches R = 5 AU at the final time of the simulation. Before the collapse begins, the temperature is 10 K and the number density of hydrogen nuclei (nH) is 2.3 × 104 cm-3. The horizontal axis of the right panels is set to be tfinal−t, where tfinal represents the final time of the simulation and t = 0 corresponds to the onset of the collapse. The solid lines, the dashed lines, and the dotted lines represent molecules in the bulk ice mantle, molecules in the surface ice layers, and gaseous molecules, respectively. |
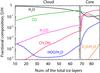 |
Fig. 4 Fractional composition and D/H ratios in the surface ice layers as functions of the total number of icy layers in model MC2B. The left panel represents the formation stage of a molecular cloud taken from Paper I, while the right panel represents the static and collapse stages at tfinal−t< 8.3 × 10⁴ yr, where dust temperature is 10 K, in the same fluid parcel shown in Fig. 3. The visual extinction for calculating photochemical rates increases from 2 mag at the end of the cloud formation stage to 5 mag at the prestellar core stage. The sudden increase leads to the sharp change of the fractional composition especially of H2CO and CH3OH in the surface ice layers. |
Figure 3 shows the temporal variation of molecular abundances and abundance ratios in the fiducial model (MC2B) along the stream line of a fluid parcel. The fluid parcel is initially at 104 AU from the core center and finally reaches 5 AU. Figure 4 shows the fractional composition and the D/H ratios in the active surface ice layers in the fluid parcel as a function of the number of ice layers in total. We note that surface layers become part of the inert ice mantle with the growth of ice. Initially, most oxygen is locked up in CO and water ice with bulk ice ratios of HDO/H2O and D2O/HDO of ~10-4. In the static phase and during the collapse at T< 20 K, the environment is favorable for deuteration: the low temperature, 10–20 K, and the relatively low OPR(H2), ~10-3, and the weak UV radiation field. During those periods, corresponding to layers ~70–90 in Fig. 4, a small amount of additional water ice (the total abundance of ~5 × 10⁻⁶) is formed with HDO/H2O > D2O/HDO ≳ 10-2. The source of oxygen for the formation of the water ice is gaseous atomic oxygen and CO. The additional water ice formation increases the concentrations of HDO and D2O in the outer layers of the ice mantle, where CO and methanol are abundant, as shown in Fig. 4. The D2O/HDO ratio in the bulk ice becomes similar to that in the surface layers with time, while the HDO/H2O ratio in the bulk ice remains much lower than that in the surface layers owing to the abundant H2O in the inert ice mantle. The D2O/HDO ratio in the bulk ice becomes larger than the HDO/H2O ratio in 105 yr in the static phase.
The top panel of Fig. 5 shows radial profiles of the abundances of H2O, HDO, and D2O at 9.3 × 10⁴ yr after the protostellar birth, while the lower panel shows radial profiles of the HDO/H2O and D2O/HDO ratios. The water sublimation radius, where the dust temperature is ~150 K, is located at around 60 AU from the protostar; water is mostly in the gas phase in the inner regions, while it predominantly exists as ice in the outer regions (Aikawa et al. 2012). At the water sublimation radius, both the gaseous HDO/H2O and D2O/HDO ratios drop via sublimation of ice. At T ≳ 150 K, the gaseous ratios directly reflect those in the bulk ice. At T ≲ 150 K, the gaseous ratios are determined by ion-neutral chemistry in the gas phase; photodesorption is less important than the ion-neutral reactions because of the weak UV radiation field that is dominated by the cosmic-ray-induced UV. We confirmed that the gaseous HDO/H2O and D2O/HDO ratios in the outer regions do not reflect either those in the bulk ice or those in the surface layers. The model predicts HDO/H2O ~ 10-3 and D2O/HDO ~ 10-2 at T ≳ 150 K, which agree with the values measured in NGC 1333–IRAS 2A (Coutens et al. 2014). Our simulations demonstrate that the combination of cold deuterium chemistry and sublimation of ice can account for observed features #1 and #2, i.e., the radial gradient of the gaseous HDO/H2O ratio and the higher D2O/HDO than HDO/H2O ratios in the inner hot regions, simultaneously.
In the fiducial model, the HDO/H2O gas ratio at T> 150 K is higher than the initial HDO/H2O ice ratio by a factor of 11. We denote this enhancement factor as εD1. The initial HDO/H2O ice ratio is mostly overshadowed by the small amount of highly fractionated water ice formed in the core. To check the dependence of the result on the initial HDO/H2O ice ratio, we also run another two models, in which the initial HDO/H2O ice ratio is artificially set to be 10-5 (MC2B-L) and 10-3 (MC2B-H), respectively. Other details are the same as in the fiducial model. In models MC2B-L and MC2B-H, εD1 are 120 and 2, respectively. The differences in the HDO/H2O ratios, on the other hand, at T> 150 K among the three models MC2B, MC2B-L, and MC2B-H are within a factor of two, in spite of the difference in the initial HDO/H2O ice ratio by two orders of magnitude. Again it means that the initial HDO/H2O ice ratios are mostly overshadowed.
In our models, the main formation pathways of H2O and HDO ices at T< 20 K are the surface reactions, OH + H2→ H2O + H and OD + H2→ HDO + H, respectively. Unexpectedly D2O ice is formed via ion-neutral reactions in the gas phase, followed by freeze-out, instead of surface reactions. To check whether our results depend on the main formation pathways of water ice, we reran the fiducial model without the reaction OH + H2 → H2O + H and its deuterated analogues. In this case, the main formation pathways of water ice are barrierless reactions of atomic hydrogen/deuterium with OH/OD. We confirmed that the HDO/H2O and D2O/HDO ratios at T> 150 K are similar to the fiducial case; both ratios are enhanced by only ~40%.
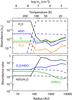 |
Fig. 5 Radial profile of the molecular abundances (upper panel) and the abundance ratios of the molecules (lower panel) in model MC2B at 9.3 × 10⁴ yr after the protostellar birth. The labels at the top represents the temperature and density structures. The solid lines represent gaseous molecules, while the dashed lines represent icy molecules in the bulk ice mantle. |
3.2.2. Grid of models
Table 2 summarizes the results from our grid of the models with variations in the initial abundances and the elapsed time before the onset of the collapse. In general, the models labeled MC predict a higher D2O/HDO ratio than HDO/H2O ratio at T> 150 K. Therefore, specific conditions are not necessary to reproduce the observed ratios in IRAS 2A. One exception is model MC1A, in which the initial OPR(H2) is high (~5 × 10⁻²) and the collapse begins immediately. The time required for the OPR(H2) to reach steady state is longer than the free-fall timescale (Flower et al. 2006); the OPR(H2) is higher than 10-2 during the simulation, which reduces the efficiency of the overall deuteration processes, and prevents the enrichment of deuterated water in ice.
The enhancement factor of the HDO/H2O ratio, εD1, is also listed in Table 2. In general, εD1 is larger than 2 in models labeled MC. Therefore, the HDO/H2O ice ratio that is established at the main formation phase of H2O ice is mostly hidden by the additional formation of highly deuterated water ice at later times.
The models labeled AT tend to predict lower D2O/HDO ratios than HDO/H2O ratios at T> 150 K, in agreement with previous numerical studies (e.g., Aikawa et al. 2012). In these models, the gradient of deuterium fractionation seems not to be large enough. This is because the initial OPR(H2), which is treated as a free parameter, controls the overall deuteration processes, again because the time required for the OPR(H2) to reach steady state is longer than the free-fall timescale and the freeze-out timescale, i.e., the formation timescale of ice (Flower et al. 2006; Taquet et al. 2014). We note that the steady state value of the OPR(H2) for the initial dense core condition is of the order of 10-4. With the low initial OPR(H2) of 10-4, deuterium fractionation is already efficient at the main formation stage of H2O ice while, with the high initial OPR(H2) of ≥10-2, the efficiency of the overall deuterium fractionation is reduced during the cold prestellar core phase. Among the models labeled AT, only models with a high initial OPR(H2) and a very long static phase (AT1C and AT2C) predict higher D2O/HDO than HDO/H2O ratios.
Summary of model results.
4. Discussion
4.1. O2 and ortho-para ratio of H2
In the simulations of the collapsing core, the critical parameters controlling the HDO/H2O and D2O/HDO ratios in the hot gas around protostars are the OPR(H2) and the amount of oxygen, i.e., atomic oxygen and CO, which is available for water ice formation. Here we briefly compare our model predictions with the observationally derived O2 abundance and OPR(H2) toward low-mass protostars. Although the abundance of atomic oxygen in the cold outer envelopes is hard to constrain via observations, we can partly verify the oxygen chemistry in our models by comparing the predicted O2 abundance with that derived from observations.
Yıldız et al. (2013) derived an upper limit of O2 gas abundance ≲10-8 toward NGC 1333–IRAS 4A, assuming a constant abundance in the envelope. Brünken et al. (2014) derived the OPR(H2D+) of ~0.1 in the cold outer envelope of IRAS 16293-2422, which corresponds to an OPR(H2) of 2 × 10⁻⁴ in their best fit model. In general, the models that predict a higher D2O/HDO than HDO/H2O ratio in the gas phase at T> 150 K reproduce the observations of O2 and OPR(H2) better than the other models. Our fiducial model, for example, is consistent with the upper limit of the O2 abundance and the OPR(H2) that is derived from the observations, as shown in Fig. 5 and Table 2. Unless a very long static phase (16tff) is assumed, the models labeled AT tend to overpredict the O2 abundance, implying that the majority of oxygen should be locked up in molecules such as water and CO before the prestellar core stage (Yıldız et al. 2013; Bergin et al. 2000).
In summary, our models labeled MC reproduce reasonably well the observations of the water deuterium fractionation, the O2 abundance, and the OPR(H2), simultaneously. This strengthens our scenario. However, these observed values are measured in different sources and it is unclear whether the higher D2O/HDO ratio compared with HDO/H2O, the low O2 abundance, and the low OPR(H2) are general chemical features of low-mass protostellar sources.
4.2. Water deuteration versus methanol deuteration
In the inner hot regions (T ≳ 100 K) of low-mass protostellar sources, formaldehyde, and methanol show higher levels of deuterium fractionation than water. For example, the CH3OD/CH3OH ratio (≳10-2; Parise et al. 2006) is much higher than the HDO/H2O ratio (~10-3; e.g., Persson et al. 2014). This difference is thought to reflect the different epoch of their formation, i.e., water ice is formed in an earlier stage of star formation than formaldehyde and methanol ices (Cazaux et al. 2011; Taquet et al. 2012). We note that the scenario implicitly assumes that H2O and HDO ices are formed at the same evolutionary stage.
In our scenario, H2O ice is mainly formed in molecular clouds, while HDO and D2O ices are mainly formed at later times when CO and methanol are the main constituent of the surface layers of the ice. In other words, H2O ice is formed at an earlier stage of star formation than deuterated water, formaldehyde, and methanol ices. This naturally leads to the following relation for the abundance ratios, CH3OD/CH3OH ~ D2O/HDO > H2O/HDO, simply because methanol and deuterated water are formed at the similar epoch. The CH3OD/CH3OH ratios at T> 150 K in our grid of models are presented in Table 2, along with the CH3OH/H2O ratios. Our fiducial model, for example, predicts CH3OD/CH3OH = 6 × 10⁻³, D2O/HDO = 1 × 10⁻², and HDO/H2O = 1 × 10⁻³, which agree reasonably well with the observations. Here we considered only the CH3OD/CH3OH ratio, since the ratio is determined by hydrogenation/deuteration of CO on an icy grain surface. Other species, such as HDCO and CH2DOH, are subject to the abstraction and substitution reactions (Watanabe & Kouchi 2008), and the situation is more complex (see Taquet et al. 2012, for a detailed discussion).
4.3. Thermally induced H–D exchange reactions
Laboratory experiments have shown that thermally activated H–D exchanges between hydrogen-bonded molecules in mixed ices occur efficiently at warm temperatures of ≳70 K (Ratajczak et al. 2009; Faure et al. 2015; Lamberts et al. 2015). This type of reaction is not included in our chemical network. In particular, for the present study, Lamberts et al. (2015) experimentally studied the thermally activated H–D exchange reactions,  (5)in mixed amorphous ices. In equilibrium, the ratio of the D2O/HDO ratio to the HDO/H2O ratio is given as k5b/k5f, where k5b and k5f are the reaction rate coefficient of Reaction (5) in the backward direction and the forward direction, respectively. Lamberts et al. found that the activation energy barrier of the forward reaction is 3840 ± 125 K, which is much smaller than the binding energy of water on a water substrate, 5700 K (Fraser et al. 2001). Although the activation barrier for the backward reaction has not been measured in a laboratory, the backward reaction is energetically less favorable than the forward reaction, i.e., likely k5b/k5f < 1 (Collier et al. 1984; Lamberts et al. 2015). Taken together, the D2O/HDO ice ratio can be lowered during the warm-up of ices in in-falling protostellar envelopes (Lamberts et al. 2015).
To check the impact of the H–D exchange by Reaction (5), we compared the timescale of the forward reaction that was calculated by Lamberts et al. (2015) and the duration time of the warm temperatures in our collapse model, and found that the former is much shorter than the latter at ≳80 K. Then D2O in ice would largely be lost prior to the sublimation of water ice, if Reaction (5) is as efficient in the ISM as in the laboratory. This challenges the D2O observations by Coutens et al. (2014), who showed that the D2O emission peak is located at the peak of the continuum emission as well as the H O and the HDO emissions.
A possible explanation for the discrepancy is the layered ice structure in the ISM. Ratajczak et al. (2009) experimentally demonstrated that the thermally activated H–D exchange between CD3OD and H2O occurs efficiently in mixed ice at T> 120 K, while the exchange does not occur in the case of segregated ice, even at higher temperatures on a laboratory timescale. As noted in Ratajczak et al. (2009), this implies that the H/D exchange occurs only between closely interacting molecules in ice. In the experiments of Lamberts et al. (2015), mixed ices with the mixing ratio of (H2O:D2O) ~ (1:1) were used, which ensures that each D2O has at least one neighbour of H2O. In our scenario, however, D2O is mainly present in the CO/CH3OH-rich outer-layers, i.e., significant fraction of D2O would not be neighbored by H2O molecules, and it may be the limiting factor of the H/D exchange by Reaction (5) in the ISM.
5. Conclusion
Recent interferometer observations have found that the D2O/HDO ratio is higher than the HDO/H2O ratio in the warm gas surrounding the low-mass protostar NGC 1333–IRAS 2A, where water ice has sublimated (Coutens et al. 2014). In this study, we have proposed that the observed feature is a natural consequence of chemical evolution in the early cold stages of low-mass star formation as follows: 1) majority of oxygen is locked up in water ice and other molecules in molecular clouds, where water deuteration is not efficient; and 2) water ice formation continues with much reduced efficiency in cold prestellar/protostellar cores, where deuteration processes are highly enhanced. Using a simple analytical model and gas-ice astrochemical simulations on the formation of molecular clouds (Paper I) and the gravitational collapse of dense cores, we have shown that the scenario can quantitatively explain the HDO/H2O ratio and the D2O/HDO ratio measured in IRAS 2A. Our model predictions are consistent with the low abundance of O2, the low OPR(H2), and the CH3OD/CH3OH ratio measured in low-mass protostellar sources, which further supports the scenario. We also found that the majority of HDO and D2O ices are likely formed in cold prestellar/protostellar cores rather than in molecular clouds, where the majority of H2O ice is formed. Taking the layered ice mantles into consideration, this implies that HDO and D2O are predominantly present in the CO/CH3OH-rich outer layers of ice mantles rather than in the H2O-dominated inner layers. The layered ice structure indicates that the gaseous HDO/H2O ratio that is produced by photodesorption doesnot reflect that of the bulk ice (see also Taquet et al. 2014).
The present study demonstrates the power of the combination of the HDO/H2O and D2O/HDO ratios as a tool to reveal the past history of water ice formation in the early cold stages of star formation and when the enrichment of deuterium in the bulk of water occurred. Further observations are desirable to investigate if the relation, D2O/HDO > HDO/H2O, is common in low-mass protostellar sources.
Acknowledgments
We thank Magnus V. Persson, Thanja Lamberts, Vianney Taquet, Catherine Walsh, and Maria N. Drozdovskaya for interesting discussions. We also thank the referee for his/her comments. Astrochemistry in Leiden is supported by the Netherlands Research School for Astronomy (NOVA), by a Royal Netherlands Academy of Arts and Sciences (KNAW) professor prize, and by the European Union A-ERC grant 291141 CHEMPLAN. K.F. is supported by the Research Fellowship from the Japan Society for the Promotion of Science (JSPS). Numerical computations were, in part, carried out on PC cluster at Center for Computational Astrophysics, National Astronomical Observatory of Japan.
References
- Aikawa, Y., Wakelam, V., Hersant, F., Garrod, R., & Herbst, E. 2012, ApJ, 760, 40 [NASA ADS] [CrossRef] [Google Scholar]
- Allen, M., & Robinson, G. W. 1977, ApJ, 212, 396 [NASA ADS] [CrossRef] [Google Scholar]
- Bergin, E. A., Melnick, G. J., Stauffer, J. R., et al. 2000, ApJ, 539, L129 [NASA ADS] [CrossRef] [Google Scholar]
- Bergin, E. A., Hartmann, L.W., Raymond, J. C., & Ballesteros-Paredes, J. 2004, ApJ, 612, 921 [NASA ADS] [CrossRef] [Google Scholar]
- Boogert, A., Gerakines, P., & Whittet, D. 2015, ARA&A, 53, 541 [Google Scholar]
- Brünken, S., Sipilä, O., Chambers, E. T., et al. 2014, Nature, 516, 219 [NASA ADS] [CrossRef] [PubMed] [Google Scholar]
- Butner, H. M., Charnley, S. B., Ceccarelli, C., et al. 2007, ApJ, 659, L137 [NASA ADS] [CrossRef] [Google Scholar]
- Caselli, P., & Ceccarelli, C. 2012, ARA&A, 20, 56 [Google Scholar]
- Cazaux, S., Caselli, P., & Spaans, M. 2011, ApJ, 741, L34 [NASA ADS] [CrossRef] [Google Scholar]
- Ceccarelli, C., Caselli, P., Bockelée-Morvan, D., et al. 2014, Protostars & Planets VI (Tucson: Univ. Arizona Press), 859 [Google Scholar]
- Collier, W. B., Ritzhaupt, G., & Devlin, J. P. 1984, J. Phys. Chem., 88, 363 [CrossRef] [Google Scholar]
- Coutens, A., Vastel, C., & Caux, E., et al. 2012, A&A, 539, A132 [NASA ADS] [CrossRef] [EDP Sciences] [Google Scholar]
- Coutens, A., Vastel, C., Cabrit, S., et al. 2013, A&A, 560, A39 [NASA ADS] [CrossRef] [EDP Sciences] [Google Scholar]
- Coutens, A., Jørgensen, J. K., Persson, M., et al. 2014, ApJ, 792, L5 [NASA ADS] [CrossRef] [Google Scholar]
- Crapsi, A., Caselli, P., Walmsley, C. M., et al. 2005, ApJ, 619, 379 [Google Scholar]
- Dartois, E., Thi, W. F., Geballe, T. R., et al. 2003, A&A, 399, 1020 [Google Scholar]
- Draine, B. T. 1978, ApJS, 36, 595 [NASA ADS] [CrossRef] [Google Scholar]
- Faure, M., Quirico, E., Faure, A., et al. 2015, Icarus, 261, 14 [NASA ADS] [CrossRef] [Google Scholar]
- Flower, D. R., Pineau Des Forêts, G., Walmsley, C. M. 2006, A&A, 449, 621 [NASA ADS] [CrossRef] [EDP Sciences] [Google Scholar]
- Furuya, K., Aikawa, Y., Nomura, H., Hersant, F., & Wakelam, V. 2013, ApJ, 779, 11 [NASA ADS] [CrossRef] [Google Scholar]
- Furuya, K., Aikawa, Y., Hincelin, U., et al. 2015, A&A, 584, A124 [NASA ADS] [CrossRef] [EDP Sciences] [Google Scholar]
- Fraser, H. J., Collings, M. P., McCoustra, M. R. S., & Williams, D. A. 2001, MNRAS, 327, 1165 [NASA ADS] [CrossRef] [Google Scholar]
- Garrod, R. T., & Herbst, E. 2006, A&A, 457, 927 [NASA ADS] [CrossRef] [EDP Sciences] [Google Scholar]
- Garrod, R. T., Wakelam, V., & Herbst, E. 2007, A&A, 467, 1103 [NASA ADS] [CrossRef] [EDP Sciences] [Google Scholar]
- Harada, N., Herbst, R., & Wakelam, V. 2010, ApJ, 721, 1570 [NASA ADS] [CrossRef] [Google Scholar]
- Hartmann, L., Ballesteros-Paredes, J., & Bergin, E. A. 2001, ApJ, 562, 852 [NASA ADS] [CrossRef] [Google Scholar]
- Hasegawa, T. I., & Herbst, E. 1993a, MNRAS, 261, 83 [NASA ADS] [CrossRef] [Google Scholar]
- Hasegawa, T. I., & Herbst, E. 1993b, MNRAS, 263, 589 [NASA ADS] [CrossRef] [Google Scholar]
- Hassel, G. E., Herbst, E., & Bergin, E. A. 2010, A&A, 515, A66 [NASA ADS] [CrossRef] [EDP Sciences] [Google Scholar]
- Hincelin, U., Herbst, E., Chang, Q., et al. 2014, 69th Int. Symp. Molecular Spectroscopy, 9 [Google Scholar]
- Hugo, E., Asvany, O., & Schlemmer, S. 2009, J. Chem. Phys., 130, 164302 [NASA ADS] [CrossRef] [PubMed] [Google Scholar]
- Inoue, T., & Inutsuka, S. 2012, ApJ, 759, 35 [NASA ADS] [CrossRef] [Google Scholar]
- Ioppolo, S., Cuppen, H. M., Romanzin, C., van Dishoeck, E. F., & Linnartz, H. 2008, ApJ, 686, 1474 [NASA ADS] [CrossRef] [Google Scholar]
- Jørgensen, J. K., & van Dishoeck, E. F. 2010, ApJ, 725, L172 [NASA ADS] [CrossRef] [Google Scholar]
- Lamberts, T., Ioppolo, S., Cuppen, H. M., Fedoseev, G., & Linnartz, H. 2015, MNRAS, 448, 3820 [NASA ADS] [CrossRef] [Google Scholar]
- Liu, F.-C., Parise, B., Kristensen, L., et al. 2011, A&A, 527, A19 [NASA ADS] [CrossRef] [EDP Sciences] [Google Scholar]
- Masunaga, H., & Inutsuka, S. 2000, ApJ, 531, 350 [NASA ADS] [CrossRef] [Google Scholar]
- Miyauchi, N., Hidaka, H., Chigai, T., et al. 2008, Chem. Phys. Lett., 456, 27 [NASA ADS] [CrossRef] [Google Scholar]
- Mokrane, H., Chaabouni, H., Accolla, M., et al. 2009, ApJ, 705, L195 [NASA ADS] [CrossRef] [Google Scholar]
- Nagaoka, A., Watanabe, N., & Kouchi, A. 2005, ApJ, 624, L29 [NASA ADS] [CrossRef] [Google Scholar]
- Oba, Y., Watanabe, N., Hama, T., et al. 2012, ApJ, 749, 67 [NASA ADS] [CrossRef] [Google Scholar]
- Oba, Y., Osaka, K., Watanabe, N., Chigai, T., & Kouchi, A. 2014, Faraday Disc., 168, 185 [NASA ADS] [CrossRef] [Google Scholar]
- Öberg, K. I., Boogert, A. C. A., Pontoppidan, K. M., et al. 2011, ApJ, 740, 109 [NASA ADS] [CrossRef] [Google Scholar]
- Parise, B., Simon, T., Caux, E., et al. 2003, A&A, 410, 897 [NASA ADS] [CrossRef] [EDP Sciences] [Google Scholar]
- Parise, B., Ceccarelli, C., Tielens, A. G. G. M., et al. 2006, A&A, 453, 949 [NASA ADS] [CrossRef] [EDP Sciences] [Google Scholar]
- Persson, M. V., Jørgensen, J. K., & van Dishoeck, E. F. 2013, A&A, 549, L3 [NASA ADS] [CrossRef] [EDP Sciences] [Google Scholar]
- Persson, M. V., Jorgensen, J. K., van Dishoeck, E., & Harsono, D. 2014, ApJ, 563, 74 [Google Scholar]
- Pontoppidan, K. M. 2006, A&A, 453, L47 [NASA ADS] [CrossRef] [EDP Sciences] [Google Scholar]
- Ratajczak, A., Quirico, E., Faure, A., Schmitt, B., & Ceccarelli, C. 2009, A&A, 496, L21 [NASA ADS] [CrossRef] [EDP Sciences] [Google Scholar]
- Rodgers, S. D., & Charnley, S. B. 2002, Planet. Space Sci., 50, 1125 [NASA ADS] [CrossRef] [Google Scholar]
- Taquet, V., Ceccarelli, C., & Kahane, C. 2012, ApJ, 748, L3 [NASA ADS] [CrossRef] [Google Scholar]
- Taquet, V., López-Sepulcre, A., Ceccarelli, C., et al. 2013, ApJ, 768, L29 [NASA ADS] [CrossRef] [Google Scholar]
- Taquet, V., Charnley, S. B., & Sipilä, O. 2014, ApJ, 791, 1 [NASA ADS] [CrossRef] [Google Scholar]
- Tielens, A. G. G. M. 2005, The Physics and Chemistry of the Interstellar Medium (Cambridge: Cambridge Univ. Press), 219 [Google Scholar]
- van Dishoeck, E. F., Bergin, E. A., Lis, D. C., & Lunine, J. I. 2014, Protostars & Planets VI (Tucson: Univ. Arizona Press), 835 [Google Scholar]
- Vasyunin, A. I., & Herbst, E. 2013, ApJ, 762, 86 [NASA ADS] [CrossRef] [Google Scholar]
- Wakelam, V., Vastel, C., Aikawa, Y., et al. 2014, MNRAS, 445, 2854 [NASA ADS] [CrossRef] [Google Scholar]
- Watanabe, N., & Kouchi, A. 2008, Prog. Surf. Sci., 83, 439 [NASA ADS] [CrossRef] [Google Scholar]
- Westley, M. S., Baragiola, R. A., Johnson, R. E., & Baratta, G. A. 1995, Nature, 373, 405 [NASA ADS] [CrossRef] [PubMed] [Google Scholar]
- Whittet, D. C. B. 1993, Dust and Chemistry in Astronomy (Bristol and Philadelphia: Institute of Physics Publishing), 9 [Google Scholar]
- Yıldız, U. A., Acharyya, K., Goldsmith, P. F., et al. 2013, A&A, 558, A58 [NASA ADS] [CrossRef] [EDP Sciences] [Google Scholar]
All Tables
All Figures
|
Fig. 1 Schematic view of our scenario and the layered ice structure. Stage I) The main formation stage of H2O ice. Water deuteration is not efficient, fD2< fD1 < 10-3. The majority of oxygen is locked in O-bearing molecules in this stage. Stage II) CO/CH3OH-rich outer ice layers are formed, while the formation of water ice continues with much reduced efficiency, compared to Stage I. Nevertheless, the formation of HDO and D2O ices is more efficient than in Stage I, owing to the enhanced deuteration processes, 10-3 ≪ fD2<fD1. |
| In the text | |
|
Fig. 2 [fD2/fD1] I + II ratio as a function of α (=NO, II/NO, I) and β (=PHDO, II/PHDO, I) in the two stage model given by Eq. (4) with q = 0.25. Above the dashed line (αβ ≳ 1), [fD1] I + II is larger than [fD1] I by a factor of two or more. See the text for more information. |
| In the text | |
|
Fig. 3 Temporal variations of molecular abundances (top) and abundance ratios (bottom) in the static phase (left) and during the collapse (right) in model MC2B in the fluid parcel, which reaches R = 5 AU at the final time of the simulation. Before the collapse begins, the temperature is 10 K and the number density of hydrogen nuclei (nH) is 2.3 × 104 cm-3. The horizontal axis of the right panels is set to be tfinal−t, where tfinal represents the final time of the simulation and t = 0 corresponds to the onset of the collapse. The solid lines, the dashed lines, and the dotted lines represent molecules in the bulk ice mantle, molecules in the surface ice layers, and gaseous molecules, respectively. |
| In the text | |
|
Fig. 4 Fractional composition and D/H ratios in the surface ice layers as functions of the total number of icy layers in model MC2B. The left panel represents the formation stage of a molecular cloud taken from Paper I, while the right panel represents the static and collapse stages at tfinal−t< 8.3 × 10⁴ yr, where dust temperature is 10 K, in the same fluid parcel shown in Fig. 3. The visual extinction for calculating photochemical rates increases from 2 mag at the end of the cloud formation stage to 5 mag at the prestellar core stage. The sudden increase leads to the sharp change of the fractional composition especially of H2CO and CH3OH in the surface ice layers. |
| In the text | |
|
Fig. 5 Radial profile of the molecular abundances (upper panel) and the abundance ratios of the molecules (lower panel) in model MC2B at 9.3 × 10⁴ yr after the protostellar birth. The labels at the top represents the temperature and density structures. The solid lines represent gaseous molecules, while the dashed lines represent icy molecules in the bulk ice mantle. |
| In the text | |
Current usage metrics show cumulative count of Article Views (full-text article views including HTML views, PDF and ePub downloads, according to the available data) and Abstracts Views on Vision4Press platform.
Data correspond to usage on the plateform after 2015. The current usage metrics is available 48-96 hours after online publication and is updated daily on week days.
Initial download of the metrics may take a while.