Fig. 3
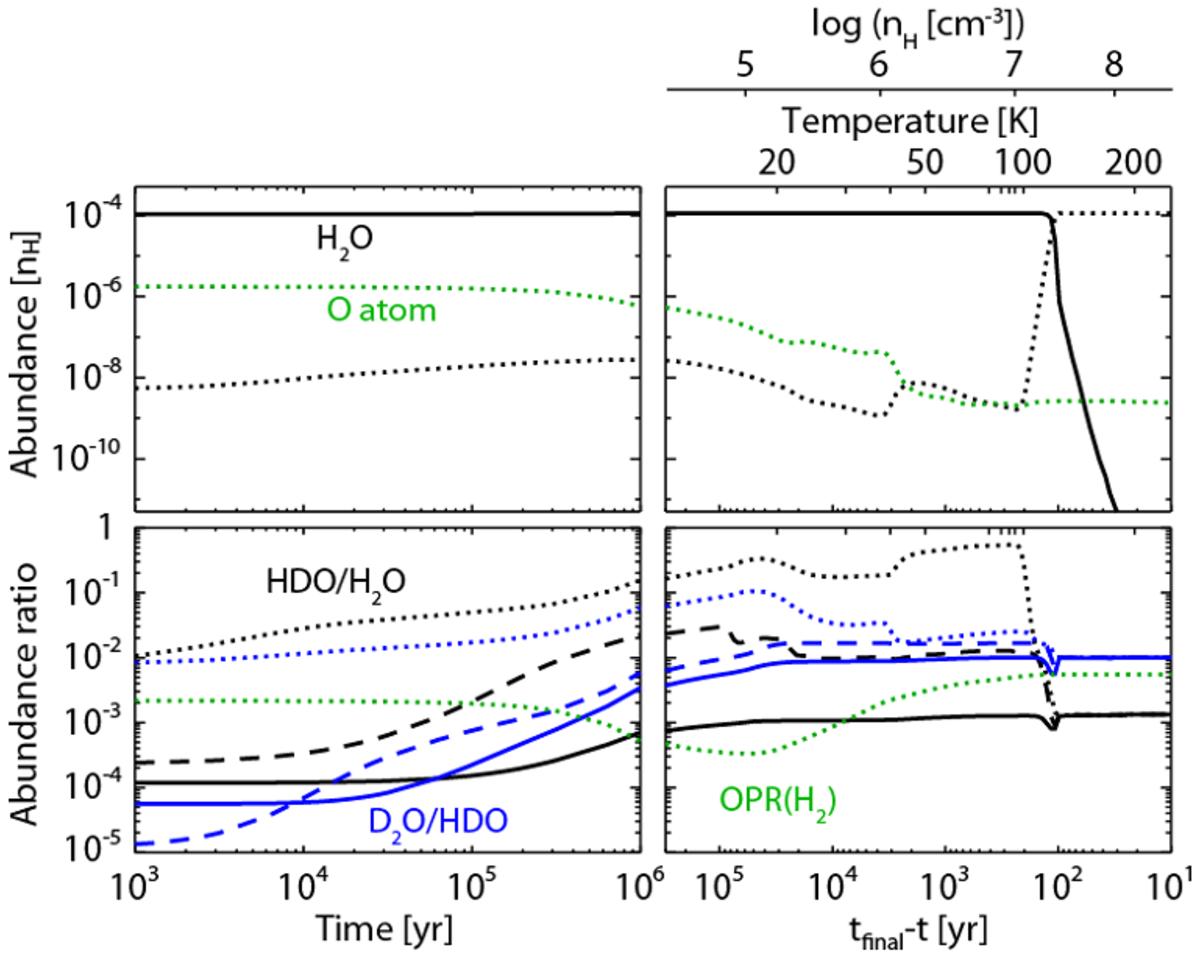
Temporal variations of molecular abundances (top) and abundance ratios (bottom) in the static phase (left) and during the collapse (right) in model MC2B in the fluid parcel, which reaches R = 5 AU at the final time of the simulation. Before the collapse begins, the temperature is 10 K and the number density of hydrogen nuclei (nH) is 2.3 × 104 cm-3. The horizontal axis of the right panels is set to be tfinal−t, where tfinal represents the final time of the simulation and t = 0 corresponds to the onset of the collapse. The solid lines, the dashed lines, and the dotted lines represent molecules in the bulk ice mantle, molecules in the surface ice layers, and gaseous molecules, respectively.
Current usage metrics show cumulative count of Article Views (full-text article views including HTML views, PDF and ePub downloads, according to the available data) and Abstracts Views on Vision4Press platform.
Data correspond to usage on the plateform after 2015. The current usage metrics is available 48-96 hours after online publication and is updated daily on week days.
Initial download of the metrics may take a while.