Fig. 5
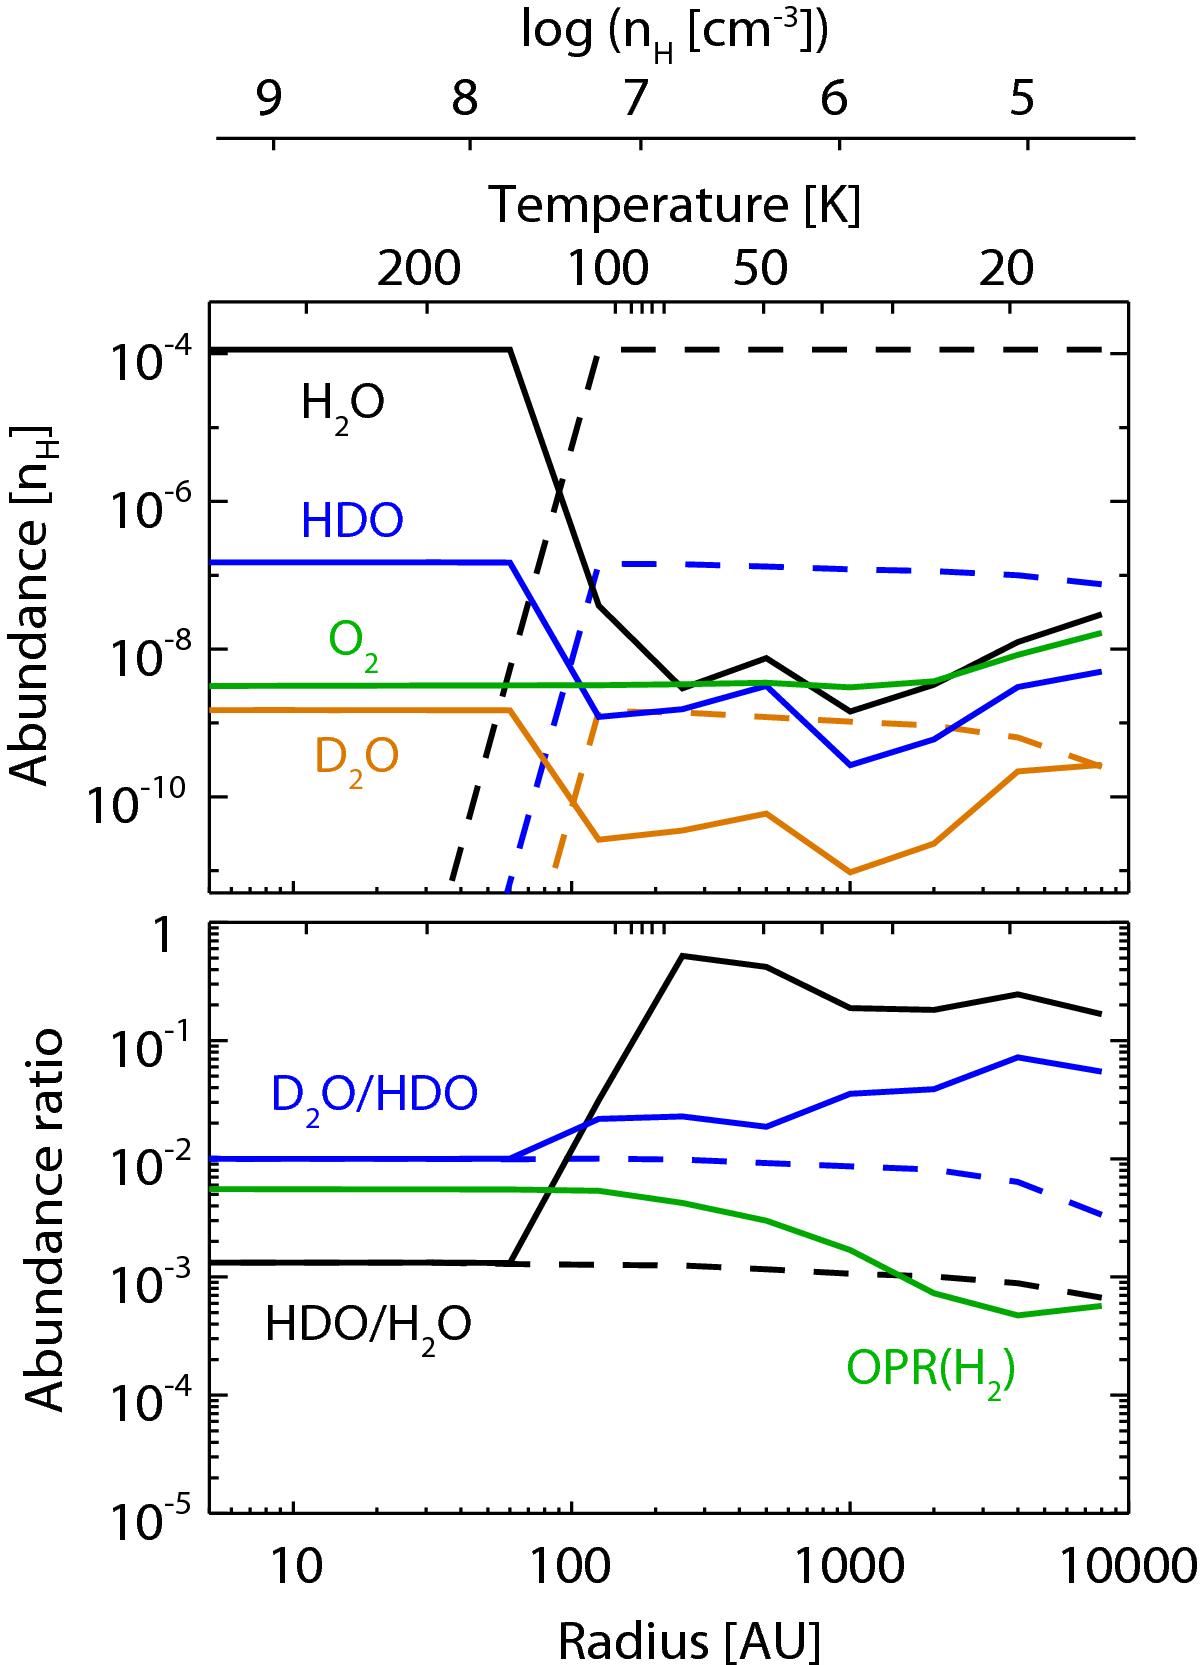
Radial profile of the molecular abundances (upper panel) and the abundance ratios of the molecules (lower panel) in model MC2B at 9.3 × 10⁴ yr after the protostellar birth. The labels at the top represents the temperature and density structures. The solid lines represent gaseous molecules, while the dashed lines represent icy molecules in the bulk ice mantle.
Current usage metrics show cumulative count of Article Views (full-text article views including HTML views, PDF and ePub downloads, according to the available data) and Abstracts Views on Vision4Press platform.
Data correspond to usage on the plateform after 2015. The current usage metrics is available 48-96 hours after online publication and is updated daily on week days.
Initial download of the metrics may take a while.