Free Access
Fig. 3
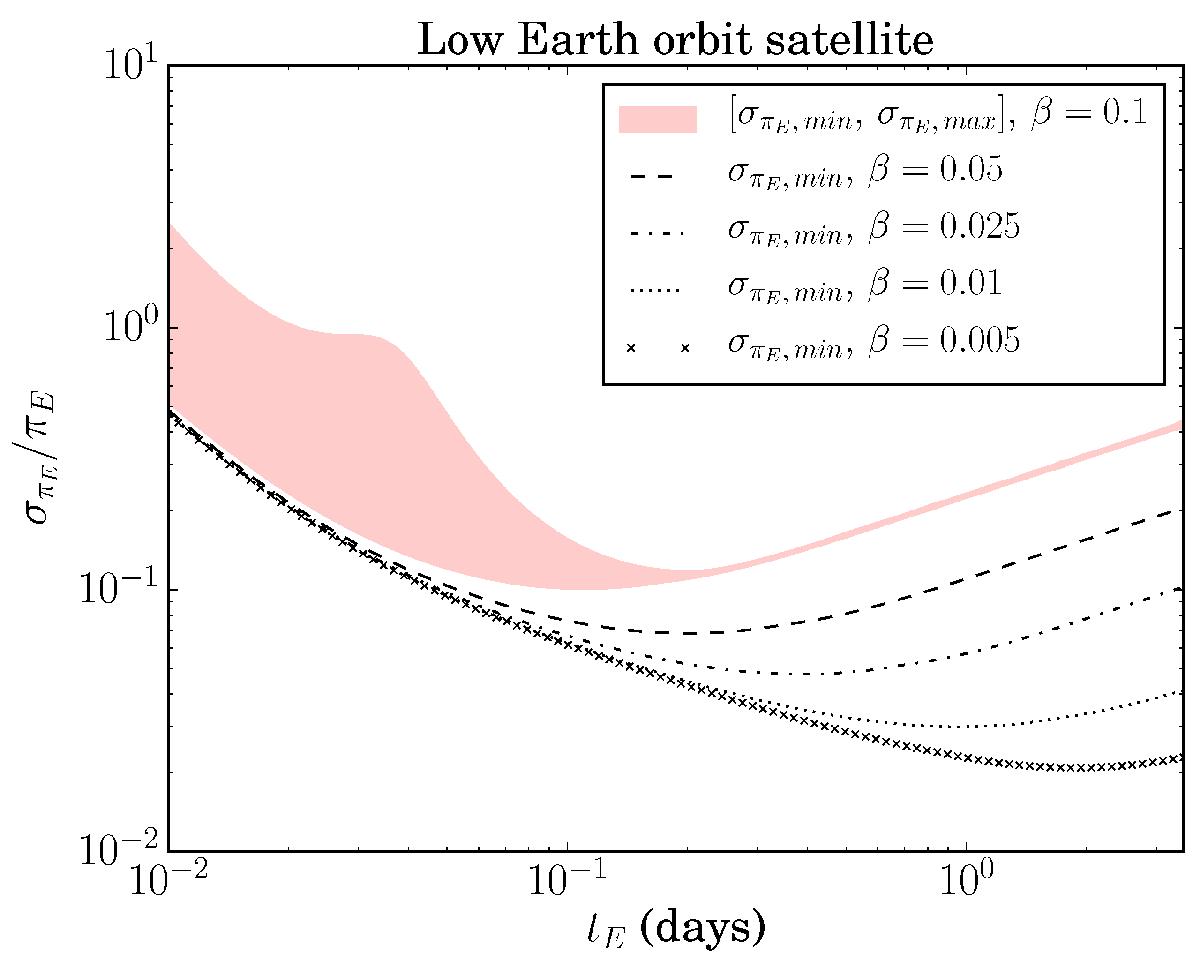
Relative error on πE plotted against tE for a LEO satellite at 550 km above the Earth’s surface. We assume 3 min exposures, σm = 0.01, and zero blending. For β = 0.1 the region σπE/πE ∈ [ σπE, min,σπE, max ] /πE is shown. For β = 0.05,0.025,0.01, and 0.005, the minimum relative error σπE, min/πE is plotted.
Current usage metrics show cumulative count of Article Views (full-text article views including HTML views, PDF and ePub downloads, according to the available data) and Abstracts Views on Vision4Press platform.
Data correspond to usage on the plateform after 2015. The current usage metrics is available 48-96 hours after online publication and is updated daily on week days.
Initial download of the metrics may take a while.