| Issue |
A&A
Volume 585, January 2016
|
|
|---|---|---|
| Article Number | A81 | |
| Number of page(s) | 11 | |
| Section | Stellar structure and evolution | |
| DOI | https://doi.org/10.1051/0004-6361/201527180 | |
| Published online | 23 December 2015 | |
VLT/MUSE discovers a jet from the evolved B[e] star MWC 137⋆
1 ESO–European Organisation for Astronomical Research in the Southern Hemisphere, Alonso de Cordova 3107, Vitacura, Santiago de Chile, Chile
e-mail: This email address is being protected from spambots. You need JavaScript enabled to view it.
2 Geneva Observatory, Geneva University, Chemin des Maillettes 51, 1290 Versoix, Switzerland
3 School of Physics and Astronomy, The University of Leeds, Leeds, LS2 9JT, UK
4 ESO–European Organisation for Astronomical Research in the Southern Hemisphere, Karl-Schwarzschild-Straße 2, 85748 Garching, Germany
Received: 12 August 2015
Accepted: 2 November 2015
Abstract
Aims. Not all stars exhibiting the optical spectral characteristics of B[e] stars are in the same evolutionary stage. The Galactic B[e] star MWC 137 is a prime example of an object with uncertain classification, where previous work has suggested either a pre- or a post-main sequence classification. Our goal is to settle this debate and provide a reliable evolutionary classification.
Methods. Integral field spectrograph observations with the Very Large Telescope Multi Unit Spectroscopic Explorer (VLT MUSE) of the cluster SH 2-266 are used to analyze the nature of MWC 137.
Results. A collimated outflow is discovered that is geometrically centered on MWC 137. The central position of MWC 137 in the cluster SH 2-266 within the larger nebula suggests strongly that it is a member of this cluster and that it is the origin of both the nebula and the newly discovered jet. Comparison of the color–magnitude diagram of the brightest cluster stars with stellar evolutionary models results in a distance of about 5.2 ± 1.4 kpc. We estimate that the cluster is at least 3 Myr old. The jet emanates from MWC 137 at a position angle of 18–20°. The jet extends over 66′′ (1.7 pc) projected on the plane of the sky, shows several knots, and has electron densities of about 103 cm-1 and projected velocities of up to ± 450 km s-1. From the Balmer emission line decrement of the diffuse intracluster nebulosity, we determine E(B–V) = 1.4 mag for the inner 1′ cluster region. The spectral energy distribution of the brightest cluster stars yields a slightly lower extinction of E(B–V) ~ 1.2 mag for the inner region and E(B–V) ~ 0.4–0.8 mag for the outer region. The extinction toward MWC 137 is estimated to be E(B–V) ~ 1.8 mag (AV ~ 5.6 mag).
Conclusions. Our analysis of the optical and near-infrared color–magnitude and color–color diagrams suggests a post-main sequence stage for MWC 137. The existence of a jet in this object implies the presence of an accretion disk. Several possibilities for MWC 137’s nature and the origin of its jet are discussed: e.g., the presence of a companion and a merger event.
Key words: stars: individual: MWC 137 / circumstellar matter / stars: distances / stars: emission-line, Be / stars: evolution / stars: jets
Based on observations collected at the European Southern Observatory, Chile: Prog.ID 094.D-0215(A).
© ESO, 2015
1. Introduction
The evolutionary phase of B[e] stars is difficult to establish because the classification criteria are met by stars of different masses and evolutionary stages (Lamers et al. 1998; Zickgraf 1998; Kraus & Miroshnichenko 2006). The B[e] designation refers to physical and spectral diagnostics: the presence of forbidden emission lines and dust emission. These characteristics are observed in stars in different evolutionary phases: supergiant B[e] stars (sgB[e]), pre-main sequence Herbig AeB[e] stars, compact planetary nebulae around B stars, symbiotic B[e] stars, and a large group of unclassified B[e] stars, whose evolutionary phases are unknown (Lamers 2006). The unclassified B[e] stars have been proposed as forming the FS CMa class, whose properties are said to be due to mass exchange in binary systems (Miroshnichenko 2007). One of the main problems in the evolutionary classification of these objects is their unknown distance and thus their unknown luminosity.
For instance, the classification of the Galactic B[e] star MWC 1371 includes pre-main sequence phases, based on its emission-line spectrum (Hillenbrand et al. 1992; Berrilli et al. 1992; Thé et al. 1994), and post-main sequence phases, based on its high luminosity, analysis of its stellar and nebular spectra, and its radio emission (Herbig & Kameswara Rao 1972; Finkenzeller & Mundt 1984; Esteban & Fernandez 1998). The range of distances to MWC 137 discussed in the literature is broad (d = 1−13 kpc; e.g., Hillenbrand et al. 1992; Amnuel et al. 1984; Fich & Blitz 1984; Wouterloot et al. 1988). Its luminosity and mass are therefore extremely uncertain.
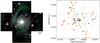 |
Fig. 1 Left: composite VRI color image (1.7′ × 1.7′) of the five MUSE fields covering the cluster SH 2-266, the central star MWC 137, and its circumstellar nebula. Right: spatial distribution of the brightest cluster stars (blue diamond in the center: MWC 137; black squares: A- and B-type stars; red squares: F- and G-type stars; black open squares: unclassified stars; arrow: jet extension, see Sect. 3.4). The stars for which a spectral type was obtained are indicated with a number, which is consistent with Table 2. |
Concerning its evolutionary stage, MWC 137’s large circumstellar nebula shows no enhanced nitrogen and helium abundance. Esteban & Fernandez (1998) argue that the morphology and other properties of the nebula suggest that it was produced by the interaction of stellar winds with the ambient interstellar medium or unprocessed ejected matter. Marston & McCollum (2008) also suggest that the nebula is unevolved, swept-up material.
Recent studies have found evidence of an evolved, post-main sequence nature for MWC 137, based on the 12C/13C ratio in CO emitting circumstellar material close to the star (Oksala et al. 2013; Muratore et al. 2015). They argue that the enrichment of 13C in a circumstellar ring of CO gas excludes a classification as a pre-main sequence Herbig AeBe (HAeBe) star and that MWC 137 is most likely in an extremely short-lived phase evolving from a B[e] supergiant to a blue supergiant with a bipolar ring nebula. However, the 12C/13C ratio is still compatible with a protoplanetary nebula and a main sequence star with a mass M> 9 M⊙, because the 12C/13C ratio drops for high-mass stars already on the main sequence (Kraus 2009). The observed value of the 12C/13C ratio is indicative, but by itself it does not provide strong evidence for the object’s evolutionary stage.
We investigate the cluster SH 2-266 to establish MWC 137’s membership and constrain the star’s evolutionary stage using data obtained with the new Very Large Telescope Multi Unit Spectroscopic Explorer (VLT MUSE; Bacon et al. 2010). While MWC 137 is generally associated with this cluster (Testi et al. 1999), no detailed study of the cluster properties exist. In Sect. 2 we describe the observations. In Sect. 3 we present our results regarding the cluster and MWC 137. We analyze a collimated outflow, which we discovered in the MUSE data and which probably emanates from MWC 137. In Sect. 4 we discuss the potential origin of this jet with respect to the evolutionary phase of MWC 137. Section 5 gives a short conclusion.
2. Data and analysis
The cluster SH 2-266 with the B[e] star MWC 137 in the center was observed with VLT MUSE on 2014 November 7 and 2014 December 1. MUSE is a spectrograph composed of 24 integral field units (IFUs) that sample a 1′ × 1′ field of view (Bacon et al. 2010). The instrument covers almost the full optical domain (4800–9300 Å) with a spectral resolving power of R ~ 3000. The spatial resolution for MUSE’s currently offered wide field mode is 0.̋3–0.̋4 (the pixel scale is 0.̋2 per pixel). We obtained seeing-limited spatial resolutions between 0.̋6 and 0.̋7.
Three exposures of 2 s, 20 s, and 300 s were obtained with MWC 137 in the center of the field of view of MUSE. Additional 600 s exposures were acquired with offsets of 35′′ in each of the cardinal directions (see Fig. 1). The limiting point source magnitude in our data is V ≈ 24 mag. MUSE provides the first complete and accurate set of optical line ratios and line centroids at each position of the cluster SH 2-266 and the large-scale nebula around MWC 137.
The data were reduced using version 1.1.0 of the MUSE standard pipeline (Weilbacher et al. 2012). Bias, arc, and flat-field master calibrations were created using a set of standard calibration exposures. Bias images were subtracted from each science frame. The science frames were flat-fielded using the master flat-field and renormalized using a flat-field taken right after the science to account for the temperature variations in the illumination pattern of the slices. An additional flat-field correction was performed using the twilight sky exposures to correct for the difference between sky and calibration unit illumination. A geometrical calibration and the wavelength calibration solution were used to transform the detector coordinate positions to wavelengths and spatial coordinates. The astrometric solution, flux calibration, and telluric correction were then applied. Sky subtraction was performed only in the post-reduction analysis of the individual stellar spectra. A data cube was produced from each pixel table using a three-dimensional drizzle interpolation process, which also rejects cosmic rays. All data cubes were sampled to  .
.
The MUSE standard pipeline also delivers field-of-view images in different filters when the filter transmission curves (in our case, Johnson V, Cousins R, and Cousins I) are provided; see Fig. 1 for a composite VRI image. We used the Aperture Photometry Tool v.2.4.72 to determine the VRI magnitudes of the brightest cluster members. Our MUSE data do not provide absolute magnitudes so we used V = 11.95 mag for MWC 137 as a reference (Reed 2003). We found no I-band magnitude reported in the literature. We therefore compared the V–I colors of the stars for which we determined the spectral type and extinction (Sect. 3.2) to the V–I colors reported in Pecaut & Mamajek (2013) to ensure our values are consistent with literature values. QFitsView3 was used to extract the stellar spectra using circular apertures from which an annulus mean sky/nebular spectrum was subtracted. For analyzing the strengths of the diffuse interstellar bands (DIBs), discussed in Sect. 3.2, spectra were not corrected for the sky or nebula component.
3. Results
3.1. The extinction to SH 2-266 from the Balmer decrement of the diffuse intracluster gas
We used the Balmer emission line decrement across the inner 1′× 1′ field of SH 2-266 to determine the extinction toward the cluster and thus a lower limit of the extinction toward MWC 137 (assuming the presence of additional circumstellar extinction). Hα and Hβ depend only weakly on the electron density and temperature. The comparison of the observed line intensity ratio (Hα/Hβ)obs to the theoretical recombination ratio (Hα/Hβ)int thus yields a measure of extinction.
Case B hydrogen recombination is typically assumed for determining the intrinsic line ratio of H ii regions. (The nebula is optically thick to photons of the Lyman series but optically thin to Lyα and photons of the higher hydrogen series.) We used the [S ii] 6716/6731 ratio and the [N ii] (6548+6583)/5755 ratio (Osterbrock & Ferland 2006) to estimate an average electron density of ne ~ 3 × 102 cm-3 and a temperature of T ~ 10 000 K across the nebula. The expected intrinsic (Hα/Hβ)int line ratio for an electron density of ne = 102 cm-3 and temperature of T = 10 000 K is 2.863 (Osterbrock & Ferland 2006). This ratio varies by only 0.057 for electron densities ne = 102 cm-3 to 106 cm-3 and by 0.294 for temperatures between 5000 K and 20 000 K.
The color excess E(B–V) due to dust attenuation can be expressed as ![Mathematical equation: \begin{eqnarray} E(B{-}V) = \frac{2.5}{\kappa({\rm H}\beta){-}\kappa({\rm H}\alpha)} \log_{10} \left[\frac{({\rm H}\alpha/{\rm H}\beta)_{\rm obs}}{({\rm H}\alpha/{\rm H}\beta)_{\rm int}} \right] \end{eqnarray}](/articles/aa/full_html/2016/01/aa27180-15/aa27180-15-eq41.png) (1)(see, e.g., Momcheva et al. 2013, for a derivation of this equation). Given that in reality the reddening law is particular for any direction in the sky, the functional form of the attenuation curve is a matter of choice. We used the Galactic reddening law of Fitzpatrick (1999) to derive κ(λ) = 21 896 /λ–0.954 (where λ is in Ångström units) for the optical wavelength region covered by MUSE. This leads to κ(Hα) = 2.38 and κ(Hβ) = 3.55 and thus to
(1)(see, e.g., Momcheva et al. 2013, for a derivation of this equation). Given that in reality the reddening law is particular for any direction in the sky, the functional form of the attenuation curve is a matter of choice. We used the Galactic reddening law of Fitzpatrick (1999) to derive κ(λ) = 21 896 /λ–0.954 (where λ is in Ångström units) for the optical wavelength region covered by MUSE. This leads to κ(Hα) = 2.38 and κ(Hβ) = 3.55 and thus to ![Mathematical equation: \begin{eqnarray} E(B{-}V) = 2.137 \log_{10} \left[\frac{({\rm H}\alpha/{\rm H}\beta)_{\rm obs}}{2.863} \right]\cdot \end{eqnarray}](/articles/aa/full_html/2016/01/aa27180-15/aa27180-15-eq47.png) (2)The difference in the intensity of the lines as a result of the use of different extinction laws is not significant compared to the uncertainties associated with our measurements.
(2)The difference in the intensity of the lines as a result of the use of different extinction laws is not significant compared to the uncertainties associated with our measurements.
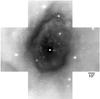 |
Fig. 2 Voronoi diagram of E(B–V) based on the extended nebular Hα/Hβ ratio, binned to a signal-to-noise ratio of 200 per polygon. The color coding is linear between E(B–V) = 0 mag (white) and E(B–V) = 1.8 mag (black). The extinction is highest close to MWC 137 and along the rim of the nebula, tracing the dust. It decreases toward the outskirts of the cluster. The white spots are stars and MWC 137 is saturated. This diagram serves as illustration. For absolute extinction values, individual spectra were examined (Sect. 3.2). |
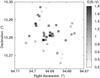 |
Fig. 3 Extinction map toward the stars classified in Sect. 3.2. The extinction was determined based on the comparison of their spectral energy distributions to UVES POP and Indo-US template spectra. |
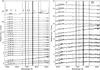 |
Fig. 4 Spectra of the brightest cluster stars extracted from the MUSE data cube. The spectrum #1 is of MWC 137. Spectra #2 to #23 are B- and A-type stars in the cluster. Their spectral classification, indicated next to each spectrum, was based primarily on the Hα, Hβ, and O i 7774 equivalent widths. Spectra #24 to #39 are F- and G-type stars. Their classification is based primarily on the Ca ii 8542 and Na i 5889 equivalent widths. The numbering is consistent with Table 2 and Fig. 1. Gray areas block regions of the spectra with strong residuals from the telluric bands correction. |
We determined the Balmer decrement (Hα/Hβ)obs across the inner 1′× 1′ region of the cluster SH 2-266 with a grid size of 10′′. Line intensities were measured by integrating all of the flux in a line between two suitably adopted wavelength ranges and above a local continuum. We found (Hα/Hβ)obs = 12.98 ± 2.27 (the error is the standard deviation of all measured values), which results in E(B–V) = 1.40 ± 0.47 mag. We used the reddening relations from Munari & Carraro (1996) to determine E(V–I) = 0.8 × E(B–V) = 1.12 ± 0.38 mag. Adopting a ratio between total and selective extinction of RV = AV/E(B–V) = 3.1 (Cardelli et al. 1989), we found AV = 4.35 ± 1.44 mag toward the inner 1′× 1′ cluster region.
Figure 2 shows a Voronoi diagram illustrating the highly variable extinction E(B–V) across the nebula. This map is for illustration purposes. To simplify the creation of this diagram from the MUSE data cubes, we have integrated the Hα emission line between the two strong [N ii] lines on either side and thus underestimate the Hα emission. Hβ was integrated over the same velocity interval. The extinction is highest close to MWC 137 and along the rim of the nebula, and it decreases outside the nebula, clearly tracing the dust distribution, which is supported by 2MASS images of this region (Skrutskie et al. 2006).
3.2. The extinction to MWC 137 via the spectral energy distributions of cluster stars
Figure 4 shows the spectra of the 39 brightest stars in the cluster, which have a sufficient signal-to-noise ratio for stellar classification. We determine a systemic cluster velocity of 50 ± 20 km s-1 based on the radial velocities of the Paschen lines (hot stars) and Ca ii and Ca i lines (cool stars). The spectra only have a few spectral lines, and there are residuals from the nebula emission for the broad hydrogen lines. This results in less accurate radial velocity measurements than expected for the spectral resolution of MUSE.
We determined the stellar spectral types with the help of the ESO UVES Paranal Observatory Project (POP) library of high-resolution spectra (R ~ 80 000, Bagnulo et al. 2003) and the Indo-US Library of low-resolution spectra (R ~ 5000, Valdes et al. 2004). The spectral resolving power of a range of template spectra, covering late-O to mid-G spectral subclasses, was decreased to R ~ 3000 to match our spectra. Equivalent widths of lines used for the spectral classification (see below) were measured in these template spectra and complemented by line equivalent widths listed in Jaschek & Jaschek (1987) and Didelon (1982). MUSE does not cover the critical wavelength regions bluewards of the 4750 Å commonly used for stellar classification of hot stars (Walborn & Fitzpatrick 1990). The spectral range and resolving power also do not permit classifying G-type star subclasses. Our spectral classification is thus only accurate to within a few spectral subclasses (Table 2). A review with spectra at bluer wavelengths is needed.
For the hot stars (spectral types B and A), we based our classification mostly on Hα and Hβ equivalent widths. The strength of O i 7774 was used to confirm the spectral subclass. The cluster does not contain any O-type stars. Two objects show weak He i absorption and we determined their spectral type to early B. For the cooler stars (spectral types F and later), we based our classification on the equivalent widths of Ca ii 8542 and Na i 5889. The second-to-last column in Table 2 lists our spectral classifications.
In addition to MWC 137, we found two stars with potential Hα emission (stars #4 and #16 in Table 2). Hα and O i 8446 emission remain after the nebular subtraction, while other nebular lines have been removed reasonable well. This may indicate circumstellar material. The hydrogen Paschen lines are very broad in absorption and suggest a high value of logg, indicating a luminosity class V and main sequence evolutionary phase. These two stars may be Be stars. However, the nebula emission varies strongly on small spatial scales and bad nebular subtraction may leave remnants that resemble narrow Hα emission. Follow-up observations with higher spectral resolution are needed to determine whether these stars are indeed Be stars.
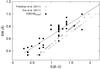 |
Fig. 5 Equivalent widths of the narrow component of the DIB at 5780 Å correlates linearly with our E(B–V) estimates determined in Sect. 3.2 (black squares). The E(B–V) values calculated from our equivalent widths using the relations in Friedman et al. (2011) and Vos et al. (2011) are also shown (gray points and gray stars). The offset of ~0.25 mag between the calculated and our values is probably due to different equivalent measurement procedures. Our procedure includes some of the broad component of the DIB so that we overestimate the equivalent widths. |
The righthand panel of Fig. 1 indicates the location of the cluster stars on the sky. It demonstrates that the higher mass stars are located primarily toward the cluster center, while the lower mass stars are found more toward the outskirts. Even though this qualitative result is somewhat biased by the higher extinction toward the center of the cluster, it indicates the mass segregation commonly found in young clusters (Zinnecker et al. 1993; Bonnell & Davies 1998).
We compared the flux-calibrated MUSE spectra with the spectral energy distributions of UVES POP and Indo-US spectra and determined the extinction to each individual object. Using this method, we estimated a slightly lower extinction to the inner cluster region on average than by the Balmer emission lines decrement method described in Sect. 3.1. We found that E(B–V) ≈1.2 ± 0.2 mag is a reasonable extinction estimate throughout most of the inner 1′ region of the cluster (Table 2 and Fig. 3). This results in AV ≈ 3.7 ± 0.6 mag (adopting an extinction law with R = 3.1) and E(V–I) ≈ 1.0 ± 0.2 mag. This result is similar to Esteban & Fernandez (1998), who determined E(B–V) = 1.216 mag. Toward the outer parts of the cluster, we find that the extinction drops to E(B–V) ≈ 0.4–0.8 mag4. In the center of the cluster, close to MWC 137, the extinction is higher. We have to adopt an extinction of E(B–V) ~ 1.8 mag (AV ~ 5.6 mag) to match the spectrum of MWC 137 to a B0 (Liermann et al. 2014) template spectrum. For comparison, using the Balmer decrement method described in Sect. 3.1, we found E(B–V) ~ 1.5 mag in the vicinity of MWC 137.
The strengths of DIBs are closely correlated with extinction (e.g., Herbig 1993; Jenniskens & Desert 1994; Groh et al. 2007; Raimond et al. 2012; Cox et al. 2014). We measured equivalent widths of 0.3–1.0 Å for the narrow component of the DIB at 5780 Å in the stellar spectra toward the cluster SH 2-266. The equivalent widths show a linear correlation with the extinction estimates determined in this section (Fig. 5 and Table 2), which confirms the wide range in E(B–V). In addition, Fig. 5 displays the E(B–V) calculated using the relations in Friedman et al. (2011) and Vos et al. (2011), which confirm our relative estimates. However, there is an offset of about 0.25 mag in the calculated E(B–V) values with respect to the values determined in this section. This offset is probably due to different equivalent width measurement procedures. The DIB at 5780 Å has a broad component, which, if included, results in larger equivalent widths by a factor of up to 1.5. Since we used only a rudimentary procedure, our measurements still include part of the broad component so that we overestimate the equivalent width. Also, the value of RV depends on the environment along the line of sight and may be as high as 5 (Cardelli et al. 1989). In an extreme case, we would underestimate the extinction by up to 2 mag, and the distance to the cluster would be several kpc farther away from us.
3.3. The distance, mass, and age of SH 2-266
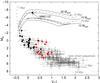 |
Fig. 6 MV versus V–I color–magnitude diagram of the brightest SH 2-266 cluster stars derived from the MUSE data. Black squares are B- and A-type stars, and red squares are cooler F- and G-type stars, corrected for their individual extinction. The arrow at MWC 137 indicates the positions in the color–magnitude diagram from the average inner cluster estimate of E(B–V) = 1.2 mag to the estimate for MWC 137 of E(B–V) ~ 1.8 mag. The open gray squares are unclassified stars corrected for a standard extinction of E(B–V) = 1.2 mag. Theoretical stellar evolution isochrones for 1 Myr, 10 Myr, and 15 Myr (gray dashed curves) and the evolutionary paths for 10 M⊙, 15 M⊙, and 20 M⊙ stars from the Geneva stellar models are shown (Ekström et al. 2012; Yusof et al. 2013). 1 Myr and 10 Myr pre-main sequence theoretical isochrones for star masses of 0.1–7 M⊙ from Siess et al. (2000) are also shown (gray dotted curve). |
Figure 6 shows the absolute visual magnitude MV versus V–I of the SH 2-266 cluster stars derived from the MUSE data. Magnitudes and colors were corrected for the individual extinctions determined in Sect. 3.2. The distance modulus was determined to μ = 13.6 ± 0.8 mag by minimizing the difference in MV for all stars to literature values for the respective spectral types (Wegner 2006, 2007). The errors in both color and absolute magnitude are large because of the high uncertainties in the interstellar medium extinction and the uncertainties in the spectral classification (see Sects. 3.1 and 3.2).
A distance modulus of μ = 13.6 mag results in a good fit of the main sequence cluster stars with Geneva stellar evolution models (Ekström et al. 2012; Yusof et al. 2013). This corresponds to a distance of about 5.2 ± 1.4 kpc. MWC 137 is located in the Galactic plane, almost opposite the Galactic center (l = 195.6502°, b = −0.1046°). The Perseus arm lies at a distance of about 2.5 kpc in this direction and the Cygnus arm at about 6 kpc (Churchwell et al. 2009; Taylor & Cordes 1993). SH 2-266 may thus be associated with the Cygnus arm.
Evolutionary tracks of 10–15 M⊙ stars fit the location of MWC 137 well in the color–magnitude diagram (Fig. 6). The two early B-type stars have masses of 6–8 M⊙ (Trundle et al. 2007; Hunter et al. 2007). If we adopt a total mass of about 25 M⊙ for the three most massive stars, a Salpeter initial mass function (Salpeter 1955) results in a total mass estimate of stars with masses ≥1 M⊙ in this cluster of about 100 M⊙. We obtained the same result by adding up the masses of the stars in Table 2. The mass function thus appears to be consistent with the initial mass function.
From the color–magnitude diagram of the brightest cluster members (Fig. 6) we determined an upper limit to the age of the cluster of about 30 Myr. This conservative estimate is based on the assumption that MWC 137 is not following the evolutionary track of a single star. In this case, the main sequence cut-off of this cluster is at about 8 M⊙. (Stars with spectral types B2–4 and later lie along the main sequence.) The estimation of a lower age limit is difficult. In case MWC 137 is following the post-main sequence evolution of a single star, its mass can be estimated to about 10–15M⊙ and its age to about 10–15 Myr. We did not find any evidence of any object in this cluster that still possesses its protoplanetary disk down to a mass of about 1 M⊙. Therefore, the cluster age is likely above 1–3 Myr (Ribas et al. 2015).
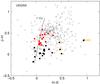 |
Fig. 7 J–H versus H–K color–color diagram from the UKIDSSDR8PLUS database. Black squares are B- and A-type stars, red squares are cooler F- and G-type stars. The open gray squares are unclassified stars. The theoretical stellar evolution isochrone for 5 Myr from the Geneva stellar models is shown (Ekström et al. 2012; Yusof et al. 2013). MWC 137, #10, #23, #25, and #28 are saturated in the UKIDSS images, and their JHK values were obtained from the 2MASS point source catalog (Cutri et al. 2003; the 2MASS catalog does not contain the star #10, which is thus not displayed here). See text for details. |
Figure 7 shows a near-infrared color–color diagram from the UKIDSS survey. The data were dereddened by adopting the E(B–V) values determined in Sect. 3.2 and the relations E(J–H)/E(H–K) = 2.09 mag (Jones & Hyland 1980) and E(J–H) /E(B–V) = 0.33 mag (Lee 1970). For MWC 137 the dereddening vector is shown from E(B–V) = 1.2 mag to 1.8 mag. For the unclassified stars, a default value of E(B–V) = 1.2 mag was assumed. The near-infrared colors confirm that the cluster is at least about 3 Myr old. A few high-mass stars are observed to have excess near-infrared emission (compare to Koornneef 1983) possibly because of hot dust, and in the case of MWC 137 a disk-like structure may also contribute. Near-infrared emission is present for stars #4 and #16, confirming the presence of circumstellar material, which the Hα emission in their spectra suggested (Sect. 3.2). For the two other stars with near-infrared excess, stars #6 and #8, there is no evidence of optical line emission.
Figure 6 indicates that a few F- and G-type stars may not have reached the main sequence yet, but have (pre-main sequence) ages between 1 Myr and 10 Myr based on the tracks by Siess et al. (2000). These stars (#24, 25, 30, 31 at MV ~ 0.5 mag) are located along the northeast rim of the nebula, indicating a possible age spread. A shock front emanating from MWC 137 could have caused a second episode of star formation in this cluster. However, the stars #24 and #25 have very bright V-band magnitudes, a low reddening, and a slightly different radial velocity, and are thus not likely cluster members. The near-infrared data show no evidence of disks around them. Most F- and G-type stars show less reddening than the B- and A-type stars, consistent with the strengths of their DIBs. This implies that these stars either are foreground stars, which explains the higher MV magnitudes compared to literature values for their spectral types (Table 2), or are found preferably at the front side of the cluster.
To summarize the different possibilities related to the age of the cluster and its very probable member MWC 137:
-
1.
MWC 137 is following the evolution of a singlemassive star. Its position in the Hertzsprung-Russell (HR)diagram is best fit with 10–15 Myr isochrones,which have a main sequence turn-off around10–15M⊙. This agrees with the near-infrared colors of the cluster stars.
-
2.
MWC 137 is not following the evolution of a single star. The HR diagram is best fit with a 30 Myr isochrone, where the main sequence cut-off is around 8 M⊙. This also agrees with the near-infrared colors of the cluster stars.
-
3.
MWC 137 is not following the evolution of a single star. Based on the fact that no stars with protoplanetary disks are found in this cluster and on the near-infrared colors, the cluster is older than 3–5 Myr.
-
4.
The cluster may have had several star formation episodes. In this case a single age determination is meaningless.
3.4. The jet
We discovered a collimated outflow in the MUSE data that appears to emanate from MWC 137 at a position angle of 18–20° (Fig. 8). We detect the jet in Hα, [N ii] 6548, 6583, and [S ii] 6716, 6731, but not in [O i] 5577, 6300. The extension of the jet as traced by the [N ii] 6583 line is about 66′′, which corresponds to a length of 1.7 pc projected on the plane of sky, if we adopt a distance of 5.2 kpc. The width of the jet is not resolved with three pixels, but corresponds to the seeing of about 0.6′′. The jet extends almost across the entire cluster (Figs. 1 and 8). The jet outflow, especially the northern outflow, shows deviations from a linear trace, and at least six knots can be identified (labeled “a” to “f” in Fig. 8). This may hint at a velocity variability and a precession of the jet axis (Raga et al. 2001).
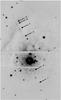 |
Fig. 8 Composed image showing the jet in [N ii] 6583. The upper and lower panels are velocity-binned images from 600 s exposures (−405 km s-1 to −234 km s-1 for the upper and 336 km s-1 to 507 km s-1 for the lower panel). The middle panel is one channel map (at −376 km s-1) of a 300 s exposure. Knots along the jet trace are labeled “a” to “f”. Other knot-like features coincident with the jet trace have stellar spectra. |
The velocity structure within the jet is resolved over about five MUSE channels. The jet material expands with projected velocities between −148 km s-1 to −433 km s-1 toward the north and between + 250 km s-1 to + 478 km s-1 toward the south. A slowing down of the jet with increasing distance to MWC 137 is observed. Given the large spatial extent and the high velocities, we assume an inclination of the jet to the plane of the sky close to 45°. Then the deprojected jet length is 93′′ (2.3 pc, assuming a distance of 5.2 kpc) and the deprojected speeds along the jet are up to 650 km s-1. We do not have any firm constraint on the inclination. For larger inclinations, the velocities within the jet may be well above 1 000 km s-1. When adopting a speed of material in the jet of 650 km s-1 and a travel distance of 1.2 pc, the lifetime of the outermost part of the jet is about 1800 yr. As a comparison, we estimate the age of the large nebula to ≥20 000 yr, based on an upper limit of its expansion speed of 60 km s-1 (limited by the spectral resolving power of MUSE) and its extension of about 50′′ from MWC 137 at a distance of 5.2 kpc. Thus, the jet did not originate in the same mass-loss episode that caused the nebula, but is much younger.
Figure 9 shows a spectrum of knot “c” in the Hα region. The strong nebular [N ii], [S ii], and [O i] dominate this part of the spectrum. Other strong nebular lines are Hβ and Paschen lines, [O i] 5577, and [S iii] 9069, weaker emission can be seen from [N i] 5200, He i 5876, 6678, [Ar iii] 7136, and [O ii] 7319, 7330, 7331. The figure indicates with marks the weaker emission from knot “c” at about −320 km s-1 with respect to the nebular lines. A comparison spectrum of MWC 137 shows that the large nebula is not a reflection nebula, but is ionized by the bright central source.
The detection of the jet in [N ii], but not in [O i] implies temperatures higher than 10 000 K (Hamann 1994). The electron density can be estimated by the ratio of the [S ii] lines at λλ6716, 6731. We found a flux ratio [S ii] 6716/6731 of about 1.1 for knot “a”, 1.0 for knot “b”, and 0.8 for the knot “c”. This implies that the electron density is decreasing with increasing distance to the star (as expected) and that the absolute value is ne ~ 103 cm-1 (Osterbrock & Ferland 2006). A rough estimate of the mass-loss rate within the jet results in Ṁ = 2 × πr2ρv ~ 10-8 M⊙ yr-1, assuming a knot radius of r = 0.7′′, an ionization fraction of 20% (Bacciotti & Eislöffel 1999), and a velocity of v = 650 km s-1. If the jet originated in an accretion episode and we assume that 10% of the accreted mass is ejected in the jet, then we obtain an upper limit for the accretion episode of about 10-7 M⊙ yr-1.
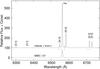 |
Fig. 9 Spectrum of knot “c” and the nebula. The strong [N ii], [S ii], and [O i] emission lines are from the extended nebula. The weaker emission at about −320 km s-1 with respect to these nebular lines are the emission lines originating in the knot (indicated by small marks). |
4. Discussion
The central position of MWC 137 in the cluster SH 2-266, within the large nebula, and also with respect to the jet, suggests strongly that MWC 137 not only belongs to this cluster, but is also at the origin of the nebula and the jet.
Collimated outflows occur in most astrophysical systems in which accretion, rotation, and magnetic fields interact. Jet physics are still highly uncertain, especially the jet generation mechanism. However, it is widely accepted that a fast, highly collimated jet requires an accretion disk. The stronger the accretion, the more powerful the jet. Coffey et al. (2008) show that 1–7% of the accreted mass is ejected in outflows for T Tauri jets. Similar values are found for HAeBe stars (e.g., Ellerbroek et al. 2014).
The outflow symmetries provide clues about the dynamical environment of the engine. The jet symmetry in MWC 137 deviates from a linear trace (Fig. 8). This indicates that the outflow axis changed over time, maybe owing to a precession induced by a companion, by the motion of surrounding gas, or movement of the outflow source itself. We observe several knots along the jet (four in the northern outflow and two in the southern outflow). These knots may form where faster ejecta run into slower material, but may also indicate variations in the mass ejection velocity or density. Variations in the low-density outbursts seem more likely for MWC 137’s jet, because the knot spectra are dominated by the same low-excitation lines as the nebula, and we do not detect significant line ratio variations of Hα/[S ii] and Hα/[N ii] between the knot and the nebula spectra. Photoionization thus dominates the nebula and the jet emission spectra. Apart for knots “d” and “f”, we do not find any point symmetry in the location of the knots with respect to MWC 137, which would indicate a common event. We estimate a density of ~103 cm-3. The inner jet components are denser, hotter, and faster. Average jets have densities of 102 to 105 cm-1 (Bacciotti & Eislöffel 1999). Based on the spatial extent and outflow velocities, we estimate a minimum life of the jet of at least 1800 yrs (compared to an age of ≥20 000 yr for the nebula).
Oudmaijer & Drew (1999) used spectropolarimetry across Hα of MWC 137 and derived an intrinsic polarization angle of 30°. This polarization supports the presence of a dense Hα-emitting aspherical structure such as a disk around the star. Typically, the intrinsic polarization angle is perpendicular to the circumstellar disk structures (Vink et al. 2002, 2005), and therefore the disk-like structure for MWC 137 has a position angle on the sky of 120°, i.e., perpendicular to the jet. This supports the idea that the jet is associated with a disk around MWC 137. The absence of hydrogen P Cygni profiles in the spectrum of MWC 137 suggests that the disk-like structure has some inclination to the plane of the sky (Zickgraf et al. 1985).
Infrared data suggest that the disk of MWC 137 is probably relatively compact. Although the near-infrared and mid-infrared colors demonstrate the presence of hot and warm dust (see Fig. 7 and de Wit et al. 2014), MWC 137 does not show strong evidence for a disk-like environment at long wavelengths. Sandell et al. (2011) saw no enhancement in cold dust emission toward MWC 137 in their 850 μm SCUBA maps. These authors conclude that MWC 137 has photoionized most of its disk and is more evolved than a HAeBe star. Fuente et al. (2004) also find no compelling evidence of a disk. They determined an upper limit of 0.007 M⊙ to the mass of a circumstellar disk based on its spectral energy distribution at mm and cm wavelength obtained with the IRAM and the VLA interferometers.
Derived cluster, nebula, stellar, and jet parameters.
Spectral classification for the brightest cluster members.
The origin and nature of the jet in MWC 137 is not clear. While we have found that MWC 137 is a sgB[e], its evolutionary history is actually unknown. In particular, we do not know the initial and current surface rotational speed, mass-loss history, and binarity status. These factors significantly affect the evolution of the star to the point of invalidating the evolutionary tracks shown in Fig. 6. Nevertheless, we discuss several possibilities below.
-
1.
Circumstellar material due to a close binary star. The majority of massive stars are born in multiple systems (Sana et al. 2008; Chini et al. 2012; Sana et al. 2013; Kobulnicky et al. 2014). Dunstall et al. (2015) find a present-day binary fraction of 58 ± 11% for B-type stars in the 30 Doradus region of the Large Magellanic Cloud. Chini et al. (2012) find that more than 80% of stars with masses above 16 M⊙ in the Milky Way form close binary systems. The presence of a companion significantly influences the evolution of massive stars (Podsiadlowski & Price 1992; Langer et al. 2008; Eldridge 2011), and the widespread importance of stellar mass transfer in binary systems has only been realized recently. In the case of MWC 137, circumstellar material may accumulate in the Roche lobe of a putative (smaller) companion to form a disk-like structure, from which a jet could be launched (Harmanec et al. 1996; Ak et al. 2007; Akashi et al. 2015). In such disks, one does not expect any dust, which is consistent with the lack of dust emission found for MWC 137. Another possibility is that the system is similar to the B[e] star CI CAM, which experienced an outburst and is likely to have either a neutron star, black hole, or white dwarf companion (Frontera et al. 1998; Barsukova et al. 2006). The disk-like feature may also be bound material from a previous mass transfer of a hotter companion, which may now be an undetected white dwarf. To have a white dwarf companion to a 10–15 M⊙ star, the mass exchange would have had to involve at least three solar masses.
-
2.
Accretion disk from a stellar merger. Stars that appear to be single may have evolved from binary systems (de Mink et al. 2014). About 24% of all O-type stars may be merged binaries (Sana et al. 2012). This has important consequences on their inferred evolutionary history (de Mink et al. 2013). MWC 137 may possibly be the product of a stellar merger of two B-type stars. The large circumstellar nebula may have been triggered by this merger event around 20 000 yr ago. In addition, an accretion disk may have formed around the merged massive object, which is still fueling the jet. This scenario could explain the unprocessed nebula material, the disk-like structure and the jet. However, the mass function of the cluster appears to be consistent with the initial mass function without having to invoke a merger scenario.
-
3.
Protoplanetary disk. When stars form, an accretion disk develops after an initial radial infall of material. Disk lifetimes depend on mass; i.e., they are shorter for higher mass stars (Fuente et al. 2004; Ribas et al. 2015). Magnetic fields couple the disk to the star, and an accretion system drives a strong outflow that can lead to a jet. A few HAeBe stars are associated with jets (e.g., Ellerbroek et al. 2014). The estimated protostellar jet phase is about 105 yr. However, MWC 137 is the most massive star in the cluster with a mass of about 10–15 M⊙, while other cluster members have masses ≲8 M⊙. If MWC 137’s disk is the evolved remnant from the star’s protoplanetary phase, then some physical process, such as a strong magnetic field, must have conserved it, because we do not observe disks around any of the later-type stars. If MWC 137 is a pre-main sequence star, it could belong to a younger generation of stars in this cluster, but this hypothesis is highly speculative.
-
4.
Planetary nebula phase. In the planetary nebula stage, jets are generally much less collimated than is the case for MWC 137, and they show slower outflow velocities (Balick et al. 1987). However, some planetary nebula show relatively narrow jets, such as Fleming 1 (Lopez et al. 1993b,a), where a binary shapes the point-symmetric jet (Boffin et al. 2012).
-
5.
Jet emanates from star “4”. Connecting the end points of the observed collimated jet with a linear curve MWC 137 is the most likely choice for its origin (Fig. 1), and both outflows appear to trace directly back to MWC 137. However, we find Hα emission and thus evidence for circumstellar material in the nearby star #4.
-
6.
Jet arises from a less massive, distant, unresolved companion, which does not interact with MWC 137. The closest star to MWC 137 that we can resolve in our MUSE data is at about 15 000 au (assuming a distance of 5.2 kpc). Thus, there is the possibility that a nearby star or a wide companion star with no interaction with MWC 137 may be the origin of the jet. The properties of such a companion cannot be observationally constrained from our data, but it has to be cool enough to not excite much line emission in the disk.
5. Conclusion
We have presented a study using VLT MUSE IFU data of the host star cluster of the enigmatic early B[e]-type star MWC 137. Our analysis of the optical color–magnitude diagram and the IFU spectra of the cluster stars allowed a distance estimate of 5.2 ± 1.4 kpc. The data establish that MWC 137 is the most massive member of the cluster with a spectroscopically identified main sequence populated by A- and B-type stars. Based on isochronal analysis, we can conclude that MWC 137 has evolved off the main sequence. Its high luminosity of log (L/L⊙) ~ 6.0 and its IRAS colors (Helou & Walker 1988) show that it is not a member of the FS CMa class (Miroshnichenko 2007), but a sgB[e] star.
Despite a firm characterization of MWC 137 as an evolved object, we also present the surprising discovery of a jet centered on MWC 137. The jet has projected velocities of up to ± 450 km s-1 and a projected length of 66′′. Several knots are seen along the jet, which stem either from the interaction of the fast jet with the slower surrounding material or from velocity variations within the outflow. Jets of this morphology are usually associated with young star accretion from a primordial disk. An Hα spectro-polarimetric signal supports the presence of a gaseous disk associated with MWC 137, and yet this disk contains little to no cold dust. It is therefore debatable whether the jet engine is a primordial disk or a disk generated by an interactive phenomenon. This uncertainty is nourished by the fact that the cluster members with spectral types as late as approximately G5V display little to no evidence of primordial disks. We find that the outermost observed knots of the jet are about 1800 yr old, whereas the larger surrounding nebula is limited in age to ≥20 000 yr. As an alternative origin for the jet, we speculate that during a high mass-loss episode that leads to the formation of the nebula (e.g., an eruption or a merger event), an accretion disk formed that fuels the jet. Another possibility is that MWC 137 has either a neutron star, a black hole, or a white dwarf companion, similar to the B[e] star CI CAM. Table 1 summarizes our findings on the cluster, nebular, stellar, and jet parameters.
The MUSE IFU data of the cluster SH 2-266 have provided important new insights into the evolution of its most massive member. The data allowed us to strongly constrain the distance to the cluster and unambiguously demonstrate that MWC 137 is a post-main sequence object based on its position in the HR diagram. Nevertheless, the enigmatic nature of this source has only increased by the discovery of a fast jet emanating from it. Future observations with instruments probing smaller spatial scales and different wavelengths will let us analyze the jet and the disk-like structure in more detail. Deeper observations will be required to detect the main sequence turn-on and determine the age of the cluster by means of pre-main sequence evolutionary tracks.
Another common identifier is V∗ V1308 Ori.
Vilchez & Esteban (1996) had already measured different reddening corrections for the inner and the outer cluster regions.
Acknowledgments
This research has made use of the VizieR catalogue access tool, CDS, Strasbourg, France. We have also used UKIDSS data from the UKIDSSDR8plus database. The UKIDSS project is defined in Lawrence et al. (2007). UKIDSS uses the UKIRT Wide Field Camera (WFCAM; Casali et al. 2007) and a photometric system described in Hewett et al. (2006). We thank R. M. Humphreys for her comments on an early version of the paper and N. L. J. Cox for his advice on DIBs.
References
- Ak, H., Chadima, P., Harmanec, P., et al. 2007, A&A, 463, 233 [NASA ADS] [CrossRef] [EDP Sciences] [Google Scholar]
- Akashi, M., Sabach, E., Yogev, O., & Soker, N. 2015, MNRAS, 453, 2115 [NASA ADS] [CrossRef] [Google Scholar]
- Amnuel, P. R., Guseinov, O. K., Novruzova, K. I., & Rustamov, I. S. 1984, Ap&SS, 107, 19 [NASA ADS] [CrossRef] [Google Scholar]
- Bacciotti, F., & Eislöffel, J. 1999, A&A, 342, 717 [NASA ADS] [Google Scholar]
- Bacon, R., Accardo, M., Adjali, L., et al. 2010, in SPIE Conf. Ser., 7735, 8 [Google Scholar]
- Bagnulo, S., Jehin, E., Ledoux, C., et al. 2003, The Messenger, 114, 10 [NASA ADS] [Google Scholar]
- Balick, B., Preston, H. L., & Icke, V. 1987, AJ, 94, 1641 [NASA ADS] [CrossRef] [Google Scholar]
- Barsukova, E. A., Borisov, N. V., Burenkov, A. N., et al. 2006, in Stars with the B[e] Phenomenon, eds. M. Kraus, & A. S. Miroshnichenko, 355, 305 [Google Scholar]
- Berrilli, F., Corciulo, G., Ingrosso, G., et al. 1992, ApJ, 398, 254 [NASA ADS] [CrossRef] [Google Scholar]
- Boffin, H. M. J., Miszalski, B., Rauch, T., et al. 2012, Science, 338, 773 [NASA ADS] [CrossRef] [PubMed] [Google Scholar]
- Bonnell, I. A., & Davies, M. B. 1998, MNRAS, 295, 691 [NASA ADS] [CrossRef] [Google Scholar]
- Brand, J., & Wouterloot, J. G. A. 1994, A&AS, 103, 503 [NASA ADS] [Google Scholar]
- Cardelli, J. A., Clayton, G. C., & Mathis, J. S. 1989, ApJ, 345, 245 [NASA ADS] [CrossRef] [Google Scholar]
- Casali, M., Adamson, A., Alves de Oliveira, C., et al. 2007, A&A, 467, 777 [NASA ADS] [CrossRef] [EDP Sciences] [Google Scholar]
- Chini, R., Hoffmeister, V. H., Nasseri, A., Stahl, O., & Zinnecker, H. 2012, MNRAS, 424, 1925 [NASA ADS] [CrossRef] [Google Scholar]
- Churchwell, E., Babler, B. L., Meade, M. R., et al. 2009, PASP, 121, 213 [NASA ADS] [CrossRef] [Google Scholar]
- Coffey, D., Bacciotti, F., & Podio, L. 2008, ApJ, 689, 1112 [NASA ADS] [CrossRef] [Google Scholar]
- Cox, N. L. J., Cami, J., Kaper, L., et al. 2014, A&A, 569, A117 [NASA ADS] [CrossRef] [EDP Sciences] [Google Scholar]
- Cutri, R. M., Skrutskie, M. F., van Dyk, S., et al. 2003, VizieR Online Data Catalog: II/246 [Google Scholar]
- de Mink, S. E., Langer, N., Izzard, R. G., Sana, H., & de Koter, A. 2013, ApJ, 764, 166 [NASA ADS] [CrossRef] [Google Scholar]
- de Mink, S. E., Sana, H., Langer, N., Izzard, R. G., & Schneider, F. R. N. 2014, ApJ, 782, 7 [NASA ADS] [CrossRef] [Google Scholar]
- de Wit, W. J., Oudmaijer, R. D., & Vink, J. S. 2014, Adv. Astron., 2014, 10 [Google Scholar]
- Didelon, P. 1982, A&AS, 50, 199 [NASA ADS] [Google Scholar]
- Dunstall, P. R., Dufton, P. L., Sana, H., et al. 2015, A&A, 580, A93 [NASA ADS] [CrossRef] [EDP Sciences] [Google Scholar]
- Ekström, S., Georgy, C., Eggenberger, P., et al. 2012, A&A, 537, A146 [NASA ADS] [CrossRef] [EDP Sciences] [Google Scholar]
- Eldridge, J. J. 2011, in UP2010: Have Observations Revealed a Variable Upper End of the Initial Mass Function?, eds. M. Treyer, T. Wyder, J. Neill, M. Seibert, & J. Lee, 440, 217 [Google Scholar]
- Ellerbroek, L. E., Podio, L., Dougados, C., et al. 2014, A&A, 563, A87 [NASA ADS] [CrossRef] [EDP Sciences] [Google Scholar]
- Esteban, C., & Fernandez, M. 1998, MNRAS, 298, 185 [NASA ADS] [CrossRef] [Google Scholar]
- Fich, M., & Blitz, L. 1984, ApJ, 279, 125 [NASA ADS] [CrossRef] [Google Scholar]
- Finkenzeller, U., & Mundt, R. 1984, A&AS, 55, 109 [NASA ADS] [Google Scholar]
- Fitzpatrick, E. L. 1999, PASP, 111, 63 [NASA ADS] [CrossRef] [Google Scholar]
- Friedman, S. D., York, D. G., McCall, B. J., et al. 2011, ApJ, 727, 33 [NASA ADS] [CrossRef] [Google Scholar]
- Frontera, F., Orlandini, M., Amati, L., et al. 1998, A&A, 339, L69 [NASA ADS] [Google Scholar]
- Fuente, A., Rodríguez-Franco, A., Testi, L., et al. 2004, Ap&SS, 292, 465 [NASA ADS] [CrossRef] [Google Scholar]
- Groh, J. H., Damineli, A., & Jablonski, F. 2007, A&A, 465, 993 [NASA ADS] [CrossRef] [EDP Sciences] [Google Scholar]
- Hamann, F. 1994, ApJS, 93, 485 [NASA ADS] [CrossRef] [Google Scholar]
- Harmanec, P., Morand, F., Bonneau, D., et al. 1996, A&A, 312, 879 [Google Scholar]
- Helou, G., & Walker, D. W. 1988, Infrared astronomical satellite (IRAS) catalogs and atlases, 7 [Google Scholar]
- Herbig, G. H. 1993, ApJ, 407, 142 [NASA ADS] [CrossRef] [Google Scholar]
- Herbig, G. H., & Kameswara Rao, N. 1972, ApJ, 174, 401 [NASA ADS] [CrossRef] [Google Scholar]
- Hewett, P. C., Warren, S. J., Leggett, S. K., & Hodgkin, S. T. 2006, MNRAS, 367, 454 [NASA ADS] [CrossRef] [Google Scholar]
- Hillenbrand, L. A., Strom, S. E., Vrba, F. J., & Keene, J. 1992, ApJ, 397, 613 [NASA ADS] [CrossRef] [Google Scholar]
- Hunter, I., Dufton, P. L., Smartt, S. J., et al. 2007, A&A, 466, 277 [NASA ADS] [CrossRef] [EDP Sciences] [Google Scholar]
- Jaschek, C., & Jaschek, M. 1987, The classification of stars (Cambridge: University Press) [Google Scholar]
- Jenniskens, P., & Desert, F.-X. 1994, A&AS, 106, 39 [NASA ADS] [Google Scholar]
- Jones, T. J., & Hyland, A. R. 1980, MNRAS, 192, 359 [NASA ADS] [Google Scholar]
- Kobulnicky, H. A., Kiminki, D. C., Lundquist, M. J., et al. 2014, ApJS, 213, 34 [NASA ADS] [CrossRef] [Google Scholar]
- Koornneef, J. 1983, A&A, 128, 84 [NASA ADS] [Google Scholar]
- Kraus, M. 2009, A&A, 494, 253 [NASA ADS] [CrossRef] [EDP Sciences] [Google Scholar]
- Kraus, M., & Miroshnichenko, A. S. 2006, in Stars with the B[e] Phenomenon, ASP Conf. Ser., 355 [Google Scholar]
- Lamers, H. J. G. L. M. 2006, in Stars with the B[e] Phenomenon, eds. M. Kraus, & A. S. Miroshnichenko, 355, 371 [Google Scholar]
- Lamers, H. J. G. L. M., Zickgraf, F.-J., de Winter, D., Houziaux, L., & Zorec, J. 1998, A&A, 340, 117 [NASA ADS] [Google Scholar]
- Langer, N., Cantiello, M., Yoon, S.-C., et al. 2008, in Rotation and Massive Close Binary Evolution, eds. F. Bresolin, P. A. Crowther, & J. Puls, IAU Symp., 250, 167 [Google Scholar]
- Lawrence, A., Warren, S. J., Almaini, O., et al. 2007, MNRAS, 379, 1599 [NASA ADS] [CrossRef] [MathSciNet] [Google Scholar]
- Lee, T. A. 1970, ApJ, 162, 217 [NASA ADS] [CrossRef] [Google Scholar]
- Liermann, A., Schnurr, O., Kraus, M., et al. 2014, MNRAS, 443, 947 [NASA ADS] [CrossRef] [Google Scholar]
- Lopez, J. A., Meaburn, J., & Palmer, J. W. 1993a, ApJ, 415, L135 [NASA ADS] [CrossRef] [Google Scholar]
- Lopez, J. A., Roth, M., & Tapia, M. 1993b, A&A, 267, 194 [NASA ADS] [Google Scholar]
- Marston, A. P., & McCollum, B. 2008, A&A, 477, 193 [NASA ADS] [CrossRef] [EDP Sciences] [Google Scholar]
- Miroshnichenko, A. S. 2007, ApJ, 667, 497 [NASA ADS] [CrossRef] [Google Scholar]
- Miroshnichenko, S. 1994, in The Nature and Evolutionary Status of Herbig Ae/ Be Stars, eds. P. S. Thé, M. R. Perez, & E. P. J. van den Heuvel, 62, 134 [Google Scholar]
- Momcheva, I. G., Lee, J. C., Ly, C., et al. 2013, AJ, 145, 47 [NASA ADS] [CrossRef] [Google Scholar]
- Munari, U., & Carraro, G. 1996, A&A, 314, 108 [NASA ADS] [Google Scholar]
- Muratore, M. F., Kraus, M., Oksala, M. E., et al. 2015, AJ, 149, 13 [NASA ADS] [CrossRef] [Google Scholar]
- Oksala, M. E., Kraus, M., Cidale, L. S., Muratore, M. F., & Borges Fernandes, M. 2013, A&A, 558, A17 [NASA ADS] [CrossRef] [EDP Sciences] [Google Scholar]
- Osterbrock, D. E., & Ferland, G. J. 2006, Astrophysics of gaseous nebulae and active galactic nuclei, 2nd edn. (Sausalito, CA: University Science Books) [Google Scholar]
- Oudmaijer, R. D., & Drew, J. E. 1999, MNRAS, 305, 166 [NASA ADS] [CrossRef] [Google Scholar]
- Pecaut, M. J., & Mamajek, E. E. 2013, ApJS, 208, 9 [NASA ADS] [CrossRef] [Google Scholar]
- Podsiadlowski, P., & Price, N. M. 1992, Nature, 359, 305 [NASA ADS] [CrossRef] [Google Scholar]
- Raga, A., Cabrit, S., Dougados, C., & Lavalley, C. 2001, A&A, 367, 959 [NASA ADS] [CrossRef] [EDP Sciences] [Google Scholar]
- Raimond, S., Lallement, R., Vergely, J. L., Babusiaux, C., & Eyer, L. 2012, A&A, 544, A136 [NASA ADS] [CrossRef] [EDP Sciences] [Google Scholar]
- Reed, B. C. 2003, AJ, 125, 2531 [NASA ADS] [CrossRef] [Google Scholar]
- Ribas, Á., Bouy, H., & Merín, B. 2015, A&A, 576, A52 [NASA ADS] [CrossRef] [EDP Sciences] [Google Scholar]
- Rudolph, A. L., Brand, J., de Geus, E. J., & Wouterloot, J. G. A. 1996, ApJ, 458, 653 [NASA ADS] [CrossRef] [Google Scholar]
- Salpeter, E. E. 1955, ApJ, 121, 161 [Google Scholar]
- Sana, H., Gosset, E., Nazé, Y., Rauw, G., & Linder, N. 2008, MNRAS, 386, 447 [NASA ADS] [CrossRef] [Google Scholar]
- Sana, H., de Mink, S. E., de Koter, A., et al. 2012, Science, 337, 444 [Google Scholar]
- Sana, H., de Koter, A., de Mink, S. E., et al. 2013, A&A, 550, A107 [NASA ADS] [CrossRef] [EDP Sciences] [Google Scholar]
- Sandell, G., Weintraub, D. A., & Hamidouche, M. 2011, ApJ, 727, 26 [NASA ADS] [CrossRef] [Google Scholar]
- Siess, L., Dufour, E., & Forestini, M. 2000, A&A, 358, 593 [Google Scholar]
- Skrutskie, M. F., Cutri, R. M., Stiening, R., et al. 2006, AJ, 131, 1163 [NASA ADS] [CrossRef] [Google Scholar]
- Taylor, J. H., & Cordes, J. M. 1993, ApJ, 411, 674 [NASA ADS] [CrossRef] [Google Scholar]
- Testi, L., Palla, F., & Natta, A. 1999, A&A, 342, 515 [NASA ADS] [Google Scholar]
- Thé, P. S., de Winter, D., & Perez, M. R. 1994, A&AS, 104, 315 [NASA ADS] [Google Scholar]
- Trundle, C., Dufton, P. L., Hunter, I., et al. 2007, A&A, 471, 625 [NASA ADS] [CrossRef] [EDP Sciences] [Google Scholar]
- Valdes, F., Gupta, R., Rose, J. A., Singh, H. P., & Bell, D. J. 2004, ApJS, 152, 251 [NASA ADS] [CrossRef] [Google Scholar]
- van Leeuwen, F. 2007, A&A, 474, 653 [NASA ADS] [CrossRef] [EDP Sciences] [Google Scholar]
- Vilchez, J. M., & Esteban, C. 1996, MNRAS, 280, 720 [NASA ADS] [CrossRef] [Google Scholar]
- Vink, J. S., Drew, J. E., Harries, T. J., & Oudmaijer, R. D. 2002, MNRAS, 337, 356 [NASA ADS] [CrossRef] [Google Scholar]
- Vink, J. S., Harries, T. J., & Drew, J. E. 2005, A&A, 430, 213 [NASA ADS] [CrossRef] [EDP Sciences] [Google Scholar]
- Vos, D. A. I., Cox, N. L. J., Kaper, L., Spaans, M., & Ehrenfreund, P. 2011, A&A, 533, A129 [NASA ADS] [CrossRef] [EDP Sciences] [Google Scholar]
- Walborn, N. R., & Fitzpatrick, E. L. 1990, PASP, 102, 379 [NASA ADS] [CrossRef] [Google Scholar]
- Wegner, W. 2006, MNRAS, 371, 185 [NASA ADS] [CrossRef] [Google Scholar]
- Wegner, W. 2007, MNRAS, 374, 1549 [NASA ADS] [CrossRef] [Google Scholar]
- Weilbacher, P. M., Streicher, O., Urrutia, T., et al. 2012, in SPIE Conf. Ser., 8451 [Google Scholar]
- Wouterloot, J. G. A., Brand, J., & Henkel, C. 1988, A&A, 191, 323 [NASA ADS] [Google Scholar]
- Yusof, N., Hirschi, R., Meynet, G., et al. 2013, MNRAS, 433, 1114 [NASA ADS] [CrossRef] [Google Scholar]
- Zickgraf, F.-J. 1998, in B[e] stars, eds. A. M. Hubert, & C. Jaschek, 233, 1 [Google Scholar]
- Zickgraf, F.-J., Wolf, B., Stahl, O., Leitherer, C., & Klare, G. 1985, A&A, 143, 421 [NASA ADS] [Google Scholar]
- Zinnecker, H., McCaughrean, M. J., & Wilking, B. A. 1993, in Protostars and Planets III, 429 [Google Scholar]
All Tables
All Figures
|
Fig. 1 Left: composite VRI color image (1.7′ × 1.7′) of the five MUSE fields covering the cluster SH 2-266, the central star MWC 137, and its circumstellar nebula. Right: spatial distribution of the brightest cluster stars (blue diamond in the center: MWC 137; black squares: A- and B-type stars; red squares: F- and G-type stars; black open squares: unclassified stars; arrow: jet extension, see Sect. 3.4). The stars for which a spectral type was obtained are indicated with a number, which is consistent with Table 2. |
| In the text | |
|
Fig. 2 Voronoi diagram of E(B–V) based on the extended nebular Hα/Hβ ratio, binned to a signal-to-noise ratio of 200 per polygon. The color coding is linear between E(B–V) = 0 mag (white) and E(B–V) = 1.8 mag (black). The extinction is highest close to MWC 137 and along the rim of the nebula, tracing the dust. It decreases toward the outskirts of the cluster. The white spots are stars and MWC 137 is saturated. This diagram serves as illustration. For absolute extinction values, individual spectra were examined (Sect. 3.2). |
| In the text | |
|
Fig. 3 Extinction map toward the stars classified in Sect. 3.2. The extinction was determined based on the comparison of their spectral energy distributions to UVES POP and Indo-US template spectra. |
| In the text | |
|
Fig. 4 Spectra of the brightest cluster stars extracted from the MUSE data cube. The spectrum #1 is of MWC 137. Spectra #2 to #23 are B- and A-type stars in the cluster. Their spectral classification, indicated next to each spectrum, was based primarily on the Hα, Hβ, and O i 7774 equivalent widths. Spectra #24 to #39 are F- and G-type stars. Their classification is based primarily on the Ca ii 8542 and Na i 5889 equivalent widths. The numbering is consistent with Table 2 and Fig. 1. Gray areas block regions of the spectra with strong residuals from the telluric bands correction. |
| In the text | |
|
Fig. 5 Equivalent widths of the narrow component of the DIB at 5780 Å correlates linearly with our E(B–V) estimates determined in Sect. 3.2 (black squares). The E(B–V) values calculated from our equivalent widths using the relations in Friedman et al. (2011) and Vos et al. (2011) are also shown (gray points and gray stars). The offset of ~0.25 mag between the calculated and our values is probably due to different equivalent measurement procedures. Our procedure includes some of the broad component of the DIB so that we overestimate the equivalent widths. |
| In the text | |
|
Fig. 6 MV versus V–I color–magnitude diagram of the brightest SH 2-266 cluster stars derived from the MUSE data. Black squares are B- and A-type stars, and red squares are cooler F- and G-type stars, corrected for their individual extinction. The arrow at MWC 137 indicates the positions in the color–magnitude diagram from the average inner cluster estimate of E(B–V) = 1.2 mag to the estimate for MWC 137 of E(B–V) ~ 1.8 mag. The open gray squares are unclassified stars corrected for a standard extinction of E(B–V) = 1.2 mag. Theoretical stellar evolution isochrones for 1 Myr, 10 Myr, and 15 Myr (gray dashed curves) and the evolutionary paths for 10 M⊙, 15 M⊙, and 20 M⊙ stars from the Geneva stellar models are shown (Ekström et al. 2012; Yusof et al. 2013). 1 Myr and 10 Myr pre-main sequence theoretical isochrones for star masses of 0.1–7 M⊙ from Siess et al. (2000) are also shown (gray dotted curve). |
| In the text | |
|
Fig. 7 J–H versus H–K color–color diagram from the UKIDSSDR8PLUS database. Black squares are B- and A-type stars, red squares are cooler F- and G-type stars. The open gray squares are unclassified stars. The theoretical stellar evolution isochrone for 5 Myr from the Geneva stellar models is shown (Ekström et al. 2012; Yusof et al. 2013). MWC 137, #10, #23, #25, and #28 are saturated in the UKIDSS images, and their JHK values were obtained from the 2MASS point source catalog (Cutri et al. 2003; the 2MASS catalog does not contain the star #10, which is thus not displayed here). See text for details. |
| In the text | |
|
Fig. 8 Composed image showing the jet in [N ii] 6583. The upper and lower panels are velocity-binned images from 600 s exposures (−405 km s-1 to −234 km s-1 for the upper and 336 km s-1 to 507 km s-1 for the lower panel). The middle panel is one channel map (at −376 km s-1) of a 300 s exposure. Knots along the jet trace are labeled “a” to “f”. Other knot-like features coincident with the jet trace have stellar spectra. |
| In the text | |
|
Fig. 9 Spectrum of knot “c” and the nebula. The strong [N ii], [S ii], and [O i] emission lines are from the extended nebula. The weaker emission at about −320 km s-1 with respect to these nebular lines are the emission lines originating in the knot (indicated by small marks). |
| In the text | |
Current usage metrics show cumulative count of Article Views (full-text article views including HTML views, PDF and ePub downloads, according to the available data) and Abstracts Views on Vision4Press platform.
Data correspond to usage on the plateform after 2015. The current usage metrics is available 48-96 hours after online publication and is updated daily on week days.
Initial download of the metrics may take a while.