Free Access
Fig. 9
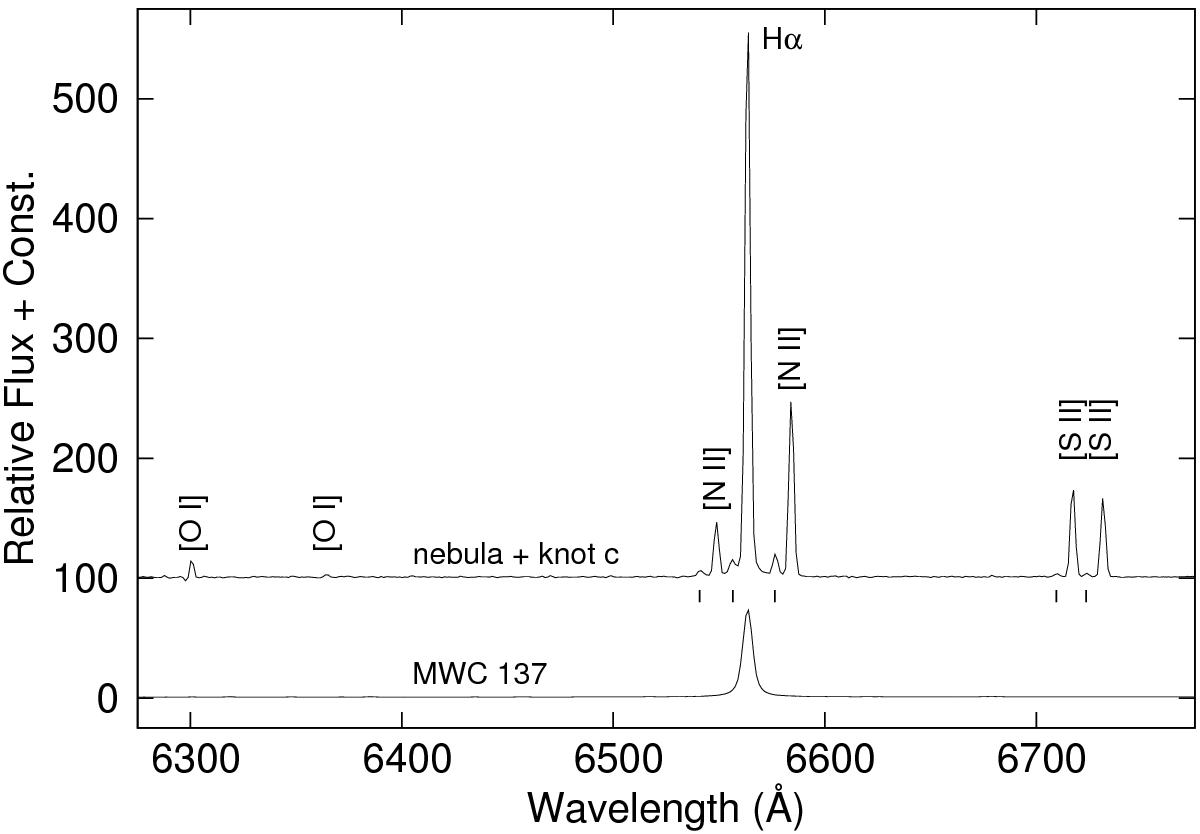
Spectrum of knot “c” and the nebula. The strong [N ii], [S ii], and [O i] emission lines are from the extended nebula. The weaker emission at about −320 km s-1 with respect to these nebular lines are the emission lines originating in the knot (indicated by small marks).
Current usage metrics show cumulative count of Article Views (full-text article views including HTML views, PDF and ePub downloads, according to the available data) and Abstracts Views on Vision4Press platform.
Data correspond to usage on the plateform after 2015. The current usage metrics is available 48-96 hours after online publication and is updated daily on week days.
Initial download of the metrics may take a while.