Fig. 8
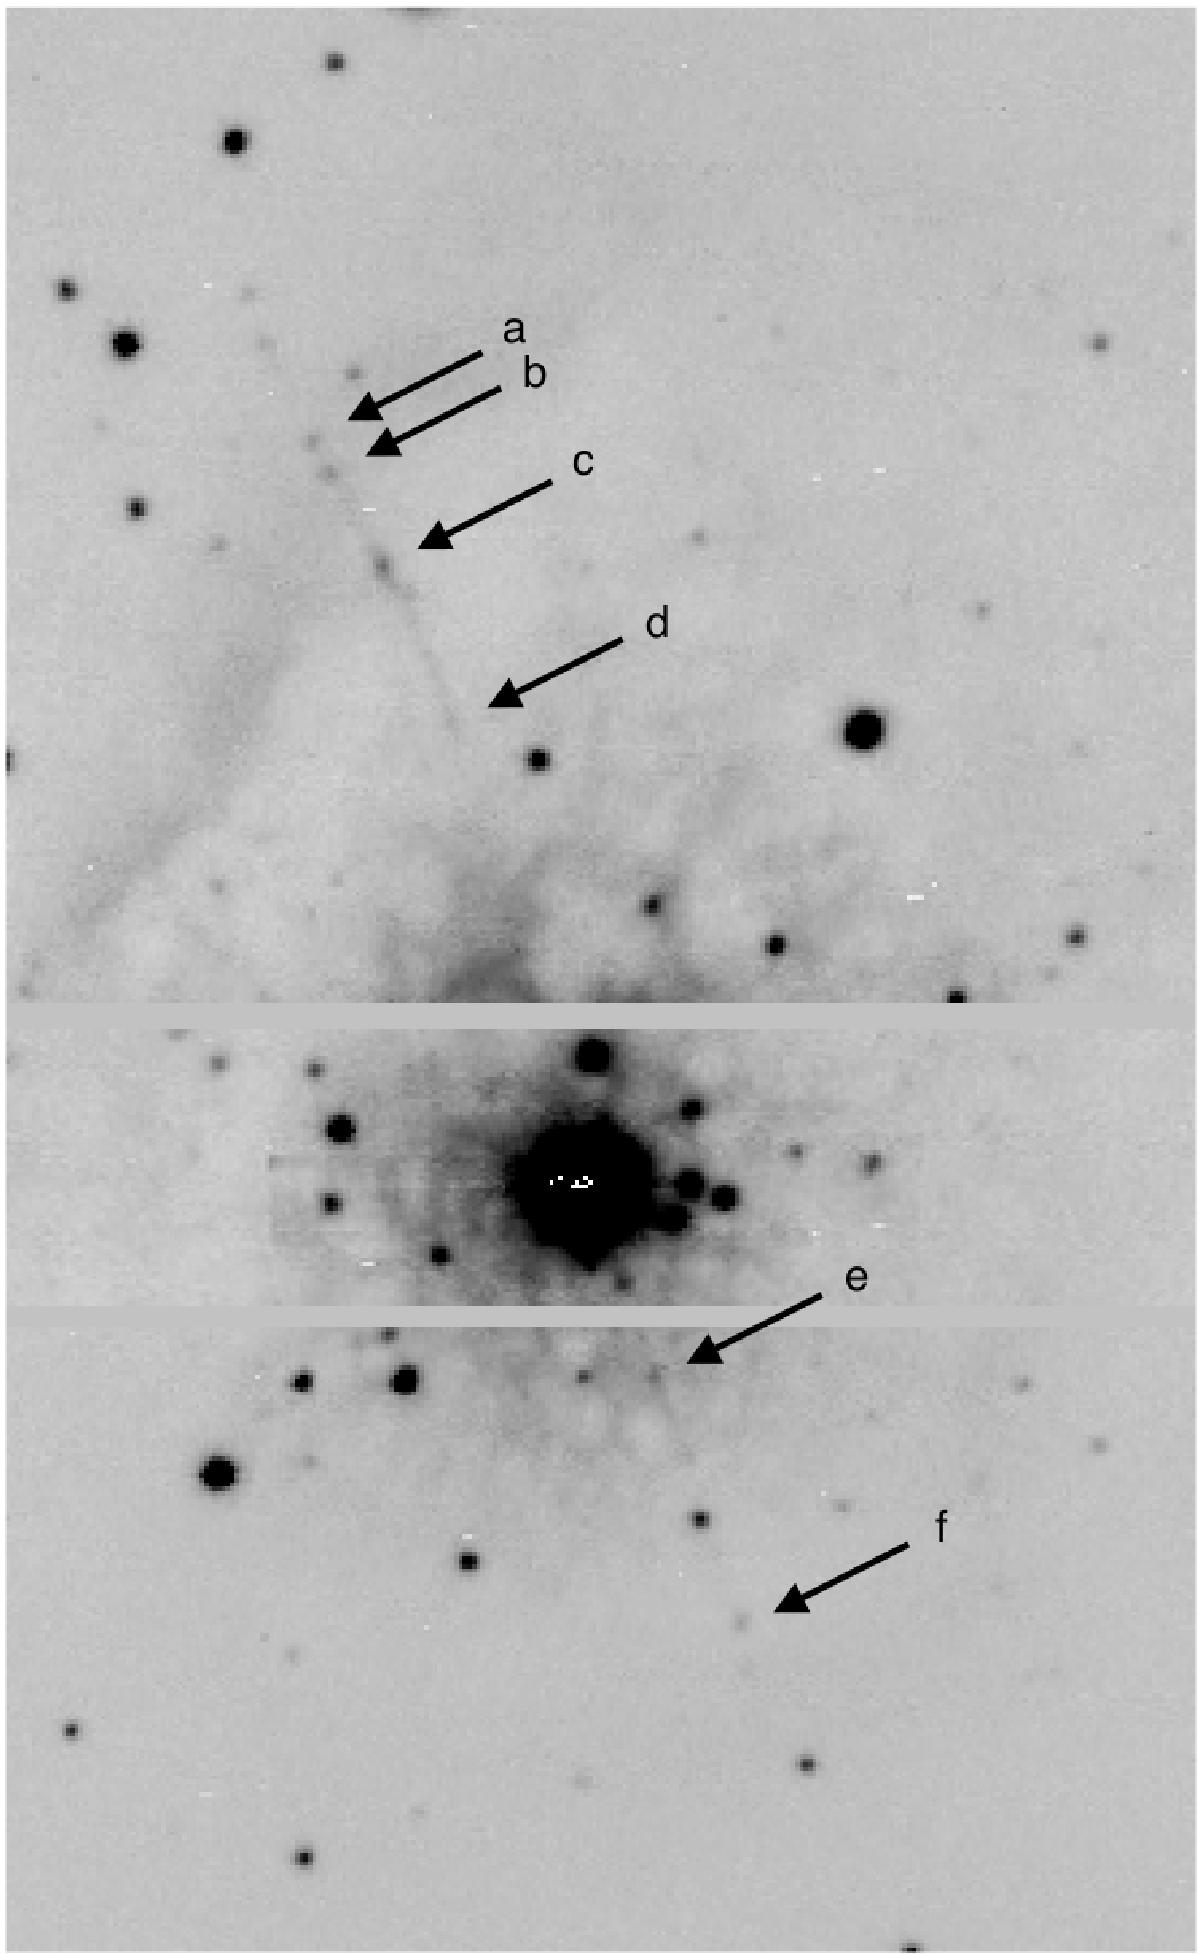
Composed image showing the jet in [N ii] 6583. The upper and lower panels are velocity-binned images from 600 s exposures (−405 km s-1 to −234 km s-1 for the upper and 336 km s-1 to 507 km s-1 for the lower panel). The middle panel is one channel map (at −376 km s-1) of a 300 s exposure. Knots along the jet trace are labeled “a” to “f”. Other knot-like features coincident with the jet trace have stellar spectra.
Current usage metrics show cumulative count of Article Views (full-text article views including HTML views, PDF and ePub downloads, according to the available data) and Abstracts Views on Vision4Press platform.
Data correspond to usage on the plateform after 2015. The current usage metrics is available 48-96 hours after online publication and is updated daily on week days.
Initial download of the metrics may take a while.