| Issue |
A&A
Volume 584, December 2015
|
|
|---|---|---|
| Article Number | A117 | |
| Number of page(s) | 16 | |
| Section | Planets and planetary systems | |
| DOI | https://doi.org/10.1051/0004-6361/201527083 | |
| Published online | 02 December 2015 | |
Modelling the internal structure of Ceres: Coupling of accretion with compaction by creep and implications for the water-rock differentiation
1 Deutsches Zentrum für Luft- und Raumfahrt (DLR), Institut für Planetenforschung, Rutherfordstr. 2, 12489 Berlin, Germany
e-mail: This email address is being protected from spambots. You need JavaScript enabled to view it.
2 Westfälische Wilhelms-Universität Münster, Institut für Planetologie, Wilhelm-Klemm-Str. 10, 48149 Münster, Germany
Received: 29 July 2015
Accepted: 5 October 2015
Abstract
Aims. We model the compaction of a Ceres-like body that accretes from the protoplanetary dust as a porous aggregate. To do this, we use a comprehensive numerical model in which the accretion starts with a km-size seed and the final radius reaches ≈500 km. Our goal is to investigate the interplay of accretion and loss of porosity by hot pressing. We draw conclusions for the evolution of the porosity profile and the present-day porosity distribution on Ceres. In particular, we test the hypothesis that Ceres’ low density can be explained by a porous interior instead of by the presence of ice, and whether compaction occurs due to creep or due to dehydration of hydrated minerals.
Methods. We extended our thermal evolution model from previous studies to model compaction of an accreting asteroid that is initially porous. We considered two different compositions of Ceres suggested by other workers. The porosity change was calculated according to the thermally activated creep flow. Depending on the composition, parameters relevant for compaction were changed self-consistently with the mineral phases.
Results. We find that compaction of initially porous Ceres is dominated by creep and only slightly perturbed by the dehydration. In particular, dehydration alone cannot lead to compaction because creep can occur before the dehydration. Depending on the accretion duration, timing of the compaction varies from between a few million years and more than one billion years. Thereby, late accretion cannot prevent compaction to an average porosity of <2.5%. We provide the evolution as well as the present-day porosity and temperature profiles for Ceres. The temperature allows for the existence of liquid water in the interior of Ceres at a depths of ≥5−33 km. Depending on the composition, either iron melt is produced regardless of the accretion timing or only for an accretion within the first 4 Ma relative to calcium-aluminium-rich inclusions. This argues for a small metallic core.
Key words: conduction / planets and satellites: composition / planets and satellites: formation / planets and satellites: interiors / accretion, accretion disks / minor planets, asteroids: individual: Ceres
© ESO, 2015
1. Introduction
Ceres is the largest body in the asteroid belt with a radius of almost 500 km. It orbits the Sun with a semi-major axis of 2.7654 AU. Considered as a protoplanet along with Pallas and Vesta (e.g., Russell et al. 2004; McCord et al. 2006), Ceres can be considered as one of the few remaining witnesses of the process of planetary accretion.
Based on the surface composition inferred from spectroscopy, the primordial material of Ceres is expected to have a nearly carbonaceous chondritic composition (e.g., Rivkin et al. 2006). Aqueous alteration detected on the surface could be the result of eruptions driven by interior aqueous activity and subsequent sublimation of ice from the surface. Alternative scenarios involve production of water from an ice-silicate mixture that is heated by impacts with the subsequent hydration of pre-existing anhydrous silicates, as well as a direct condensation of hydrous minerals due to the presence of water vapour in the solar nebula. Numerical models (McCord & Sotin 2005; Castillo-Rogez & McCord 2010) suggest that the asteroid itself must have formed during the first ≈10 million years of the solar system.
Composition, mass, and volume fractions of the constituents, and further key parameters for modelling Ceres’ compaction.
One of Ceres’ remarkable properties is a relatively low average density of 2040−2250 kg m-3 (Thomas et al. 2005; Carry et al. 2008). On one hand, this low value can be explained by the presence of a low-density phase (McCord & Sotin 2005; Castillo-Rogez & McCord 2010) if a nearly chondritic composition is assumed. Previous numerical models (McCord & Sotin 2005; Castillo-Rogez & McCord 2010) have suggested that this could be water ice that differentiated from the rocky component early in Ceres’ evolution due to heating mainly by 26Al. Thus, Ceres could have produced a rocky core, a water ocean, and an upper ice layer below a dusty crust. The low bulk density is then consistent with a global ice mass fraction of 13−27% if the average porosity is negligible (see Fig. 1 in McCord & Sotin 2005).
An alternative explanation of the low density has been proposed by Zolotov (2009), who favoured an undifferentiated structure and questioned the existence of free water in Ceres. He suggested that Ceres could be made of hydrated minerals formed as a result of extensive oxidation of carbonaceous chondritic material (which has zero porosity and, thus, both an intrinsic and bulk density that matches that of Ceres), or of a homogeneous mixture of a closely CI chondritic material that retained a significant porosity of 5−15%, without being differentiated. It should be noted that based on the shape and the moment of inertia of Ceres, no distinction between a porous and a differentiated structure is possible (Thomas et al. 2005; Carry et al. 2008). Compaction of an initially porous Ceres made of hydrated CI chondritic minerals was estimated by Zolotov (2009) based on a comparison with porosities of sandstones at pressures ≈150 MPa. This comparison disregards specific material properties such as the creep activation energy of hydrated minerals and the effective pressure, which is much higher as a result of the porosity than the lithostatic pressure.
Castillo-Rogez (2011) argued that a homogeneous Ceres with a substantial porosity is not likely. The author modelled the thermal evolution of Ceres in 1D including the effect of latent heat of dehydration and dehydroxilation, considering thereby two composition models proposed by Zolotov (2009) (for the sake of brevity, here and in the following, the term “hydration” is a proxy for any kind of aqueous alteration, and the term “dehydration” is a proxy for both the dehydration and the dehydroxylation reactions). Castillo-Rogez (2011) suggested that the dehydration of hydrated minerals would destroy the pores and that subsequent differentiation of the water phase would be inevitable. Furthermore, she noted that silicate relaxation by creep could contribute to the reduction of porosity. However, the author did not explicitly model this or any other kind of compaction process.
Parameter values used to simulate the radioactive heat production by the short- and long-lived isotopes.
The idea of a porous Ceres as such (Zolotov 2009) necessitates self-consistent modelling of the evolution of the porosity in a continuously accreting body to obtain the set of parameters reproducing this idea (a porosity profile leading to an average porosity of ≈10% for the model termed CIa here, cp. Table 1). The same necessity holds for the alternative composition (termed CIb here, cp. Table 1) proposed by Zolotov (2009). Here, plausible parameters must be determined that lead to a complete reduction of the porosity of Ceres that accretes from hydrated carbonaceous chondritic material. Furthermore, the evolution of the porosity is also important for the differentiated ice-rock end member models. Here, on one hand, the melting temperature of ice is too low to close the pores in the silicate fraction by creep processes before the differentiation, which means that some porosity will still be available after the melting of ice. On the other hand, the ice-rock differentiation could proceed in the porous flow regime, making compaction of the silicate matrix by creep (at higher temperatures than the melting point of the ice) necessary for water to extrude.
We here calculate thermal models for Ceres and draw conclusions about Ceres’ porosity profile, the metamorphism of the interior, and the present-day state. To do this, we extended the numerical code from Neumann et al. (2012), which computes the thermal and structural evolution of planetesimals including compaction of the initially porous primordial material (modelled using a creep law) and the coupling of this process with a continuous accretion. In particular, we investigate the evolution of the interior assuming an initially porous structure. We show that creep is the predominant mechanism of porosity reduction and that compaction by creep takes place at lower temperatures than dehydration for several minerals involved in the compositions considered here. We find, furthermore, that compaction of an initially porous Ceres is dominated by the creep processes and only slightly perturbed by the dehydration. Depending on the accretion duration, timing of the compaction varies by between a few million years and more than one billion years. This means that slow and late accretion cannot prevent compaction to an average porosity of <2.5%. Based on this result, we exclude one of the two mineralogical models (see Zolotov 2009; Castillo-Rogez 2011) as rather unrealistic, and find the second model reasonable for the early Ceres. Furthermore, we provide the evolution as well as the present-day porosity and temperature profiles for Ceres. The temperature evolution allows for the existence of liquid water in the interior in the past as well as today at depths of more than 5−33 km. Depending on the mineralogical model, either accretion within the first 4 Ma relative to calcium-aluminium-rich inclusions (CAIs) results in the production of iron melt, or iron melt is produced regardless of the accretion timing, enabling possible differentiation of a small metallic core. On the basis of our models we show the possible development of Ceres’ internal structure and the present-day state of this object’s interior.
2. Model
In the present study, the thermal evolution and the reduction of the porosity is calculated for a body with a changing size that is initially small and grows to the size of Ceres as a result of accretion.
For the details of the model we refer to some of our previous publications, Neumann et al. (2012, 2014b). In the following, we describe the details of the model that are particularly crucial and specific here.
Our calculations start with a homogeneous km-size cold body that has a uniform average porosity of ≈50%. Two different compositions of a carbonaceous chondritic material are assumed (see Table 1). The material properties vary with the composition, while the amount of radiogenic heating is equal (see Table 2). The accreting porous body grows towards a final radius by accumulating dust. The final radius is larger than that of Ceres because the accumulated material is highly porous. Upon heating, the compaction of the porous material is modelled through a creep law (see Eq. (4)). This reduces the radius and increases the average density. Assuming a certain accretion onset time t0 relative to the formation of the CAIs and accretion duration tac, the main goal is to investigate whether at the end of a simulation (corresponding to the present day) the body would match the radius of Ceres, whether it would have a substantial average porosity, and whether the density would match the observed interval of the average density of 2040−2250 kg m-3.
Numerically, a heat conduction equation with non-constant parameters, a Neumann boundary condition in the centre, and a Dirichlet boundary condition at the surface is solved in radial symmetry on a non-moving frame of reference:  (1)The parameters depend on the composition (e.g., the density ρ and the heat source density Q), temperature T (e.g., the thermal conductivity k and the specific heat capacity cp), and porosity φ (e.g., the density and the thermal conductivity). Simultaneously, the reduction of porosity by hot pressing is obtained from an equation describing a typical creep law (Eq. (4)). We furthermore calculate gravity and pressure profiles, effective stress as a function of porosity, average porosity and density (integrated over the radius), etc.
Following Zolotov (2009) and Castillo-Rogez (2011), we considered two types of material, both consisting of hydrated, nearly CI chondritic minerals. These are the models CIa and CIb, termed “high-density” and “low-density” models in Castillo-Rogez (2011). Table 1 presents their mineralogies as well as some important modelling parameters. Our numerical model computes compaction of porous material and is, thus, very well suited to investigate the scenario proposed by Zolotov (2009). Furthermore, based on both previous observations by the Hubble Space Telescope (e.g., Carry et al. 2008) and recent ones by Dawn (e.g., Beck et al. 2015), minerals involved in the compositions adopted here are most probably present on Ceres and have played an important role in its evolution. The exact abundances of these minerals are not certain, however.
Since porosity and accretion are considered, four different radii are required. These are the initial reference radius (at zero porosity) R0, the final reference radius (at zero porosity) Rf, the initial radius (at the initial non-zero porosity φ0)  , and a theoretical final radius (at the initial non-zero porosity φ0)
  . The radius change R(t) from R0 to Rf that is due to the late runaway accretion appropriate for a body of Ceres’ size, can be described assuming a constant density (porosity) by
  (2)This is a solution of a differential equation for the evolution of the planetary radius and was termed “exponential accretion law” in Neumann et al. (2012). For the derivation of the associated differential equation see Kortenkamp et al. (2000).
To obtain the radius change  from to , we simply replace R by
  everywhere. Thereby,
  and
and  . Finally, the dependence of the actual radius
  on the changes of the porosity during and after the accretion is introduced,
  (3)where φ(t) is the average porosity of the asteroid at time t.
The initial porosity of φ0 ≈ 50% and the intrinsic geometry of the dust assemblage described by the simple cubic packing of uniform spherical grains is reasonably assumed here (see Neumann et al. 2014b). The model computes the loss of porosity by hot pressing using a creep law,  (4)with porosity φ, time t, a constant B = 1.26 × 10⁻¹⁸ m3Pa−3/2 s-1, initial grain size b = 10-6 m, effective stress σ, constants m = 3 and n = 3/2, activation energy E, gas constant R, and temperature T. We refer to Neumann et al. (2014b) for further details.
While in our previous studies the creep activation energy was assumed constant, here E is adjusted upon the compaction of the single minerals according to their activation energies and volume fractions (Table 1, Eq. (5)) during compaction. The compositions adopted here are dominated by phyllosilicates and include further minerals. The phyllosilicates are mostly represented by saponite and serpentine. These minerals have the lowest creep activation energy, and, since their joint volume fraction dominates the primordial porous matrix, they will creep before minerals with higher activation energies. First, the “weakest” mineral phase, that is, the one with the lowest activation energy, starts to compact (assuming sufficiently strong heating). This reduces the local porosity to some lower value until this mineral phase is fully compacted. Then, the activation energy increases to the next highest value, until the corresponding mineral compacts fully, and so on. Mathematically, given a certain sequence of the activation energies E1<...<Ek and the volume fractions v1,...,vk of the corresponding minerals, the activation energy Ej is used in Eq. (4) in the porosity interval  , where φ0>φ1>...>φk = 0 and φj is defined as
  (5)for j = 1,...,k. In this way, species with equal E are grouped. The activation energies Ej and the corresponding porosities φj are shown in Table 1. The behaviour of these minerals during hot pressing is not fully covered in the literature. In particular, the creep activation energy of relatively weak minerals such as serpentine is uncertain. To be conservative, we therefore took an upper bound on E in several cases (making compaction more difficult). The remaining parameters in Eq. (4) were not varied with the mineralogy and correspond to the values used in Neumann et al. (2014b). Implications of a variation of these parameters are discussed in Sect. 4.3.
Thermal conductivities of the species involved.
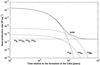 |
Fig. 1 Heat production rate by the short- and long-lived radionuclides per 1 kg of the primordial material. The underlying abundances correspond to a CI chondritic composition and are shown in Table 2. |
The intrinsic thermal conductivity ki is obtained as a geometric mean of the mineral thermal conductivities and their volume fractions (as is appropriate for a mixture of randomly distributed and oriented minerals, see e.g. Beardsmore & Cull 2001). The bulk thermal conductivity kb of a porous assemblage is equal to the product of ki and an exponential term. The thermal conductivity increases by two orders of magnitude from kb to ki when porosity falls from φ = φ0 ≈ 0.5 to φ = 0. The values or functions adopted for the minerals considered are shown in Table 3. The equation describing the specific heat capacity as a function of temperature was adopted from Yomogida & Matsui (1984).
Both long- and short-lived radiogenic nuclides are included as heat sources (Fig. 1). While 26Al and 60Fe are included in most planetesimal evolution models, 53Mn was used in the recent thermal evolution models of Ceres (Castillo-Rogez & McCord 2010; Castillo-Rogez 2011). For the sake of completeness, we included this heat source in the present study. For the two composition models CIa and CIb, the same initial abundances (mass fractions) resulting from measurements on Orgueil CI1 carbonaceous chondrite are taken. The data were taken from Wolf et al. (2012) and Rocholl & Jochum (1993). See Table 2 for an overview.
Important output parameters are the average porosity φ(t) and the average density ρ(t) of the asteroid at time t. These are computed using the equations  and
and  , where Vi is the intrinsic volume (i.e., the volume of the solid material), Vb is the bulk volume (i.e., the volume of the solid material plus the volume of the pores, computed by integrating the porosities at the grid points of the discretisation over the body), and M is the mass of the asteroid.
One of the assumptions made here is the value of R0 = 1 km. An initial radius on the  -scale is a reasonable assumption for the early accretional evolution of a Ceres-size object because this value is certainly higher than the size at which accretion becomes dominated by the mutual gravitational attraction (e.g., Weidenschilling 1988; Chambers & Halliday 2014). The value of Rf is determined from the present-day radius and from an assumption on the present-day average porosity φtoday of Ceres:
 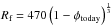 km. For model CIa (Castillo-Rogez 2011), the present-day average porosity of φtoday = 10% is assumed following Zolotov (2009) (consequently, a final reference radius of 454 km). We show below, however, that compaction is almost complete for these cases. For model CIb, a present-day average porosity of φtoday = 1% is a reasonable assumption because the density of Ceres is reproduced only then. Thus, a final reference radius of 468 km is assumed for CIb. The assumed present-day average porosity simply corresponds to a variation of , and small perturbations of the assumed value do not influence the results of the present investigation to a notable extent.
We assumed here that accreting Ceres is partially hydrated. Although no impact heating is involved in the model, the accretion should, in fact, proceed as a result of the collisions of the modelled object with smaller planetesimals. Thus, a further assumption on the pre-processing in these smaller planetesimals leading to the hydration of the minerals in their rock fraction needs to be made. As a consequence of the specific accretion law adopted here (see Eq. (2)), accretion of pre-processsed planetesimals is less likely in the first ≈90% of the accretion duration, but more likely upon entering the runaway accretion phase. Assuming an accretion duration of 1 Ma starting at t0 = 1 Ma after the CAIs, the average radius of an impactor delivered per year during accretion increases to ≈2.2 km at t = t0 + 0.5 Ma (see Šrámek et al. 2012 for the equations giving an impactor mass). Using the parameters of model CIa from Table 1, the temperature in such an impactor (whose evolution also starts at 1 Ma after the CAIs) remains below 400 K. This means that although this temperature allows for the existence of free water for a rather short period of time and hydrated minerals can form in principle, the heating is not sufficient to dehydrate them. Although this impactor experiences some compaction by creep, a substantial average porosity of ≈26% remains according to our calculations. A further uncertainty is the loss or gain of the average porosity during impacts that is due to heating or fractures, which is not considered here. Moreover, an impactor of a certain size and a corresponding mass inferred from Eq. (2) is only a measure for the mass accumulated by the proto-Ceres on average per year at a certain time instance during the accretion. In fact, this mass could be delivered by a number of much smaller objects that did not experience any metamorphism. Thus, based on the above estimates, the only pre-processing of the material before the accretion assumed here is the formation of hydrated minerals that accrete at the surface of the proto-Ceres as such. Alternatively, water vapour available for reactions in the primitive solar nebula could have led to direct condensation of hydrous minerals.
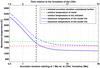 |
Fig. 2 Maximum (central) temperature for a varying accretion duration. The accretion starts at t0 = 1 Ma relative to the formation of the CAIs. The accretion durations considered here vary between tac = 0.5 Ma and tac = 50 Ma. |
In Neumann et al. (2012, 2014b) we used an activation energy of 356 kJ mol-1 (85 kcal mol-1) calculated by Schwenn & Goetze (1978) for olivine. Compaction took place in this model at a temperature of about 700 K. On the other hand, a creep activation energy of 356 kJ mol-1 is rather high for a carbonaceous chondritic composition, which is dominated by phyllosilicates/serpentine. The activation energies of species involved (in particular hydrated minerals) vary from  (serpentine, see Hilairet et al. 2007) to
  by one order of magnitude, for instance, E = 251 kJ mol-1 corresponding to hematite (see Siemes et al. 2011). Consequently, compaction will proceed at lower temperatures and will be much more efficient than in the case of an olivine-dominated ordinary chondritic composition.
3. Results
Calculations were performed for the two compositions described above. In both cases, the accretion duration tac was varied between 0.5 Ma and 50 Ma. Figure 2 shows the maximum temperatures reached in these simulation runs as functions of the accretion duration for the two models CIa and CIb.
Because of their short half-life time, the radioactive isotopes 26Al, 60Fe, and 53Mn provide an early, intense, but short-lived heat pulse, which is orders of magnitude higher than the energy released by the decay of the long-lived nuclides (see Fig. 1). After ≈20 Ma relative to the formation of the CAIs, the heat production rate becomes dominated by the long-lived nuclides. These provide a much weaker heating, which is, however, active over the entire evolution of Ceres until present. Thus, two different paths can be defined for the evolution of a Ceres-like body. In general, a very fast and early accretion within the first million of years after the CAIs leads to peak temperatures that exceed the solidus of ≈1425 K and even the liquidus of ≈1850 K of dry silicates in the entire body (see Fig. 2). Such strong heating associated with large amounts of melting suggests the formation of a basaltic crust. However, present observations of Ceres’ surface do not indicate a crust produced by extrusive igneous processes. Furthermore, for an ice-rich initial composition, water ice would melt rapidly and the water would evaporate and escape the accreting body, leaving a dry, dense, and much smaller Vesta-like object behind. On the other hand, if heating above the solidus or even liquidus of dry silicates were confined to the central part of Ceres, metal-silicate differentiation should not have affected the shallow layers and the surface. Based on the above arguments, we do not consider early and fast accretion as reasonable for Ceres. Only those combinations of t0 + tac for which no melting of dry silicates is possible, that is, for which the maximum temperature will remain below ≈1420 K, are preferred. Such relatively low temperatures are obtained for an accretion onset time of 1 Ma after the CAIs and an accretion duration of at least 2 Ma. For this reason, we enforced that accretion is completed after at least 3 Ma after the CAIs by using an accretion onset time of t0 = 1 Ma after the CAIs and varied the accretion duration by between 2 Ma and 50 Ma. Depending on the accretion duration, the evolution follows a specific path and is mainly independent of the composition adopted. In the following, we describe two extreme paths, both with an accretion onset time of t0 = 1 Ma relative to CAIs, following either a “fast” accretion tac = 2 Ma, or a “slow” accretion with tac = 50 Ma. The difference in the accretion duration will, in particular, emphasise the role of the short-lived nuclides in the evolution of Ceres. We note that all times given in Sects. 3.1 and 3.2 are relative to the accretion onset time t0 unless stated otherwise.
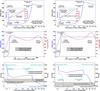 |
Fig. 3 Temperature, radius, porosity, and density assuming a fast accretion within 2 Ma for model CIa (left column) and CIb (right column). Upper row: evolution of the radius (main plots) and early evolution of the radius and of the central temperature (subplots). Middle row: evolution of the central temperature and of the radius. Bottom row: evolution of the central porosity/density (dashed lines) and average porosity/density (solid lines). The grey area indicates the average density of Ceres according to our present knowledge. |
There are several factors that have important effects on the creep of minerals and that could shift compaction to higher or lower temperatures. These factors have been discussed in detail in Neumann et al. (2014b). Here, we emphasise the intensity of heating, the duration of heating, and the intensity of pressing. For example, a high enough pressure P acting on a porous medium at a high temperature T can reduce porosity very quickly, while extended heating may still lead to compaction for a lower temperature. In general, high values of P and T as well as prolonged heating work towards loss of porosity, while low P and T and a short duration of the heating phase do not. Thereby, an unfavourable value of one parameter can be compensated for by the others. Thus, throughout the models CIa and CIb and different accretion durations (corresponding to different heating rates) the compaction behaviour will not be identical, although similarities can be observed.
Of particular interest is the evolution of the average porosity and average density. The change of these parameters is controlled by the interplay of accretion and compaction. In general, slow accretion and strong heating lead to an increase of the average density and a decrease of the average porosity. While porous material is added at the surface, central regions can compact sufficiently fast. Assuming a late runaway accretion scenario, this will be the case in the beginning of the accretion while proto-Ceres is still very small. Later on, an increased accretion rate cannot be compensated for by the compaction, reversing the behaviour of the average porosity and density (the porosity increases, the density decreases). This will be the case until the accretion is completed, and no porous material is added at the surface any more. Thereafter, only compaction by creep influences the porosity and the density, leading to an increase of the latter, almost up to the intrinsic density of the respective composition. The average density will not reach the exact value of the intrinsic density because the surface will remain porous. The upper scenario applies, in general, to both compositional models and to any of the accretion durations considered here (although the timing and the absolute values vary).
3.1. Fast accretion with t0 = 1 Ma and tac≈ 2 Ma
Here, the loss of porosity is achieved fast within the first 3.5 Ma based on a rapid temperature increase that is due to the heating by short-lived nuclides. The particular compaction behaviour, that is, the specific temperatures at which certain values of porosity (or density) are reached, as well as the timing, strongly depend on the composition (activation energies, volume fractions of the minerals, intrinsic density of the model) and, thus, on the model under consideration.
3.1.1. Fast accretion: Model CIa
In the following, we first consider the “high-density” model of Castillo-Rogez (2011) termed here CIa. We plot the results in Fig. 3, left column. See also Table 4 for an overview.
Starting with a radius of 1.24 km and a temperature of 150 K, the seed follows the evolution shown in Fig. 3 (left column, upper panel). During the first half of the accretion time, the radius remains smaller than 20 km. It grows to ≈180 km within ≈0.84tac, followed by a rapid increase in the final phase, when 95% of the body mass accretes in about 16% of the accretion duration. After ≈0.007 Ma, the radius has increased by ≈25 m and the temperature to above ≈200 K. This temperature is sufficient to allow creep of the weakest minerals with activation energies of 88 kJ mol-1 (serpentine, pyrene). By 0.024 Ma, a radius of 1.294 km, and a central temperature of 270 K, the central porosity has decreased to 30% (Fig. 3, left column, bottom panel). By that time, the two weakest minerals have compacted completely. The dehydration temperature of ≈775 K of serpentine is not nearly reached. A further temperature increase is necessary for the remaining minerals to compact. From 0.033 Ma, a radius of 1.304 km, and a central temperature of 300 K, compaction proceeds, due to creep of montmorillonite and halite, with activation energies of 105 kJ mol-1. These mineral phases compact rather fast. By 0.04 Ma, a radius of 1.315 km, and a central temperature of 322 K, the central porosity falls to 18% (as in the case of serpentine, montomorillonite phase compacts before its dehydration temperature of ≈1070 K is reached). Here, compaction stalls again until the temperature rises to ≈350 K (t = 0.05 Ma, Rp(t) = 1.334 km). Compaction of mirabilite (E = 126 kJ mol-1) decreases the porosity to ≈13% by t = 0.062 Ma, Rp(t) = 1.367 km, and Tc = 375 K. The central density is 2120 kg m-3 by that time, while the average density of the seed is 1700 kg m-3. However, mirabilite should have dehydrated at ≈305 K (Castillo-Rogez 2011) before compaction. Even more heating and time is needed for the creep of magnetite: porosity falls from 13% to 8% in the range of 0.120−0.220 Ma, 1.569−2.117 km, and 445−526 K (the central density being 2248 kg m-3, the average density 1924 kg m-3, and the average porosity 21.45%). The final closure of pores around the centre by the creep of epsomite follows in the range of 0.320−0.53 Ma, 2.875−5.41 km, and 587−720 K. Again, this temperature is higher than the dehydration temperature of 353 K of epsomite (Castillo-Rogez 2011). The average porosity is 20.90%, while the average density is 1937 kg m-3. As for mirabilite, epsomite compacted after its dehydration temperature of ≈350 K was exceeded.
The porosity at different locations than the centre roughly follows the pattern described above, in particular, it follows the temperature profile. While at shallower depths the temperature and the pressure are lower than in the centre, a longer exposure to these conditions leads to the compaction of the specific minerals at lower temperatures (or temperature intervals) than those valid for the centre.
From the onset of accretion, the average porosity globally decreased while the average density increased as a result of compaction and a rather low accretion rate. However, after attaining a minimum of 19.70% at 0.385 Ma and Rp(t) = 3.49 km, the average porosity increased again because compaction did not compensate for the increasing accretion rate. It increased to 25.91% (average density of 1814 kg m-3) at the completion of the accretion. Here, the radius reached 501 km while the temperature decreased from 1250 K in the centre to 150 K at the surface.
After the end of accretion no more porous material is added to the asteroid. Thus, only compaction by creep influences the porosity, which decreases more rapidly. After 0.04 Ma φ(t) = 20% (ρ(t) = 1960 kg m-3, Rp(t) = 489 km), and after 0.434 Ma φ(t) = 10% (ρ(t) = 2200 kg m-3, Rp(t) = 470 km) at Tc = 1309 K are obtained.
While at this moment the average density and radius are approximately equal to the present-day estimates of Ceres’ density and mean radius, further evolution leads to an additional reduction of pores and, eventually, to an average porosity lower than 1% (ρ(t) ≈ 2425 kg m-3) by t0 + 3.694 = 4.694 Ma after the CAIs. Neither the final radius of ≈455 km nor the final average density of ≈2434 kg m-3 reached by t0 + 7.1 = 8.1 Ma fit the size and the density of Ceres.
Data describing the circumstances of compaction at the centre of the proto-Ceres for t0 = 1 Ma relative to CAIs and tac = 2 Ma.
3.1.2. Fast accretion: Model CIb
The second model CIb with the same t0 and tac displays a similar behaviour in general (see Fig. 3, right column and Table 4). Upon reaching certain temperatures, minerals with the respective activation energies deform by hot pressing, which reduces the local porosities to the respective porosity values shown in Table 1. Since the mineral phases as well as their creep activation energies and porosity intervals (see Table 1 and Eq. (5)) differ from the CIa model, the absolute values of the results are different to some extent. The pores around the centre close in five compaction steps. Compaction of saponite and pyrene (0.007−0.038 Ma, 200−317 K) is followed by mirabilite (0.042−0.057 Ma, 330−377 K), gypsum (0.172−0.190 Ma, 550−670 K), hematite (0.190−0.216 Ma, 670−710 K), and, finally, epsomite (0.216−0.284 Ma, 710−782 K). In these steps, the porosity around the centre falls from its initial value, corresponding to the porosity intervals from Table 1. Thereby, saponite compacts before it could dehydrate at ≈1070 K, while the other hydrated phases of model CIb compact after reaching their dehydration temperatures. Similar to model CIa, this is partly due to a low internal pressure in a km-size seed.
During accretion, after reaching a minimum of 32.08% at 0.472 Ma and Rp(t) = 4.866 km, the average porosity increases again (due to a higher accretion rate). At the end of accretion, its value is 37.77% (average density of 1394 kg m-3). Here, the radius reaches 550 km, while the temperature varies between 1364 K in the centre and 150 K at the surface. Subsequent compaction of the interior reduces the porosity to 20% after 0.8 Ma (ρ(t) = 1694 kg m-3, Rp(t) = 516 km) and to 10% after 1.186 Ma (ρ(t) = 2014 kg m-3, Rp(t) = 487 km) at Tc = 1309 K. Finally, the average porosity falls below 1% by t0 + 3.843 = 4.843 Ma (ρ(t) ≈ 2218 kg m-3, Rp(t) = 471 km) and settles at 0.6% by t0 + 4 = 5 Ma. The final density and the final radius both closely match those of the present-day Ceres, making model CIb and the corresponding scenario more probable than model CIa.
3.2. Slow accretion with t0 = 1 Ma and tac = 50 Ma
The choice of tac = 50 Ma results in an extremely slow and late accretion. Here, we show that even the lack of intense heating by short-lived nuclides cannot prevent a temperature increase above 1000 K in the centre. Thus, no substantial average porosity will remain. However, the initially strong heating by short-lived nuclides is followed by a cooling phase. Continuous heating by long-lived nuclides increases the temperature very slowly, and very slow compaction takes place over up to 1600 Ma.
3.2.1. Slow accretion: Model CIa
The early evolution of model CIa (first ≈0.1 Ma of the accretion) in this case bears some similarities to the scenario described above in Sect. 3.1.1 (cp. Fig. 4, left column, upper panel with Fig. 3, left column, upper panel). These are a decrease of the radius due to compaction despite ongoing accretion, decrease of the average porosity, and increase of the average density. However, the picture during the following growth is characterised by the interplay of accretion, heating, and compaction.
On an almost identical timescale, the weakest mineral phases (serpentine, pyrene, montmorillonite, halite, and mirabilite) compact around the centre at temperatures below 376 K. Subsequently, the central temperature increases further to 415 K by 0.135 Ma and Rp(t) = 1.11 km. This radius is only half as large as at the same time of a short accretion case of 2 Ma. At smaller radius and surface, cooling prevents a further temperature increase. Since ≈500 K are necessary to induce creep of magnetite at the current pressure, compaction in the centre stalls. During the following ≈10 Ma the central temperature decreases. The early compaction history is reflected in the average porosity, which initially falls to 23.5% by 0.199 Ma, but subsequently increases to 47.56% by 18.7 Ma.
By 23.5 Ma the proto-Ceres grows to a radius of 22 km. Thus, increased internal pressure suffices to compact serpentine and pyrene phases in the shallower regions at T ≥ 170 K. Despite the following runaway accumulation of porous material, increase of the interior temperatures that is due to the decay of the long-lived nuclides provides a continuous reduction of the average porosity. By the end of the accretion (t = 50 Ma), the average porosity is reduced to 42.77% at a radius of 547 km and a central temperature of 210 K.
Subsequently, the internal temperature increases further, and so the porosity is reduced continuously throughout the asteroid. By 74.8 Ma, Rp(t) = 489 km, and Tc = 238 K, the average porosity falls below 20%. By 247 Ma, Rp(t) = 470 km, and Tc = 397 K, φ(t) = 10% is obtained. Finally, φ(t) stabilises at ≈2% by 1600 Ma, Tc = 940 K and a radius of 457.4 km, while the average density stabilises at 2395 kg m-3. The maximum temperature of 1090 K is reached by 2270 Ma. In the following, Ceres cools down to a present-day central temperature of 784 K.
3.2.2. Slow accretion: Model CIb
Extended accretion has similar consequences for the evolution of model CIb (Fig. 4, right column). Around the centre, the minerals with relatively low activation energies (saponite, pyrene, mirabilite) compact on a very similar timescale as is the case in Sect. 3.1.2 for the temperature window of 200−377 K. A higher temperature of 580 K and a prolonged heating until 0.149 Ma (as compared to 550 K and 0.127 Ma in Sect. 3.1.2) is necessary to compact gypsum. Subsequently, the porosity slowly and gradually approaches the value of 20% by 0.411 Ma, 1.19 km, and 693 K as a results of the creep of hematite.
Strong cooling at this small radius decreases the central temperature to 170 K by 10.3 Ma, when Ceres grows to a radius of 4.4 km, and so the central porosity does not change. The temperature increases further until the end of accretion and beyond. Gradual heating and high central pressure of a full-grown Ceres leads to a final reduction of the central porosity between 200 and 364 Ma, 365 K and 502 K, and 521 km and 509 km. This final compaction phase at the centre proceeds at much lower temperatures than compaction of hematite and gypsum, for instance, but at a pressure and time several orders of magnitude higher.
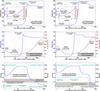 |
Fig. 4 Temperature, radius, porosity, and density assuming a fast accretion within 2 Ma for model CIa (left column) and CIb (right column). Upper row: evolution of the radius (main plots) and early evolution of the radius and of the central temperature (subplots). Middle row: evolution of the central temperature and of the radius. Bottom row: evolution of the central porosity/density (dashed lines) and average porosity/density (solid lines). The grey area indicates the average density of Ceres according to our present knowledge. |
The change of the average porosity results from the interplay of heating and accretion. After attaining a minimum of 32% within the first 0.390 Ma (density of 1526 kg m-3), it increases to 47.63% (density of 1173 kg m-3) during the following cooling phase, reaching almost the value of the initial porosity. After ≈20 Ma, a slow temperature increase in the 30 km-size proto-Ceres facilitates slow but gradual creep of pyrene and saponite at >180 K in the areas away from the centre. This compensates for the contribution of the porous material accreted at the surface, so that the average porosity changes only slightly and reaches 47.54% upon the completion of the accretion. Subsequently, it slowly evolves to 30% by 97 Ma, to 20% by 375 Ma, and to <2% by 859 Ma. The final average porosity of 1.8% corresponds to an average density of 2200 kg m-3 and a radius of 472.8 km.
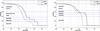 |
Fig. 5 Black lines show the porosity versus depth (taken at 4.5 Ga after CAIs) for varying accretion durations. Blue lines indicate the porosity intervals in which single mineral phases compact. For the accretion durations considered here, the porosity is reduced to zero except in an outer shell with a thickness lower than 30 km (CIa, left panel) or lower than 10 km (CIb, right panel). The loss of porosity is mainly due to the heating by the long-lived nuclides. A slightly more efficient compaction is possible for tac = 2 Ma after the CAIs. For all other cases with a longer accretion duration of 3−50 Ma, the porous layer is thicker. However, the porosity profiles in the latter cases are almost identical. In all runs for both CIa and CIb, an average porosity of φ(t) < 2.5% is reached in the present-day Ceres. The curve shapes result from a stepwise increase of the creep activation energy E according to the volume fractions and the activation energies of single minerals. |
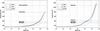 |
Fig. 6 Black lines show the temperature versus depth (taken at 4.5 Ga after CAIs) for varying accretion durations. Blue lines indicate the dehydration temperature of hydrated species. The steps in the temperature profiles result from the variation of the porosity and, thus, of the thermal conductivity with depth (see Fig. 5). While the internal temperature does not allow for magmatic activity of dry silicates today, existence of liquid water in the deep layers is still possible. For CIa the melting point of water is crossed at the depths of 80 km for tac = 2 Ma, 25 km for tac = 3 Ma, and 18 km for longer accretion durations. For CIb the respective depth varies between 32 km for tac = 2 Ma and 5 km for all tac ≥ 3 Ma. The higher temperatures in the shallower depths for a later accretion are due to the insulating properties of the porous layer. |
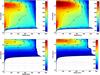 |
Fig. 7 Temporal evolution of the radial distribution of the temperature in the interior of Ceres. Top row: fast accretion with t0 = 1 Ma and tac = 2 Ma. Bottom row: slow accretion with t0 = 1 Ma and tac = 50 Ma. Left column: Model CIa. Right column: Model CIb. Parallel to the porosity loss, the body shrinks to the final radius of 456 km. Relatively low activation energies of the minerals (Table 1) enable compaction at temperatures of mostly below 500 K. Thus, a substantial fraction of the interior consolidates before the hydrated minerals start to dehydrate. |
3.3. Effects of heating and pressure on compaction
As we have shown in Neumann et al. (2014b), the same porosity reduction can be achieved rapidly at a high temperature or slowly by prolonged heating at a lower temperature, or still fast at a higher pressure and a lower temperature. These compaction regimes can be observed for example at shallow depths where mineral phases compact much more slowly than in the centre at lower temperatures. The same effect is observed in scenarios with a long accretion duration, when the initially strong heating by short-lived nuclides wears off after the first few Ma, but the long-lived nuclides act as a stable energy source over the following billions of years. Moreover, the pressure effect on the compaction is crucial throughout the entire accretion duration. Thus, the change of porosity and density is mainly governed by radiogenic heating and by the accretion rate in competition with cooling through the surface.
3.4. Temperature evolution in the interior
Models that approximate continuous accretion with the parameters t0 and tac by an instantaneous formation at the time instance t0 + tac initially start with a cold object. Such an object would still have an initial porosity and an initial temperature at any depth. These models lack the evolution and metamorphism of the body considered before accretion is completed. However, the processes that take place during the accretion influence a small volume fraction of a fully grown Ceres to a considerable extent. Furthermore, accretion influences the remaining volume to a non-negligible extent, providing a pre-heated and pre-compacted interior at the time of its completion. This effect is particularly pronounced for an early accretion onset and a short accretion duration (see Fig. 3, bottom row).
Clear differences are observed between the scenarios with a short and a long accretion duration. In addition to higher maximum temperatures, models with tac = 2 Ma display two temperature peaks after accretion is completed (see middle rows of Figs. 3 and 4, and Fig. 7). The first maximum, which is due to the heating by 26Al, 60Fe, and 53Mn, still exists in the models with tac = 50 Ma. However, this is only a short heat pulse at the very beginning of the accretion that is confined within several hundred metres around the centre of the seed (see Fig. 4, top and middle rows).
4. Discussion
We modelled the evolution of the temperature and porosity (density) of the dwarf planet Ceres with particular emphasis on its accretion from a km-size seed to its present radius. We used two specific CI chondrite-like compositions, appropriate abundances of the radiogenic heat sources, and variable values for the creep activation energies. Accretion times of up to 50 Ma relative to the formation of the CAIs were considered. Our results imply that even for a high initial porosity of ≈50% and long accretion times of up to tac = 50 Ma, Ceres ultimately compacts by hot pressing to an average porosity of <2.5%. This argues against the suggestion that the low density of Ceres might be explained by a substantial interior porosity (Zolotov 2009). The results of Castillo-Rogez (2011), who argued for compaction that is due to the dehydration of hydrated minerals, confirms this result. However, we find that compaction by creep precedes the potential dehydration in several cases. Since the porosity changes associated with the dehydration are only of a few percent (see Sect. 4.5), creep should be the dominant mechanism of porosity loss.
4.1. Final density/porosity of the models CIa and CIb
As shown in Figs. 3 and 4, the average density either evolves towards the grey area marking the density of Ceres and leaves it as a result of further compaction (CIa), or it remains in it (CIb). For the present-day porosity profiles see Fig. 5. Differences between long- and short-time accretion models mainly result from the differences in radiogenic heating. The loss of porosity is achieved within ≈5 Ma through the heating by 26Al, 60Fe, and 53Mn for fast accretion. For a long-time accretion, by contrast, compaction is mainly due to heating by long-lived nuclides and takes several hundreds of millions of years to complete.
Regardless of the model composition and accretion time, the present-day average porosity is <2.5%, yielding a far higher average density for CIa than the density of Ceres according to our present knowledge. Therefore, we conclude that it is unlikely that the low density of Ceres can be explained by a partially porous interior for model CIa. On the other hand, a low interior porosity of CIb composition can satisfy the average density.
4.2. Prolonged accretion and different accretion behaviour
In general, prolonged accretion of Ceres limits the amount of 26Al, 60Fe, and 53Mn available for the processing of the newly accreted material. It determines whether the interior inherits intense heating by the short-lived nuclides upon the completion of the accretion or if it remains relatively cold for up to several hundreds of millions of years, until continuous heating by the long-lived nuclides causes the second temperature increase.
Still, accretion cannot prevent that internal temperatures exceed critical temperatures for creep, dehydration, or even small-scale melting of the involved species. Furthermore, it cannot prevent compaction of an initially porous proto-Ceres down to an average porosity of less than a few percent. However, no wide-spread melting of the metal and no melting of the silicate phase at all is expected for a long accretion duration. By contrast, substantial melting of metal or even silicates is expected if Ceres completes its accretion within the first ≈3 Ma relative to the formation of the CAIs.
The picture does not change if different accretion rates are employed. Additional model runs performed using a linear and asymptotic accretion law (see Neumann et al. 2012) instead of an exponential law (Eq. (2)) confirm our results. Finally, slower accretion than within 50 Ma is rather unrealistic and was therefore not considered here.
Clearly, accretion should not be neglected, in particular for the scenarios with a short tac. It provides a pre-heated and pre-compacted interior upon its completion (see Figs. 3, 4, and 7), while an “instantaneously” forming Ceres would start as a cold primordial body at t0 + tac.
4.3. Influence of the material properties used
While the radiogenic heat production rate was the same in both models, thermal conductivities and intrinsic densities differed, as did the activation energies. Thus, higher maximum temperatures were obtained for model CIb because of its lower intrinsic thermal conductivity.
Furthermore, we calculated the thermal conductivity from the geometric mean of the mineral conductivities and volume fractions (see Beardsmore & Cull 2001). These values of kb are for the most part lower than the linear combinations of mineral conductivities and volume fractions used by Castillo-Rogez & McCord (2010) and Castillo-Rogez (2011). Moreover, we accounted for the dependence of the thermal conductivity on the porosity, which was computed self-consistently. This is of particular importance for the early evolution before compaction and for the insulating properties of a leftover porous blanket at the surface.
An uncertainty arises from the analytic expression of cp = cp(T) that we adopted from Yomogida & Matsui (1984). In the temperature range between 200 K and 1600 K, cp varies from ≈450 to 1200 J kg-1 K-1. This fit was derived for the bulk ordinary chondritic material and is not directly related to measurements on carbonaceous chondrites or on single minerals from CIa and CIb.
4.4. Parameters for creep modelling
Some of the activation energy values adopted here are upper bounds (see comments below Table 1). For example, the activation energy for creep of anhydrite was used to model the compaction of gypsum. The latter should be more easily deformable than anhydrite. This means that compaction of gypsum is shifted to higher temperatures, while in fact some reduction of the porosity in this phase should have taken place at lower temperatures. We acknowledge that uncertainties in the parameters in Eq. (4) remain that will result in the uncertainties in compaction times and temperatures. These parameters are, in particular, the pre-factor B, the grain size b, the stress exponent n, and the grain size exponent m, which vary for different materials and represent a further uncertainty. The grain size of 1μm is constrained by the size of matrix grains in chondritic meteorites (<5 μm, see Hutchison 2004) and by the interplanetary dust particles ( , see Rietmeijer 1993). For different creep mechanisms, the exponent n varies from n ≈ 1 (diffusion creep) to n> 3 (dislocation creep). The exponent m typically varies between 2 (Nabarro-Herring creep) and 3 (Coble creep) for diffusion creep and is equal to zero for dislocation creep. Adopting a higher value of n than n ≈ 1 or a lower value of m than m = 3 (or even m = 0) will enhance compaction, since the absolute value of the right-hand side in Eq. (4) describing the rate of the porosity loss would increase. As a consequence, compaction would be shifted to lower temperatures.
Finally, while deriving creep laws, such as Eq. (4) and, in particular, the activation energies involved, short times of laboratory experiments are extrapolated to the processes that proceed on a geological time scale.
Our results depend to some extent on the choice of the initial porosity of ≈0.5. A lower initial porosity would facilitate compaction through the higher heat source density (and, thus, a stronger early heating rate) while a higher initial porosity than 0.5 is less reasonable (Henke et al. 2012). In addition, a lower initial porosity leads to a lower final average porosity because shallow primordial layers will be denser. No substantial change in the results is expected if the initial porosity remains in a reasonable range of 30%−60%.
4.5. Compaction by creep vs. dehydration
In the simulations by Castillo-Rogez (2011), the author pointed out that the internal temperatures suffice to induce creep. However, creep as such was not modelled, while the contribution of the latent heat of dehydration was accounted for. In particular, dehydration temperatures of minerals were compared with the temperature profile, and dehydration was inferred as a plausible mechanism of porosity loss. It can be easily shown that dehydration alone cannot lead to compaction. As we discuss in the following, the volume changes upon dehydration are typically only of a few percent and do not reduce the initial porosity to low values of 0−10%.
We here explicitly modelled creep of the involved minerals. In particular, our simulations showed that for some minerals from Table 1 the pores close before the respective mineral can dehydrate. In some cases the situation is reversed: Mirabilite, gypsum, and epsomite first reach their dehydration temperatures of 305 (Clauser & Huenges 1995), 373−423 (Brantut et al. 2011), and 353 K (van Essen et al. 2009), respectively (this process was not modelled here), while higher temperatures are necessary to close the pores in these mineral phases by creep.
In these cases, dehydration will introduce a new, “wet” porosity (also known as “melt porosity”), in addition to the pores not closing by previous creep processes. On the one hand, this means that an interconnected water network might form, creating conditions for the percolation of water (for this, however, the matrix needs to be compacted to squeeze the water out of the pores). On the other hand, the local volume change due to dehydration could cause the pores to be filled with water. However, this is not the case, as we show in the following.
The dehydration of all hydrated species involved influences the proportions of the matrix, the pores, and the liquid water. First, considering dehydration of serpentine (to forsterite, talc, and water), of hydrated montmorillonite (to the dehydrated montmorillonite and water), of epsomite (to kieserite and water), of mirabilite (to thenardite and water), of saponite (first to corrensite, quartz, and water and then to clinochlore, quartz, and water), and of gypsum (to bassanite and water), we assume that before the dehydration all of the minerals that correspond either to CIa or to CIb form the solid matrix in a volume with an initial porosity of φ0 ≈ 0.5. All of the dehydration products except water are assumed to remain in the matrix, while water forms a third phase that partially fills the pores. By accounting for the volume changes associated with the single reactions involved (and neglecting any kind of compaction), the composition of model CIa evolves to a three-phase system where the matrix, the water, and the pores have the fractions of 35.7%, 20.67%, and 43,63%, respectively. In model CIb the respective fractions are 31.65%, 23.8%, and 44.55%. As a result, the matrix has a rather small fraction, and it is rather probable that it will collapse, leading ultimately to the compaction of the volumes where such a theoretical complete dehydration takes place. However, since several mineral phases compact by creep before their dehydration, the current porosities upon reaching the respective dehydration temperatures will be considerably lower than φ0. To demonstrate the consequences, we compare dehydration temperatures of the three minerals that should have dehydrated before they compacted by creep in the model (mirabilite, epsomite, and gypsum) with the central porosity of a km-size proto-Ceres reached at the respective temperatures (see Sect. 3.1). In doing so, we assess the reduction of the porosity that is due to the dehydration. Following Castillo-Rogez (2011), mirabilite is assumed to dehydrate at 305 K. By that time, a porosity of 30% is available in the centre of a km-size proto-Ceres for model CIa with fast accretion. By dehydrating mirabilite to thenardite and water, the volume of this phase increases by ≈6.15%, meaning that instead of occupying only a volume fraction of 7% of the matrix (or 4.935% of the total space), it would need 5.24% of the total space. Since 4.935% already occupy a certain volume of the matrix, the remaining 0.3% will fill a part of the pores. This means, however, that the pores shrink from 30% to ≈29.69%. Similarly, in model CIb, the pores would shrink from ≈33% to ≈32.53% because they are being filled partially with the water that dehydrated from mirabilite.
After the dehydration of epsomite at 353 K, the volume of this phase increases by ≈10.4%. In model CIa, central porosity is ≈18% at 353 K. Thus, the porosity decreases to 17.12%. In model CIb, the central porosity around 353 K decreases from 33% to 28%. Taking 28% and a higher volume fraction of epsomite in CIb (see Table 1), the porosity is reduced to 25.95% (similarly, 33% would be reduced to 31.09%).
In the temperature window between 373 K and 423 K, the central porosity for model CIb with fast accretion is ≈28%. Dehydration of gypsum to bassanite and water leads to a volume increase of this phase by 7.9%. Thus, the porosity will be reduced negligibly to 27.68%.
Obviously, for both compositions, the dehydration of the three minerals considered above changes the porosity by less than 3%. Thus, as long as these reactions do not actually destabilise the matrix and destroy its structural integrity (as should be the case for a high porosity), no further compaction will occur except by creep. Such a destabilisation could occur, furthermore, if the fraction of the freed water were sufficiently large to dominate the rheology (water would assume the role of the matrix). No destabilisation is expected, however, because of the low-volume fractions of the dehydrating minerals and pre-compacted condition of the matrix. Furthermore, as discussed in the Sect. 4.4, the variation of several parameters in the creep law assumed here can shift creep of mirabilite, gypsum, and epsomite towards lower temperatures, which might lead to their compaction before the dehydration.
Taken together, compaction of an initially porous body with the compositions CIa or CIb occurs in several steps as a combination of creep and dehydration, but is dominated by the creep processes and is only slightly perturbed by the dehydration.
4.6. Presence of liquid water in the past
Although the interior and the peak temperatures calculated with our model vary with the accretion time, they allow for the production of liquid water in the central region of Ceres (either by ice melting or by dehydration) for any accretion duration and even production of iron and silicate melts for an early formation.
It has been proposed McCord & Sotin (2005) that proto-Ceres could have in part been composed of water ice. According to the amount of ice suggested by these authors, this would reduce the radiogenic heating compared to our model by up to ≈30%. This still suffices to exceed T = 273 K at almost any depth. This means that assuming presence of frozen water in a free state, liquid water must have formed, making hydration of the silicate minerals possible. The peak central temperature of 855 K and 1005 K (for models CIa and CIb, respectively) for tac = 50 Ma reached in the model runs having a heat production rate reduced by 30% still allows for the dehydration of hydrated minerals, possibly followed by water-rock differentiation.
4.7. Implications for the ice-rock differentiation
The wide-spread presence of liquid water at some time in the past does not necessarily imply differentiated structure, however, as we argue below. Self-consistent numerical modelling of the differentiation processes (water-rock and metal-silicate) is needed to constrain the sizes of the single layers.
Computing the evolution of porosity is essential not only for the hypothesis of an undifferentiated and porous Ceres. Assuming a substantial amount of ice is present in Ceres’ primordial material, porosity also has substantial implications for the ice-rock differentiation during the early structural evolution.
Assuming accretion of ice and dust, the rheological behaviour of the system will be dominated by one of the two components, depending on their proportions. The water-rock differentiation will then proceed abiding by the Darcy flow or Stokes flow regime, according to the relative amounts of water and rock. Characterising the transition between these regimes by a certain critical ice volume fraction, the following scenarios are considered.
-
(a)
A super-critical ice fraction: Ice matrix with dust grains,meaning that upon melting of ice the dust grains settle with theStokes flow velocity.
-
(b)
A sub-critical ice fraction: Dust/rock matrix with ice grains, meaning that upon melting of ice movement of water upwards within the matrix can be described using the Darcy flow law.
Neither (a) nor (b) will be the exclusive differentiation regime because during the water-rock separation water-enriched layers will form, where (a) takes place, while in other water-depleted or dust-enriched layers (b) will prevail.
The interplay between the initial porosity and its evolution during creep with the fraction of the liquid water (called melt-porosity) has an effect on the differentiation, however. Before the melting of ice, there could be some remaining pores not closed by creep that are filled with gas. For case (a), this porosity would not influence the differentiation scheme to a notable extent. For case (b), however, the situation is more complex. In addition to the volume occupied by ice and dust grains, there are pores. Melting of ice will increase the porosity in the rock matrix. Only a part of this porosity (typically smaller than the volume fraction occupied previously by the ice) will be filled with water, since water ice has a lower density than water in the parameter range relevant here. An upward percolation of water by porous flow would theoretically be possible if the matrix (1) deformed strongly enough to close the fraction of the pores that is not vacated by water and (2) deformed further to squeeze the water out of the matrix. Higher temperatures (up to 700 K) than the melting temperature of water are necessary for the matrix to deform. Thus, water will first migrate downwards, filling the remaining pores around the centre that are vacated by gas that migrated upwards, while the matrix remains immobile. After this, water will either remain in suspension until the matrix deforms and then differentiate, or it will vaporise and fill the pores with the water vapour. Subsequent deformation of the matrix will lead to the mobilisation of the vapour. On its way to the surface, water will form in the cooler shallow layers. It is also possible that during these processes some amount of water is consumed by the hydration of the minerals contained in the dust fraction. Solid-state flow of hydrated minerals with relatively low creep activation energies will lead to the closure of the pores. The dehydration of the hydrated minerals at higher temperatures will contribute to the production of free water and increase the thickness of a water ocean upon percolation.
Another way to differentiate a water ocean on Ceres is release of water by dehydration (Castillo-Rogez 2011) and subsequent percolation of water by porous flow. Before such a release of water, the martix will already be compacted, as we have shown further above. Considering reactions mentioned in Sect. 4.5, water will occupy a volume fraction of ≈0.36 in both models CIa and CIb upon dehydration of all hydrated species. This volume fraction is sufficiently high to obtain an interconnected water network. Subsequently, water could differentiate by porous flow and form a sub-surface water ocean if the silicate matrix deforms.
The combination of the processes mentioned above does certainly influence the timing of the differentiation, the nature and the thicknesses of the differentiated layers, the cooling history, and, thus, the present-day state of Ceres’ interior.
4.8. Convection in a water ocean
Formation of a pure ice layer upon freezing of a water ocean can be affected to a great extent by the convection that could occur before a water ocean differentiates. In fact, turbulent convection in a muddy ocean (i.e., a mixture of water and dust, dominated rheologically by the water phase) would prevent dust particles from settling to the bottom of the ocean. Thus, a “dirty” ice layer needs to be considered as another layer in Ceres’ internal structure. A further consequence of the liquid-state convection is the effective cooling of the ocean. In our previous study, Neumann et al. (2014a), we investigated severe consequences of the liquid-state convection in a magma ocean. There, a possible temperature increase from radiogenic heating was prevented by the convective cooling, keeping the melt fraction low and the life-time of the magma ocean short. Similar effects can be imagined for a water ocean: it might have been not much warmer than the melting point of water, for instance. The rocky core might consequently have been cooled much more effectively. This could have prevented metal-silicate differentiation in the rocky core and led to a much cooler interior of the present-day Ceres than suggested by the conductive models.
4.9. Presence of liquid water today
Present-day temperature profiles shown in Fig. 6 allow for the presence of liquid water starting at the depths of 18−80 km and 5−32 km for the models CIa and CIb, respectively, and varying tac. This results from our conductive models that include insulating properties of a porous lid, however. Not included in these calculations was a possible reduction of the radiogenic heating due to the presence of ice (that does not contain such heat sources) and due to the convective cooling of a water ocean.
To estimate the first effect to some degree, we ran several simulations with only 70% of the radiogenic heating (based on the ice mass fraction of up to ≈30%). For a long accretion (tac = 50 Ma), the depth at which ice could melt changed to at least 25 km for CIa, but remained ≈5 km for CIb.
To obtain a rough estimate of how convection in a water ocean would change the picture, we performed additional runs where in addition to the reduction of the radiogenic heating as above, the temperature was not allowed to exceed 300 K at any time and depth. This is based on our investigations of convective cooling in magma oceans on small bodies. Neumann et al. (2014a) found that effective cooling by vigorous convection prevents a further temperature increase above the temperature that defines such a magma ocean. Here, keeping the temperature below 300 K changed the depth at which 273 K are reached to 77 km for CIa and 33 km for CIb in the case tac = 50 Ma.
Based on the above considerations, the minimum depth at which liquid water could be available today appears to lie in the range of 5−33 km. This is a rough estimate, since differentiation has not been modelled here and it is not guaranteed that these layers do not simply contain rock or porous dust due to some specific structure that formed after the differentiation. In particular, the enrichment of the radiogenic nuclides in the rocky core, the lack of the radiogenic heating in the ocean, and the availability thereof in the undifferentiated upper lid could change the picture once more. Finally, shallower depths can be obtained by lowering the melting point of water as a result of the introduction of salts (see Castillo-Rogez & McCord 2010).
4.10. Metal-silicate differentiation and formation of a metallic core
For CIa, the accretion has to be completed within the first 4 Ma relative to CAIs’ formation to produce some small amount of iron melt enabling possible differentiation of a metallic core. In the late-forming cases the solidus temperature of the iron phase is not reached. In these simulations no core formation can therefore be expected at all. On the other hand, an early formation would result in the formation of an iron core and a silicate mantle, preceded by an almost complete compaction. For the second composition CIb, however, iron melt is produced regardless of the accretion duration within at least the radius of ≈50 km around the centre.
In general, “too hot” scenarios (see Fig. 2) can be excluded completely because Ceres has no basaltic crust. In other scenarios that produce iron melt, porous flow will be the dominating melt percolation and core formation mechanism due to low melt fractions. This would most probably result in a layered structure with a varying degree of metal-silicate differentiation below additional possible differentiated layers, such as a pure ice layer that is due to the differentiation of the dehydrated water (see e.g. Castillo-Rogez & McCord 2010; Castillo-Rogez 2011).
5. Conclusions
We have modelled the thermal evolution and compaction of an initially porous Ceres-like body that undergoes accretion from protoplanetary dust by the means of a comprehensive numerical model. The accretion started with a ≈ 1 km-size seed and ended with an ≈500 km-size fully grown asteroid. We analysed the interplay of accretion from dust and compaction of the porous accreted material by hot pressing using an exponential accretion law and a diffusion creep law. We investigated the hypothesis that Ceres’ low density of ≈2040−2250 kg m-3 is due to a porous interior. To do this, the material properties (in particular, the parameters relevant for compaction) were varied self-consistently in the calculations according to the mineralogy of two composition models adopted.
For all accretion times considered, the final average porosity of Ceres was <2.5%. Thus, the present-day average porosity of Ceres is negligible and the interior is almost completely compacted. This means that of the two composition models used here, the “high-density” model CIa is unlikely: The condition of ≈10% porosity is not satisfied and the calculated bulk density of the asteroid is higher than that of Ceres. The “low-density” model CIb, on the other hand, yields both an appropriate bulk density and a radius approximately equal to that of Ceres. While the material in Ceres’ interior could have been altered even more, this specific composition appears to be feasible for the early Ceres based on the modelling arguments. On the other hand, a low-density phase, such as water ice, represents yet another explanation of Ceres’ density and is no less plausible. In particular, based on the recent observations by the Dawn mission (see, e.g., Schenk et al. 2015; Beck et al. 2015), both water ice and hydrated minerals could be present on Ceres. Assuming that minerals involved in CIa and CIb probably played an important role in the evolution of Ceres, we envision an augmentation of the current model by considering water as an additional phase and water-rock differentiation.
Depending on the adopted accretion duration tac, the compaction of Ceres took place between only a few millions years and more than one billion years. The remaining porous layers constitute the outer 3−30 km of the asteroid. However, since the surface of Ceres is heavily cratered, we expect the surficial evidence for these pores to have been eradicated over time and overprinted by the pores and cracks arising from collisions.
Our models show that compaction is dominated by the creep processes in the solid matrix and only slightly influenced by the release of water trapped in hydrated minerals. For one part, several mineral phases creep at lower temperatures than they would dehydrate at. For the other, our estimates show that dehydration can change the porosity by only a few percent.
Accretion plays a vital role in both the thermal and the structural evolution of Ceres because it provides a pre-heated and pre-processed interior upon its completion. The temperatures obtained during the accretion allow not only for creep and compaction, but also for the dehydration of hydrated minerals. This finding implies that water-rock differentiation might have alreday started in the proto-Ceres during its growth.
Our calculations provide the evolution as well as the present-day porosity and temperature profiles for Ceres. The temperature evolution allows for the existence of liquid water in the interior of Ceres both in the past and today. Based on the calculated present-day temperature profiles, conditions for liquid water are on hand at a depth of more than 5−33 km (this variation is based on different compositions and accretion times). This depth range may vary since differentiation has not been modelled here. In particular, the inhomogeneous distribution of radioactive elements associated with rock-ice differentiation could change the temperature evolution. Furthermore, shallower depths of liquid water can be obtained by lowering the melting point of water by the introduction of salts (see Castillo-Rogez & McCord 2010).
Depending on the composition model, either accretion within the first 4 Ma relative to CAIs results in melting of iron, or iron melt is produced regardless of the accretion timing, enabling possible differentiation of a small metallic core. For model CIb and an accretion duration of ≈2 Ma, the solidus temperature of the metal is reached well before the end of the accretion. Thus, the onset of metal core formation took place before the accretion was completed. Based on the evolution of the central temperature, two events of metal-silicate differentiation were identified depending on tac. For an early accretion, a small core could form within the first ≤20 Ma. After the first differentiation event, a cooling phase below the metal solidus is observed, followed by another temperature increase causing melting and a second differentiation event between ≈0.6 Ga and ≈4 Ga relative to CAIs. For a late accretion, metal melting would occur very late and the degree of melting would be low. Thus, the differentiation would only take place in the centre within a radius of several tens of kilometres approximately around 3 Ga relative to CAIs. This result holds for model CIb because of its lower intrinsic thermal conductivity. For model CIa, no metal melting occurs for a late accretion.
As a result of a rather elaborate interplay of the porosity evolution, melting of water ice, and compaction of the rocky matrix during the percolation of water, the potential water-rock and metal-silicate differentiation of Ceres must certainly have been very complex processes that require further detailed studies.
Acknowledgments
We thank the editor Tristan Guillot and an anonymous referee for constructive and helpful comments that improved the paper. Furthermore, we thank the Deutsche Forschungsgemeinschaft (DFG) for supporting this work within the framework of the Priority Programme 1385 “The First 10 Million Years of the Solar System − a Planetary Materials Approach”’.
References
- Ahrens, T. J. 1995, Rock Physics & Phase Relations: A Handbook of Physical Constants (American Geophysical Union) [Google Scholar]
- Akbulut, S., Ocak, Y., Böyük, U., et al. 2006, J. Phys. Cond. Matt., 18, 8403 [NASA ADS] [CrossRef] [Google Scholar]
- Baumann, W. 1984, Eclogae Geologicae Helvetiae, 77, 301 [Google Scholar]
- Beardsmore, G. R., & Cull, J. P. 2001, Crustal heat flow: a guide to measurement and modelling (Cambridge University Press) [Google Scholar]
- Beck, P., Schmitt, B., Cloutis, E. A., & Vernazza, P. 2015, Icarus, 257, 471 [NASA ADS] [CrossRef] [Google Scholar]
- Brantut, N., Han, R., Shimamoto, T., Findling, N., & Schubnel, A. 2011, Geology, 39, 5962 [CrossRef] [Google Scholar]
- Carry, B., Dumas, C., Fulchignoni, M., et al. 2008, A&A, 478, 235 [NASA ADS] [CrossRef] [EDP Sciences] [Google Scholar]
- Castillo-Rogez, J. C. 2011, Icarus, 215, 599 [NASA ADS] [CrossRef] [Google Scholar]
- Castillo-Rogez, J. C., & McCord, T. B. 2010, Icarus, 205, 443 [NASA ADS] [CrossRef] [Google Scholar]
- Chambers, J. E., & Halliday, A. N. 2014, in Encyclopedia of the Solar System (Third Edition), eds. T. Spohn, T. Johnson, & T. Breuer (Elsevier), 29 [Google Scholar]
- Clauser, C., & Huenges, E. 1995, Rock Physics and Phase Relations: A Handbook of Physical Constants, AGU Reference Shelf, ed. T. Ahrens (American Geophysical Union, WA), 3, 105 [Google Scholar]
- Dell’Angelo, L. N., & Olgaard, D. L. 1995, J. Geophys. Res., 100, 15425 [NASA ADS] [CrossRef] [Google Scholar]
- Durham, W. B., Stern, L. A., Kubo, T., & Kirby, S. H. 2005, J. Geophys. Res., 110, E12010 [NASA ADS] [CrossRef] [Google Scholar]
- Heard, H. C. 1972, in Flow and Fracture of Rocks. Geophysical Monography Series, eds. H. C. Heard, I. V. Borg, N. L. Carter, & C. B. Raleigh (American Geophysical Union), 191 [Google Scholar]
- Henke, S., Gail, H.-P., Trieloff, M., Schwarz, W. H., & Kleine, T. 2012, A&A, 537, A45 [NASA ADS] [CrossRef] [EDP Sciences] [Google Scholar]
- Hilairet, N., Reynard, B., Wang, Y., et al. 2007, Science, 318, 1910 [NASA ADS] [CrossRef] [Google Scholar]
- Hutchison, R. 2004, Meteorites: A petrologic, chemical and isotopic synthesis (Cambridge University Press) [Google Scholar]
- Kortenkamp, S. J., Kokubo, E., & Weidenschilling, S. 2000, Formation of planetary embryos, in Origin of the Earth and Moon, eds. R. M. Canup, & K. Righter (Tucson, Arizona: The University of Arizona Press) [Google Scholar]
- Kuhlman, K. 2011, SDI Heater Testing Long-Term Thermal Effects Calculation, Tech. Rep., Sandia National Laboratories, Carlsbad, New Mexico [Google Scholar]
- Martinho, J. M. G., Reis e Sousa, A. T., OliveiraTorres, M. E., & Fedorov, A. 2001, Chem. Phys., 264, 111 [NASA ADS] [CrossRef] [Google Scholar]
- McCord, T. B., & Sotin, C. 2005, J. Geophys. Res., 110, E05009 [NASA ADS] [CrossRef] [Google Scholar]
- McCord, T. B., McFadden, L. A., Russell, C. T., Sotin, C., & Thomas, P. C. 2006, Eos, Transactions American Geophysical Union, 87, 105 [CrossRef] [Google Scholar]
- McLaughlin, E., & Ubbelohde, A. R. 1956, J. Chem. Soc. Trans. Faraday Soc., 53, 628 [CrossRef] [Google Scholar]
- Molgaard, J., & Scmeltzer, W. W. 1971, J. Appl. Phys., 42, 3644 [NASA ADS] [CrossRef] [Google Scholar]
- Neumann, W., Breuer, D., & Spohn, T. 2012, A&A, 543, A141 [NASA ADS] [CrossRef] [EDP Sciences] [Google Scholar]
- Neumann, W., Breuer, D., & Spohn, T. 2014a, Earth Planet. Sci. Lett., 395, 267 [NASA ADS] [CrossRef] [Google Scholar]
- Neumann, W., Breuer, D., & Spohn, T. 2014b, A&A, 567, A120 [NASA ADS] [CrossRef] [EDP Sciences] [Google Scholar]
- Prieto-Ballesteros, O., & Kargel, J. S. 2005, Icarus, 173, 212 [NASA ADS] [CrossRef] [Google Scholar]
- Pusch, R., & Yong, R. N. 2005, Microstructure of Smectite Clays and engineering Performance (CRC Press) [Google Scholar]
- Rietmeijer, F. J. M. 1993, Earth Planet. Sci. Lett., 117, 609 [NASA ADS] [CrossRef] [Google Scholar]
- Ripple, C. D., & Day, P. R. 1966, Clays and Clay Minerals, Proc. of the Fourteenth National Conf., 14, 307 [Google Scholar]
- Rivkin, A., Volquardsen, E., & Clark, B. 2006, Icarus, 185, 563 [NASA ADS] [CrossRef] [Google Scholar]
- Rocholl, A., & Jochum, K. P. 1993, Earth Planet. Sci. Lett., 117, 265 [NASA ADS] [CrossRef] [Google Scholar]
- Russell, C. T., Coradini, A., De Santis, M. C., et al. 2004, Planet. Space Sci., 52, 465 [Google Scholar]
- Schenk, P., Marchi, S., O’Brien, D., et al. 2015, in European Planetary Science Congress 2015, EPSC2015-400 (abstract) [Google Scholar]
- Schwenn, M. B., & Goetze, C. 1978, Tectonophysics, 48, 41 [NASA ADS] [CrossRef] [Google Scholar]
- Siemes, H., Rybacki, E., Klingenberg, B., & Rosiere, C. A. 2011, Eur. J. Mineral., 23, 293 [CrossRef] [Google Scholar]
- Thomas, C., Parker, J. W., McFadden, L. A., et al. 2005, Nature, 437, 224 [NASA ADS] [CrossRef] [PubMed] [Google Scholar]
- Till, J. L., & Moskowitz, B. 2013, Geophys. Res. Lett., 40, 697 [NASA ADS] [CrossRef] [Google Scholar]
- van Essen, V. M., Cot Gores, J., Bleijendaal, L. P. J., et al. 2009, in Proc. of Energy Sustainability, ES2009-90289 [Google Scholar]
- Šrámek, O., Milelli, L., Ricard, Y., & Labrosse, S. 2012, Icarus, 217, 339 [NASA ADS] [CrossRef] [Google Scholar]
- Weidenschilling, S. J. 1988, Formation processes and time scales for meteorite parent bodies, in Meteorites and the Early Solar System, eds. J. F. Kerridge, & M. S. Matthews (Tucson: University of Arizona Press) [Google Scholar]
- Wolf, S. F., Compton, J. R., & Gagnon, C. J. L. 2012, Talanta, 100, 276 [CrossRef] [Google Scholar]
- Yomogida, K., & Matsui, T. 1984, Earth Planet. Sci. Lett., 68, 34 [NASA ADS] [CrossRef] [Google Scholar]
- Zolotov, M. Y. 2009, Icarus, 204, 183 [NASA ADS] [CrossRef] [Google Scholar]
All Tables
Composition, mass, and volume fractions of the constituents, and further key parameters for modelling Ceres’ compaction.
Parameter values used to simulate the radioactive heat production by the short- and long-lived isotopes.
Data describing the circumstances of compaction at the centre of the proto-Ceres for t0 = 1 Ma relative to CAIs and tac = 2 Ma.
All Figures
|
Fig. 1 Heat production rate by the short- and long-lived radionuclides per 1 kg of the primordial material. The underlying abundances correspond to a CI chondritic composition and are shown in Table 2. |
| In the text | |
|
Fig. 2 Maximum (central) temperature for a varying accretion duration. The accretion starts at t0 = 1 Ma relative to the formation of the CAIs. The accretion durations considered here vary between tac = 0.5 Ma and tac = 50 Ma. |
| In the text | |
|
Fig. 3 Temperature, radius, porosity, and density assuming a fast accretion within 2 Ma for model CIa (left column) and CIb (right column). Upper row: evolution of the radius (main plots) and early evolution of the radius and of the central temperature (subplots). Middle row: evolution of the central temperature and of the radius. Bottom row: evolution of the central porosity/density (dashed lines) and average porosity/density (solid lines). The grey area indicates the average density of Ceres according to our present knowledge. |
| In the text | |
|
Fig. 4 Temperature, radius, porosity, and density assuming a fast accretion within 2 Ma for model CIa (left column) and CIb (right column). Upper row: evolution of the radius (main plots) and early evolution of the radius and of the central temperature (subplots). Middle row: evolution of the central temperature and of the radius. Bottom row: evolution of the central porosity/density (dashed lines) and average porosity/density (solid lines). The grey area indicates the average density of Ceres according to our present knowledge. |
| In the text | |
|
Fig. 5 Black lines show the porosity versus depth (taken at 4.5 Ga after CAIs) for varying accretion durations. Blue lines indicate the porosity intervals in which single mineral phases compact. For the accretion durations considered here, the porosity is reduced to zero except in an outer shell with a thickness lower than 30 km (CIa, left panel) or lower than 10 km (CIb, right panel). The loss of porosity is mainly due to the heating by the long-lived nuclides. A slightly more efficient compaction is possible for tac = 2 Ma after the CAIs. For all other cases with a longer accretion duration of 3−50 Ma, the porous layer is thicker. However, the porosity profiles in the latter cases are almost identical. In all runs for both CIa and CIb, an average porosity of φ(t) < 2.5% is reached in the present-day Ceres. The curve shapes result from a stepwise increase of the creep activation energy E according to the volume fractions and the activation energies of single minerals. |
| In the text | |
|
Fig. 6 Black lines show the temperature versus depth (taken at 4.5 Ga after CAIs) for varying accretion durations. Blue lines indicate the dehydration temperature of hydrated species. The steps in the temperature profiles result from the variation of the porosity and, thus, of the thermal conductivity with depth (see Fig. 5). While the internal temperature does not allow for magmatic activity of dry silicates today, existence of liquid water in the deep layers is still possible. For CIa the melting point of water is crossed at the depths of 80 km for tac = 2 Ma, 25 km for tac = 3 Ma, and 18 km for longer accretion durations. For CIb the respective depth varies between 32 km for tac = 2 Ma and 5 km for all tac ≥ 3 Ma. The higher temperatures in the shallower depths for a later accretion are due to the insulating properties of the porous layer. |
| In the text | |
|
Fig. 7 Temporal evolution of the radial distribution of the temperature in the interior of Ceres. Top row: fast accretion with t0 = 1 Ma and tac = 2 Ma. Bottom row: slow accretion with t0 = 1 Ma and tac = 50 Ma. Left column: Model CIa. Right column: Model CIb. Parallel to the porosity loss, the body shrinks to the final radius of 456 km. Relatively low activation energies of the minerals (Table 1) enable compaction at temperatures of mostly below 500 K. Thus, a substantial fraction of the interior consolidates before the hydrated minerals start to dehydrate. |
| In the text | |
Current usage metrics show cumulative count of Article Views (full-text article views including HTML views, PDF and ePub downloads, according to the available data) and Abstracts Views on Vision4Press platform.
Data correspond to usage on the plateform after 2015. The current usage metrics is available 48-96 hours after online publication and is updated daily on week days.
Initial download of the metrics may take a while.