Fig. 3
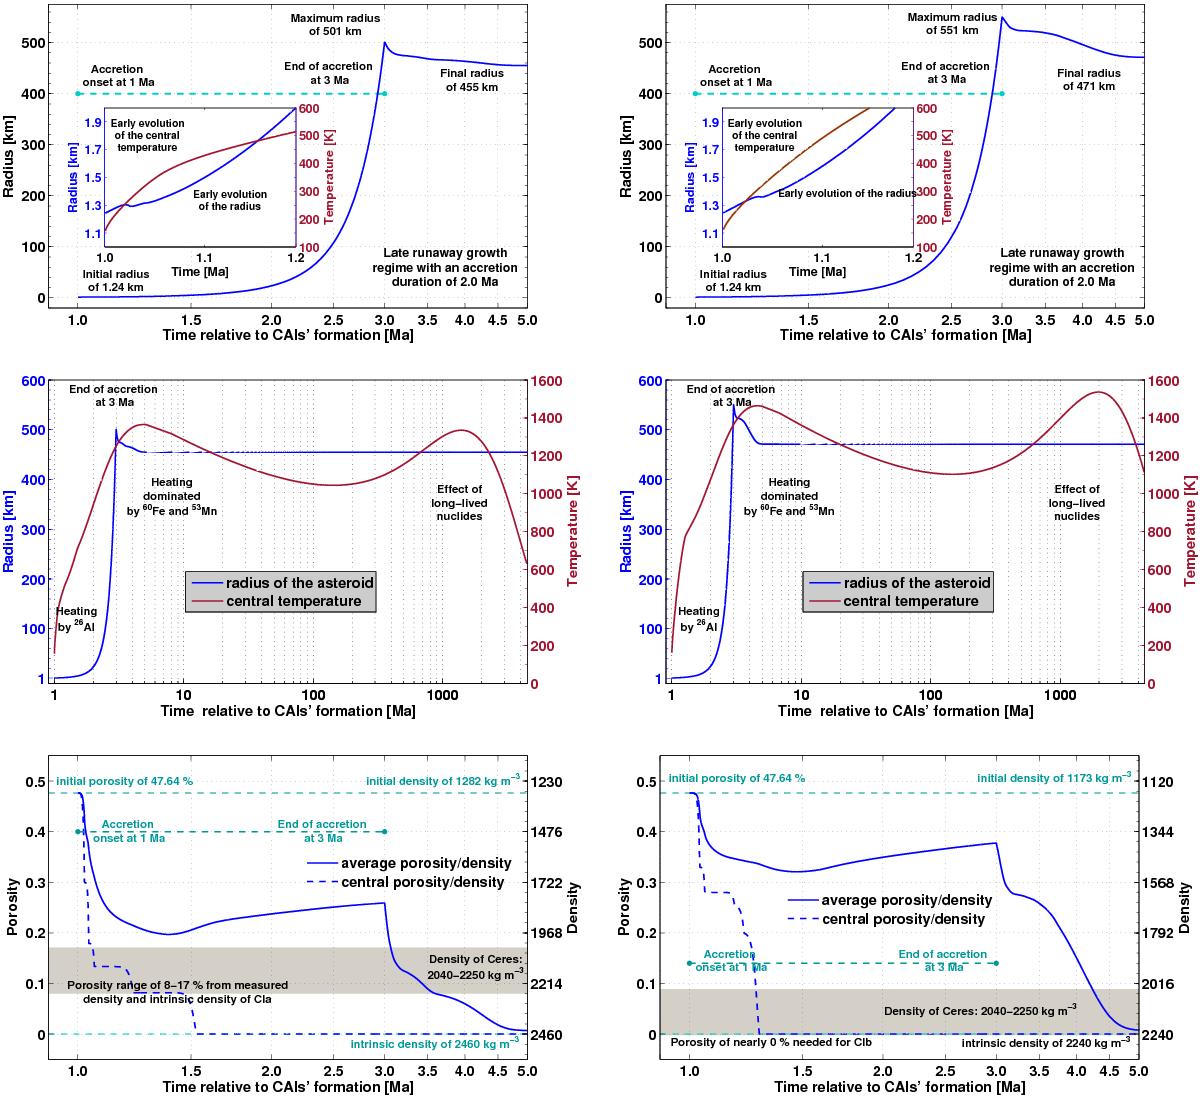
Temperature, radius, porosity, and density assuming a fast accretion within 2 Ma for model CIa (left column) and CIb (right column). Upper row: evolution of the radius (main plots) and early evolution of the radius and of the central temperature (subplots). Middle row: evolution of the central temperature and of the radius. Bottom row: evolution of the central porosity/density (dashed lines) and average porosity/density (solid lines). The grey area indicates the average density of Ceres according to our present knowledge.
Current usage metrics show cumulative count of Article Views (full-text article views including HTML views, PDF and ePub downloads, according to the available data) and Abstracts Views on Vision4Press platform.
Data correspond to usage on the plateform after 2015. The current usage metrics is available 48-96 hours after online publication and is updated daily on week days.
Initial download of the metrics may take a while.