| Issue |
A&A
Volume 567, July 2014
|
|
|---|---|---|
| Article Number | A120 | |
| Number of page(s) | 15 | |
| Section | Planets and planetary systems | |
| DOI | https://doi.org/10.1051/0004-6361/201423648 | |
| Published online | 24 July 2014 | |
Modelling of compaction in planetesimals⋆
1
Deutsches Zentrum für Luft- und Raumfahrt (DLR), Institut für
Planetenforschung, Planetenphysik,
Rutherfordstr. 2, 12489
Berlin, Germany
e-mail: This email address is being protected from spambots. You need JavaScript enabled to view it.
2
Institut für of Planetologie, Westfälische Wilhelms-Universität
Münster, Wilhelm-Klemm-Str.
10, 48149
Münster,
Germany
Received:
15
February
2014
Accepted:
13
May
2014
Abstract
Aims. Compaction of initially porous material prior to melting is an important process that has influenced the interior structure and the thermal evolution of planetesimals in their early history. On the one hand, compaction decreases the porosity resulting in a reduction of the radius and on the other hand, the loss of porosity results in an increase of the thermal conductivity of the material and thus in a more efficient cooling. Porosity loss by hot pressing is the most efficient process of compaction in planetesimals and can be described by creep flow, which depends on temperature and stress. Hot pressing has been repeatedly modelled using a simplified approach, for which the porosity is gradually reduced in some fixed temperature interval between ≈650 K and 700 K. This approach neglects the dependence of compaction on stress and other factors such as matrix grain size and creep activation energy. In the present study, we compare this parametrised method with a self-consistent calculation of porosity loss via a creep related approach.
Methods. We use our thermal evolution model from previous studies to model compaction of an initially porous body and consider four basic packings of spherical dust grains (simple cubic, orthorhombic, rhombohedral, and body-centred cubic). Depending on the grain packing, we calculate the effective stress and the associated porosity change via the thermally activated creep flow. For comparison, compaction is also modelled by simply reducing the initial porosity linearly to zero between 650 K and 700 K. As we are interested in thermal metamorphism and not melting, we only consider bodies that experience a maximum temperature below the solidus temperature of the metal phase.
Results. For the creep related approach, the temperature interval in which compaction takes place depends strongly on the size of the planetesimal and is not fixed as assumed in the parametrised approach. Depending on the radius, the initial grain size, the activation energy, and the initial porosity and specific packing of the dust grains, the temperature interval lies within 500−1000 K. This finding implies that the parametrised approach strongly overestimates compaction and underestimates the maximum temperature. For the cases considered, the post-compaction porous layer retained at the surface is a factor of 1.5 to 4 thicker for the creep related approach. The difference in the temperature evolution between the two approaches increases with decreasing radius and the maximum temperature can deviate by over 30% for small bodies.
Key words: conduction / planets and satellites: composition / planets and satellites: formation / planets and satellites: interiors / minor planets, asteroids: general / meteorites, meteors, meteoroids
Appendix is available in electronic form at http://www.aanda.org
© ESO, 2014
1. Introduction
Investigations of the structure of chondritic meteorites reveal significant variations in the average porosity between samples (Wilkinson et al. 2003), suggesting that they formed at different depths in the respective parent body. Furthermore, the average porosities of less than 27% (0–27% for H chondrites, 0–14% for L chondrites, and 0–18% for LL chondrites, see Wilkinson et al. 2003) are rather small compared to the average porosity of a model structure with a random loose or a random close packing of grains. Random packings should actually be expected for objects that accreted from dust in the protoplanetary nebula and that did not experience any kind of compaction, i.e. values of the porosity range between 36% and 44% (Dullien 1992).
The measured average porosities of the meteorites, however, indicate that processes such as compaction and metamorphism have modified the parent body. Compaction, i.e. the decrease of the porosity below the equilibrium value (see below), can be caused by mechanical processes (such as stress, plastic or brittle deformation, and fracture evolution) and/or by geochemical processes (such as dissolution and reprecipitation). Thus, the porosity of the random packings can be considered as initial porosity of the superficial material that accumulates at the surface during the accretion of a planetesimal.
Assuming random packing of particles that accreted at the surface of a planetary object, the porosity of that material depends on its structural parameters. The most important parameters are the grain size, the packing, the particle shape and the grain size distribution. The average or total porosity of an object is defined as the ratio of pore volume to the total bulk volume and can be expressed as a fraction or as a percentage. We note that the fraction value does not contain any information about distribution, sizes, or connectivity of the pores. Thus, objects with equal total porosity can have different physical properties. The porosity of randomly packed material is in equilibrium if it cannot be changed by tapping and shaking and without applying any pressure or increasing temperature. The value at which such an equilibrium state is achieved depends on the frictional and cohesive forces between the grains that are proportional to the exposed surface area. Per unit volume, the exposed surface area is inversely proportional to the grain size. Thus, coarse grain structures stabilise at a lower porosity than finer grain structures assuming the same mass. If the grain size increases above 50 μm, the frictional and cohesive forces decrease and a limit of the porosity is reached at a value of φ ≈ 0.399; for larger grain sizes this limit remains constant. This value represents a lower boundary for the porosity of randomly packed spheres (due to shaking and tapping only). Once non-spherical grains are considered, the porosity of the non-frictional limit changes, i.e. random packings of angular grains (e.g. cubes, cylinders, discs) attain equilibrium porosities higher than 0.399. However, a mixture of two grain sizes, for example, leads to smaller porosities than those of the samples with the involved constant grain sizes (see e.g. Coogan & Manus 1975). In contrast, the equilibrium porosity of ordered packings is independent of the grain size and depends simply on the choice of the packing. In the present study, we will use ordered packing based on the work by Kakar & Chaklader (1967) as this allows us to model self-consistently the initial porosity and the compaction process for selected packings.
In general, compaction can be considered as a two-stage process. Owing to the radial growth during the accretion, accreted particles are subsequently covered by fresh material and experience increasing lithostatic pressure. This means that the randomly or ordered packed grains can become closer and compact to the limit of φ ≈ 0.4 (see e.g. Guettler et al. 2009). This is a purely self-gravitational effect that does not require any temperature increase above the nebula temperature, and is referred to as cold pressing. Further compaction below the porosity of φ ≈ 0.4 is due to the so-called hot pressing or sintering, which can be described by plastic deformation of the grains by thermally activated creep processes. It depends on the temperature-dependent viscosity of the material and the effective stress acting on a dust grain. The effective stress depends on the geometric packing of the particles and the lithostatic pressure. Thus, compaction is in particular governed by temperature and stress. Because the pressure and thus the effective stress in a planetesimal increases with depth, shallow layers require a higher temperature than deep layers to compact by the same degree.
In the literature, the process of porosity loss by sintering in planetesimals is commonly modelled using a parametrised approach, for which compaction occurs at the fixed temperature interval of 670–700 K (e.g. Hevey & Sanders 2006; Sahijpal et al. 2007; Gupta & Sahijpal 2010; Solano et al. 2012). The approach dates back to a paper by Yomogida & Matsui (1984). In that work, the experimental results from Schwenn & Goetze (1978) were combined with a geometric approach of the calculation of the effective stress on dust grains from Kakar & Chaklader (1967) and Rao & Chaklader (1972) to model self-consistently compaction of planetesimals with radii of ≤100 km. The hot pressing experiments by Schwenn & Goetze (1978) with olivine have been reproduced to model the evolution of log (1 − φ) (where φ is the porosity; see also Eq. (9)) using an activation energy of E = 85 ± 29 kcal mol-1 (E = 356 ± 121 kJ mol-1). In their numerical simulations, however, Yomogida & Matsui (1984) used E = 45 kcal mol-1 (E = 188 kJ mol-1) for temperatures below 700 K. This value was chosen in order to obtain compaction at low temperatures to reconcile the meteoritic evidence of compaction even with inefficient heating by long-lived isotopes 40K, 232Th, 235U, and 238U. Heating by 26Al and 60Fe was not considered in their study and most bodies considered by Yomogida & Matsui (1984) had maximum temperatures of ≤700 K. Yomogida & Matsui (1984) concluded that the sintering temperature, i.e. the temperature at which sintering starts to become important, is around 600−650 K. In this manner they artificially favoured compaction at low temperatures. The value of E = 45 kcal mol-1 (E = 188 kJ mol-1) lies clearly outside of the interval given by Schwenn & Goetze (1978) for olivine dominated material and is too low for an H-chondritic composition. Typical values of the activation energy for creep processes are 295−530 kJ mol-1 in olivine dominated mantle rocks (Karato 2013), 270−720 kJ mol-1 for enstatite powders (Bystricky et al. 2011; Karato 2013), and 49−130 kJ mol-1 for ice (Goldsby & Kohlstedt 2001; Durham et al. 2001).
Considering the assumptions in Yomogida & Matsui (1984), their conclusions about the sintering temperature are valid. However, their findings have been simplified and generalised in other studies. Hevey & Sanders (2006) referred to Yomogida & Matsui (1984) and incorporated compaction at 700 K in their simulations. Later, Sahijpal et al. (2007) and Gupta & Sahijpal (2010) included a gradual reduction of porosity in the temperature range of 670−700 K in their models and Solano et al. (2012) used the same approach to model compaction of Vesta. Apart from the models by Henke et al. (2012) and Neumann et al. (2012), who consider compaction of chondritic planetesimals as a thermally activated creep process (and possibly the calculations of Akridge et al. 1997; Senshu 2006), most studies use the simplified parametrised approach based on Yomogida & Matsui (1984) and allow compaction in a rather small temperature window at ≈700 K (e.g. Akridge et al. 1998; Hevey & Sanders 2006; Sahijpal et al. 2007; Gupta & Sahijpal 2010) to study the insulating effect of regolith on the thermal evolution. Other studies which do not consider compaction explicitly, but discuss its effects on the results, still refer to some of the publications mentioned above (e.g. Elkins-Tanton et al. 2011; Moskovitz & Gaidos 2011).
In a previous study (Neumann et al. 2012), we investigated compaction of planetesimals with radii of ≤120 km by hot pressing using a creep-related approach combined with accretion. We compared the thermal evolution of initially consolidated bodies with that of initially porous ones and concluded that the maximum temperature in initially highly porous planetesimals is significantly higher than in consolidated bodies. This effect is particularly pronounced (temperature increase by up to 300%) for small planetesimals with radii of less than a few km. We also concluded that compaction starts at temperatures around 600 K (at high pressures) and could proceed to the temperatures above 1200 K (at low pressures). These findings are consistent with the results of Henke et al. (2012). Nevertheless, a systematic study is lacking that examines whether compaction achieved by the reduction of the porosity in a fixed temperature interval is an acceptable approximation and that discusses the implications of this approach.
In the present study, we compare two approaches to model compaction of planetesimals via hot pressing. The first one is based on the plastic deformation of dust grains and is referred to as the “creep related approach” in the following. The second one is based on the linear reduction of the porosity from its initial value to zero in the temperature interval 650−700 K, and is referred to as the parametrised approach. We show that the parametrised approach overestimates compaction by hot pressing due to the usage of a specific temperature interval. Furthermore, we investigate in which way ordered packing of grains, grain size, and activation energy influence the compaction process.
2. Model
We use the model of thermal evolution and differentiation of planetesimals described in Neumann et al. (2012) and Neumann et al. (2013). The energy balance is solved in a spherically symmetric planetesimal, using a 1D heat conduction equation where density, thermal conductivity, heat source density, and radius are functions of the porosity. The body is heated by 26Al and 60Fe and is initially porous (we note that in the current study we adopt a different abundance of 60Fe than in our previous papers; see Table 2). The porosity changes with time because of compaction via hot pressing. The hot pressing is implemented based on the experimental results from Schwenn & Goetze (1978) and on the geometric deformation theory from Kakar & Chaklader (1967) and Rao & Chaklader (1972) (also utilised by Yomogida & Matsui 1984). In Neumann et al. (2012, 2013) we considered one possible (orthorhombic) packing of equally sized spheres and a constant initial porosity of φ0 = 0.4 for the computation of the effective stress between dust grains in a compacting system.
Parameter values for the computation of the effective stress.
A similar model, but with an initial porosity of φ0 = 0.5, was used by Henke et al. (2012). In the present study, we consider four basic systems of packing in order to compare the resulting thermal evolution and porosity distribution with the ones from the parametrised approach, i.e. compaction occurs in the temperature interval 650 − 700 K. While the thermal evolution including the dependence of density, thermal conductivity, heat source density, and radius on porosity and the setup of the numerical model was described thoroughly in Neumann et al. (2012, 2013), we describe here in more detail the theoretical basis on the modelling of the porosity loss.
2.1. Theoretical approach to the modelling of compaction
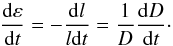
One of the most common forms of plastic flow is power law creep, which describes the
relation between the steady-state strain rate dε/dt and the effective stress during hot pressing,
 (1)where σ1 is the
effective stress acting on the material during creep, the stress exponent n is a material constant,
the factor C =
C(T) is a function of temperature,
and t is
time. The strain rate during densification of powder can be given in terms of the rate of
change of the relative density D = 1 − φ (or of the porosity
φ) as
(1)where σ1 is the
effective stress acting on the material during creep, the stress exponent n is a material constant,
the factor C =
C(T) is a function of temperature,
and t is
time. The strain rate during densification of powder can be given in terms of the rate of
change of the relative density D = 1 − φ (or of the porosity
φ) as
 (2)This is an approximation of the strain rate
during densification of a powder compact of the height l in a die and can be
applied in the first approximation to small planetary bodies. By setting
(2)This is an approximation of the strain rate
during densification of a powder compact of the height l in a die and can be
applied in the first approximation to small planetary bodies. By setting 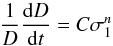 (3)and
 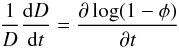 (4)we obtain
 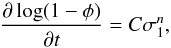 (5)where C and n need to be determined
experimentally and σ1 needs to be computed with respect to
the geometry of the material on a small scale. Thereby, σ1 changes with
the relative density during compaction. It is widely accepted that the effective stress
during hot pressing is not equal to the applied stress σ0 and depends
on the porosity φ. Often, an inversely linear dependence
σ1 =
σ0D-1 on the
relative density is used, suggested by Farnsworth &
Coble (1966) and so any specific intrinsic geometry of the material is neglected.
(5)where C and n need to be determined
experimentally and σ1 needs to be computed with respect to
the geometry of the material on a small scale. Thereby, σ1 changes with
the relative density during compaction. It is widely accepted that the effective stress
during hot pressing is not equal to the applied stress σ0 and depends
on the porosity φ. Often, an inversely linear dependence
σ1 =
σ0D-1 on the
relative density is used, suggested by Farnsworth &
Coble (1966) and so any specific intrinsic geometry of the material is neglected.
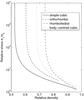 |
Fig. 1 Relative stress σ1/σ0 for the adopted four basic systems of packing plotted against the relative density D = 1 − φ (after Rao & Chaklader 1972, their Fig. 6). The lines are truncated at the respective critical density Dc (see Table 1), above which the effective stress is computed using a linear relationship between the value at Dc and the lithostatic pressure. |
The intrinsic geometry is accounted for in the approach of Rao & Chaklader (1972),  (6)which we adopt in the present study. Here,
σ0 is the lithostatic pressure inside a
planetesimal, the parameters α1 and β1 are constant
and reflect the assumptions on the packing of dust grains, and r is the numerical
grain radius (varying between r0 and rc; see Table
1 and Appendix A for more details). Figure 1 shows the
relative stress σ1/σ0 as a
function of the relative density D calculated according to Eq. (6). Prior to compaction (having a high porosity
and a low relative density), the value of the effective stress σ1 is several
orders of magnitude higher than that of the lithostatic pressure. During the ongoing
consolidation of the material, the relative stress approaches the value 1 meaning that the
effective stress converges against the lithostatic pressure if the relative density
approaches 1 (or the porosity approaches 0).
(6)which we adopt in the present study. Here,
σ0 is the lithostatic pressure inside a
planetesimal, the parameters α1 and β1 are constant
and reflect the assumptions on the packing of dust grains, and r is the numerical
grain radius (varying between r0 and rc; see Table
1 and Appendix A for more details). Figure 1 shows the
relative stress σ1/σ0 as a
function of the relative density D calculated according to Eq. (6). Prior to compaction (having a high porosity
and a low relative density), the value of the effective stress σ1 is several
orders of magnitude higher than that of the lithostatic pressure. During the ongoing
consolidation of the material, the relative stress approaches the value 1 meaning that the
effective stress converges against the lithostatic pressure if the relative density
approaches 1 (or the porosity approaches 0).
In the study by Kakar & Chaklader (1967) four
basic systems of packing are considered, defined by the geometric arrangement of spherical
grains and by the coordination number (i.e. the number Z of the contact points, an
average value for equally sized spheres). In the simple cubic packing (SCP) every grain
has four neighbours in a horizontal layer and two additional neighbours in the layers
above and below. Orthorhombic (ORP) packing corresponds to six neighbours in a layer (plus
two above and below). The rhombohedral packing (RHP) has coordination number 12 and the
body-centred cubic packing (BCCP) 8. A geometric theory was introduced by Kakar & Chaklader (1967) in order to treat the
deformation of the spheres involved in any of these four packings and thus the loss of
porosity in a dust sample. We note that according to this theory, the deformation that
corresponds to BCCP is a two-stage process. We refer to the two stages as BCCP1 and BCCP2
(see Appendix A for the detailed information). Based
on the above model, Rao & Chaklader (1972)
introduced a method for the computation of the effective stress acting on a dust particle
(see Eq. (6)). Combination of the effective
stress from Eq. (6) with Eq. (5) yields  (7)There are two parameters C =
C(T) and n which depend on the
temperature and on the material properties (such as activation energy). Experimental data
for olivine is available from the laboratory experiments of creep of olivine during
hot-pressing performed by Schwenn & Goetze
(1978). They provide a fit obtained for spherical olivine grains with radii
≤50 μm:
(7)There are two parameters C =
C(T) and n which depend on the
temperature and on the material properties (such as activation energy). Experimental data
for olivine is available from the laboratory experiments of creep of olivine during
hot-pressing performed by Schwenn & Goetze
(1978). They provide a fit obtained for spherical olivine grains with radii
≤50 μm:  (8)Here, B is a constant factor
between 5.06 ×
10-19 and 1.71 ×
10-18 m3Pa−3/2s-1, m is the grain size exponent, E is the activation energy
in kJ mol-1,
R is the
gas constant in kJ mol-1 K-1, and b is the grain radius in m (see Table 2 for the adopted values). Consequently, we obtain
(8)Here, B is a constant factor
between 5.06 ×
10-19 and 1.71 ×
10-18 m3Pa−3/2s-1, m is the grain size exponent, E is the activation energy
in kJ mol-1,
R is the
gas constant in kJ mol-1 K-1, and b is the grain radius in m (see Table 2 for the adopted values). Consequently, we obtain
 (9)Apart from different numbers of contact
points, all four packings have different initial porosities φ0 (or initial
densities D0) and critical porosities
φc (or densities Dc) at which the
geometric model is no longer valid, and different parameters to be used in Eq. (6). These parameters and the parameters that
will be described in Appendix A are summarised in Table 1.
(9)Apart from different numbers of contact
points, all four packings have different initial porosities φ0 (or initial
densities D0) and critical porosities
φc (or densities Dc) at which the
geometric model is no longer valid, and different parameters to be used in Eq. (6). These parameters and the parameters that
will be described in Appendix A are summarised in Table 1.
Physical parameter values used for the models.
Initial porosity φ0, initial thermal conductivity
k0, average final porosity
 , initial planetesimal radius
R0, final planetesimal radius
Rf, thickness of the porous layer
Dp, central maximum temperature
Tmax, and central pressure
Pc at
, initial planetesimal radius
R0, final planetesimal radius
Rf, thickness of the porous layer
Dp, central maximum temperature
Tmax, and central pressure
Pc at
 .
.
2.2. Structural evolution of a planetesimal
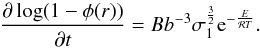
We approximate the continuous accretion of a body by considering instantaneous formation
at a certain time t0 relative to the formation of the
calcium-aluminium-rich inclusions (CAIs), at which accretion is completed. The
planetesimals accrete as porous aggregates and undergo compaction via hot pressing due to
increasing temperature in the presence of stress. Assuming a terminal radius
 , which corresponds to a body with the
porosity equal to zero, the initial radius Rp(t0) at
the accretion onset time t0 is calculated using the prescribed
uniform initial porosity φ0. In the case of instantaneous
formation the initial radius is larger than the terminal radius and is given by
, which corresponds to a body with the
porosity equal to zero, the initial radius Rp(t0) at
the accretion onset time t0 is calculated using the prescribed
uniform initial porosity φ0. In the case of instantaneous
formation the initial radius is larger than the terminal radius and is given by
 (10)The radius changes with time as a result of
sintering converging against the terminal radius for falling average porosity
(10)The radius changes with time as a result of
sintering converging against the terminal radius for falling average porosity
 at the time t:
  (11)However, the terminal radius can only be
reached if the body becomes completely consolidated, which is usually not the case. Thus,
a planetesimal experiences a macroscopic change (shrinkage) during the microscopic change
(compaction) and the depth at which a particle is located changes with the radius and the
porosity distribution.
(11)However, the terminal radius can only be
reached if the body becomes completely consolidated, which is usually not the case. Thus,
a planetesimal experiences a macroscopic change (shrinkage) during the microscopic change
(compaction) and the depth at which a particle is located changes with the radius and the
porosity distribution.
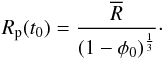
 |
Fig. 2 Porosity after the cooling of the body below 300 K as a function of depth.
Left panel: |

3. Results
Compaction of a planetesimal via hot pressing is a direct result of heating by the
radioactive decay of the short-lived isotopes 26Al and 60Fe. The initial concentrations of these isotopes in a
planetesimal depend on the formation time relative to the formation of the CAIs. Because of
the rapid decline in the concentration of these heat sources, a late formation time reduces
the amount of heating significantly. The conductive heat loss through the surface
counteracts the internal heating by radiogenic heat sources. The efficiency of this cooling
depends on the surface-to-volume ratio of a body, i.e. the smaller the body, the more
efficient the cooling. Another factor that influences the thermal evolution of a
planetesimal is the presence of porous material which has a lower thermal conductivity
compared to consolidated material and reduces conductive cooling. Assuming equal composition
and material properties, a rough measure of the compaction potential of a planetesimal is
the combination of its size (terminal radius ; see Eq. (11)) and formation time (t0, relative to the formation of the
CAIs). In the following we will consider two bodies for which we choose
 (case S refers to small body) and
 (case B refers to big body). For both cases,
we compare the extent of compaction using either the creep-related approach described in
Sect. 2 (models Screep and Bcreep; see Table 3), or the parametrised approach, assuming linear
decrease of the porosity in the temperature range 650–700 K
(models Spar and
Bpar; see Table
3). The radii were chosen in order to simulate a
relatively small and a larger planetesimal, whereas the corresponding formation times were
chosen such that the bodies would neither compact completely, nor would they not compact at
all. The assumed composition and the physical parameters correspond to an H chondrite (see
Table 2).
(case B refers to big body). For both cases,
we compare the extent of compaction using either the creep-related approach described in
Sect. 2 (models Screep and Bcreep; see Table 3), or the parametrised approach, assuming linear
decrease of the porosity in the temperature range 650–700 K
(models Spar and
Bpar; see Table
3). The radii were chosen in order to simulate a
relatively small and a larger planetesimal, whereas the corresponding formation times were
chosen such that the bodies would neither compact completely, nor would they not compact at
all. The assumed composition and the physical parameters correspond to an H chondrite (see
Table 2).
For each case, i.e. Screep, Spar, Bcreep, and Bpar, we investigate the thermal and structural evolution assuming four different packings of dust grains with the corresponding initial porosity and radius, as well as the corresponding computation of the effective stress (for the creep related approach, see also Appendix A). All other parameters are fixed and if not stated otherwise are identical to the parameters used in Neumann et al. (2012).
We further vary the activation energy E and the grain size b for case Bcreep; both parameters strongly
influence the compaction process. The activation energy is varied between 235 kJ mol-1 and 477 kJ mol-1 (see Sect. 3.2) corresponding to the measured activation energy for olivine (Schwenn & Goetze 1978). Olivine is assumed to
dominate the rheology in ordinary chondrites. As a reference value we use E = 356 kJ mol-1 (Schwenn & Goetze 1978). The grain size of the primordial material before
compaction is an unknown parameter. It has been constrained by determining the size of the
matrix grains in chondritic meteorites. These grains tend to be smaller than 5μm (Hutchison
2004). However, these grains may result from coarsening of smaller particles.
Another constraint is provided by the interplanetary dust particles that may serve as a
substitute of protoplanetary nebular particles. According to Rietmeijer (1993), the radii of interplanetary dust particles scatter from
 to
to
 , having a typical
size of 0.1−0.2μm. We use as a reference
value a grain radius of b =
1μm in the present study, but also investigate the
influence of the grain size on compaction by varying b between 10-5 m and 10-7 m (see Sect. 3.3). The possibility of a non-trivial particle radius
distribution that would act to reduce porosity by filling the gaps between larger grains
with smaller ones is neglected here, as well as the possibility of irregular shapes, which
would act to reduce the contact areas thereby increasing the porosity.
, having a typical
size of 0.1−0.2μm. We use as a reference
value a grain radius of b =
1μm in the present study, but also investigate the
influence of the grain size on compaction by varying b between 10-5 m and 10-7 m (see Sect. 3.3). The possibility of a non-trivial particle radius
distribution that would act to reduce porosity by filling the gaps between larger grains
with smaller ones is neglected here, as well as the possibility of irregular shapes, which
would act to reduce the contact areas thereby increasing the porosity.
If not otherwise stated, the parameters b = 10-6 m and E = 356 kJ mol-1 are used in the models.
3.1. Parametrised vs. creep related compaction
Figure 2 shows final porosity profiles obtained for model Bcreep and Bpar (left panel), and Screep and Spar (right panel). Four initial structures (packings) are considered, for which the initial (uniform) porosities vary between 26% and 47% (see Table 1).
The planetesimal starts as a porous body that heats up as a result of the decay of 26Al and 60Fe. The temperature profile in such a body with a homogeneous structure and heat source distribution is monotonous with a maximum at the centre. Thus, porosity reduction starts in the central region and the compaction front proceeds from the inside outwards. Thereby, the radius and the bulk volume decrease, while the bulk density increases. Eventually, a stable porosity profile is established (see Fig. 2). The porosity as a function of radius varies nearly exponentially between 0 in the completely compacted region and the initial porosity φ0 in an outer layer consisting of primordial material. This insulating blanket of a variable thickness is retained at the surface, where, because of low temperature and pressure, compaction does not occur. While for decreasing porosity the heat source density increases and promotes a stronger heating, the decreasing thickness of the insulating porous layer and the shrinking radius enhance cooling of the body. The interplay of these three factors determines the temperature evolution.
For the parametrised approach of compaction (cases Spar and Bpar), both bodies consolidate completely in the centre and have a primordial porous layer of a variable thickness at the surface. The change from the consolidated region to the porous layer is very abrupt. This behaviour can be explained by the temperature profile, which is very flat apart from the porous part where the temperature decreases rapidly toward the surface. The specific shape of the profile is even more pronounced due to the insulating effect of the outer low-conductivity region. As a consequence, when the central region exceeds the temperature of 700 K, the entire body except the outer ≲10 km (for Bpar) or ≲4 km (for Spar) experiences similar heating and compacts to φ = 0, the porous blanket Dp being rather thin (5.5−9.5 km for Bpar and 1.1−3.4 km for Spar; see Table 3). Using a different interval for sintering, e.g. 670−700 K, the same scenario would apply in general. The porous layer will be slightly thicker and the porosity profile will have a steeper slope between the compacted and porous regions. The lack of strong insulation and the decline of the heat production inhibit further temperature increase. Thus, for Spar and Bpar, Tmax varies between 706−734 K and 734−736 K, respectively, and remains below 800 K in all cases.
In contrast, for the creep related approach, the porosity changes nearly exponentially
with time and temperature. Compaction of the planetesimal is less efficient because a
temperature of 700 K is not
sufficient to achieve φ =
0 even for the larger body with a reference radius of
 km. Thus, the low conductivity of the
porous material provokes further heating of the interior, until temperatures of up to
925 K (case Screep) or only up to
739 K (case Bcreep) are reached. Even for
those temperatures, the porosity reduction is either moderate (case Bcreep), or nearly non-existent
(case Screep, the
profile corresponding to the packing RHP in Fig. 2).
The outer porous layer remains significantly thicker than for the parametrised approach
with values between 20−25 km
for Bcreep and more
than 2 km (or even comprising the entire body) for Screep. As a consequence, using
the creep related approach for hot pressing results in much higher average porosities
after compaction in contrast to the parametrised approach. For case Screep, the average porosity is a
factor of 1.2−1.9 larger than
for Spar, and for
case Bcreep it is a
factor of 1.8−2.8 larger than
for Bpar (we note
that different factors correspond to different packings).
km. Thus, the low conductivity of the
porous material provokes further heating of the interior, until temperatures of up to
925 K (case Screep) or only up to
739 K (case Bcreep) are reached. Even for
those temperatures, the porosity reduction is either moderate (case Bcreep), or nearly non-existent
(case Screep, the
profile corresponding to the packing RHP in Fig. 2).
The outer porous layer remains significantly thicker than for the parametrised approach
with values between 20−25 km
for Bcreep and more
than 2 km (or even comprising the entire body) for Screep. As a consequence, using
the creep related approach for hot pressing results in much higher average porosities
after compaction in contrast to the parametrised approach. For case Screep, the average porosity is a
factor of 1.2−1.9 larger than
for Spar, and for
case Bcreep it is a
factor of 1.8−2.8 larger than
for Bpar (we note
that different factors correspond to different packings).
It should also be noted that the choice of the packing has a larger influence on small bodies with low pressure than on larger bodies with higher pressure. This can be seen in the final structure (Fig. 2 and Table 3) and therefore also has a consequence on the temperature evolution. The maximum temperatures vary by less than 40 K for different packings in the case of Spar, Bcreep, and Bpar, but for Screep variation of the maximum temperature reaches 120 K. This finding is the result of the low pressure in small bodies, resulting in a strong variation of the porosity profiles for different packings.
Table 3 lists initial and final properties for all cases. The parameter IT defines the temperature interval of compaction in the centre of the body under consideration. For creep-related models, the lower value of IT corresponds to the temperature at which the porosity changes by 1% of its initial value φ0, while the upper value corresponds to the temperature at which the porosity decreases below 10-5. For parametrised models, the lower and upper values of IT indicate the temperatures at which compaction starts and is completed, respectively (by definition, 650–700 K). If only one value is given, then the centre did not compact completely. In general, for the large body case (i.e. Bcreep with an initial central pressure of 2.1−3.3 MPa depending on the value of φ0), IT varies around 650−740 K. For the small body case (i.e. Screep with an initial central pressure of 0.021−0.033 MPa), the interval IT varies around 740−925 K and for the packings RHP and BCCP, compaction in the centre stops even before reaching φ = 0. In the latter cases, the maximum temperature of 808 K or 869 K were not sufficiently high to reach φ = 0. It should be noted that IT has been constrained for the centre of the respective body and the differences in IT between the parametrised and the creep related cases are even larger in the more shallow regions.
To some extent, the timescale of the compaction can be estimated by using the relation
 , where η =
B-1b3e
E/RT
(i.e. by inverting Eq. (9)). In the following we demonstrate this in two examples: Bcreep with ORP (see Fig. 6, left panel) and Screep with RHP (see Fig. 3).
, where η =
B-1b3e
E/RT
(i.e. by inverting Eq. (9)). In the following we demonstrate this in two examples: Bcreep with ORP (see Fig. 6, left panel) and Screep with RHP (see Fig. 3).
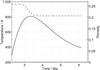 |
Fig. 3 Central temperature (solid line) and central porosity (dashed line) as functions of time for the case Screep with RHP. |
Bcreep with ORP: the central porosity changes by 1% of its initial value of φ0 = 0.3954 at the temperature of 655 K (see Table 3). The central pressure σ0 at this time is 2.5 MPa. At the relative density of ≈0.61, the effective stress is σ1 ≈ 200σ0 ≈ 500 MPa. For this effective stress and for the temperature of T = 655 K, we obtain tcomp ≈ 52Ma. Subsequently, the temperature increases, while the effective stress and the porosity decrease. At t ≈ 6.6 Ma and T ≈ 722 K the values of φ ≈ 0.3, σ1 ≈ 10σ0 and σ0 ≈ 2.9 MPa follow. Thus, tcomp is reduced to 8.6 Ma. In fact, the pores around the centre close at t = 12.8 Ma ≤6.6Ma + 8.6Ma = 15.2 Ma predicted by the last estimate (see Fig. 6; we note that the temperature increases further up to 739 K).
Screep with RHP: the central porosity changes by 1% of its initial value of φ0 = 0.2595 at the temperature of 740 K (see Table 3). The central pressure σ0 at this time is 0.033 MPa. At the relative density of ≈0.7431, the effective stress is σ1 ≈ 100σ0 ≈ 3.3 MPa. For this effective stress and for the temperature of T = 740 K, we obtain tcomp ≈ 53 Ma. Subsequently, the temperature increases, while the effective stress and the porosity decrease. At t ≈ 3.34 Ma and T ≈ 808 K the values of φ ≈ 0.22, σ1 ≈ 13σ0, and σ0 ≈ 0.0334 MPa follow. Thus, tcomp is reduced to 8.6 Ma. However, the temperature falls right after reaching 808 K rapidly (see Fig. 3 below) and compaction stalls.
3.2. Variation of the activation energy
In the following, we vary the creep activation energy for model Bcreep within the interval E = 356 ± 121 kJ mol-1 (Schwenn & Goetze 1978). The general compaction scenario is identical to the one described above. Figure 4 shows the final porosity profiles and Table 4 lists the final properties of the planetesimal obtained for different values of the activation energy. The final average porosity is ≈3% for E = 235 kJ mol-1 and increases monotonously with increasing value of E. For the maximum value of E = 477 kJ mol-1 compaction is almost negligible and the final porosity remains ≈φ0. Although the interior structure differs significantly due to a variation in E, the maximum temperature in the centre increases only moderately with increasing E by ≈2% from 727 K to 740 K. This is caused by the decline in the heat production with time. Even if the interior remains more porous with increasing E and could heat up efficiently because of its low thermal conductivity, not enough energy is available to strongly heat the interior. Smaller activation energy implies compaction onset at a lower temperature and a shift of IT to lower temperatures. Consequently, a larger part of the interior consolidates completely, and the thickness of the porous layer is smaller than for higher values of E, which also implies a weaker isolation and stronger cooling leading to a slightly lower Tmax. The interval IT experiences a considerable shift. While for E = 235 kJ mol-1 compaction in the centre takes place at T ≥ 440 K, for E = 356 kJ mol-1 it takes place at T ≥ 650.
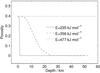 |
Fig. 4 Porosity as a function of depth for |
For the extreme case of E = 477 kJ mol-1 the threshold temperature for compaction has not been reached and thus the porosity change is infinitesimal.
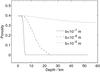 |
Fig. 5 Porosity as a function of depth for |
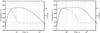 |
Fig. 6 The central temperature (solid lines) and the central porosity (dashed lines) as
functions of time. Left panel: case
|
3.3. Variation of the grain size
In this section we address the influence of the grain size while keeping all other
parameters fixed. Figure 5 shows the final porosity
profiles. The other output parameters such as average final porosity
, final planetesimal radius Rf, thickness of
the porous layer Dp, central maximum temperature
Tmax, and the temperature interval
IT in which compaction
took place in the centre, are listed in Table 5.
All parameters are identical to those used for the case Bcreep with ORP, except the grain
size b. There
is a straightforward relationship between the adopted value of the grain radius and the
extent of compaction. For decreasing b the final average porosity and the maximum
temperature decrease as well. Assuming b = 10-5 m (i.e. b = 10μm), the porosity starts
decreasing at a temperature of 716 K, but as the maximum temperature is only 740 K, compaction stops at φ = 0.33 in the centre. For
the reference case with b =
10-6 m, a substantial part of the interior becomes
completely consolidated. With decreasing grain size, i.e. b = 10-7 m for
the case Bcreep,
compaction is even more effective, taking place between 597 K and 694 K in the centre. Although the
temperature interval IT for
b =
10-6 m is closer to 650−700 K, at smaller depths the interval
changes towards higher temperatures. Eventually, a porous outer layer with a thickness of
only ≈5 km is established for
b =
10-7 m. Similarly to the effect of the activation energy, a
smaller value of b favours creep at lower temperatures. This leads to
a thinner insulating layer and better cooling, resulting in lower temperatures and thus
lower Tmax.
In conclusion, it is easier to achieve consolidation of a fine-grained material via hot
pressing than for coarse-grained material. For the latter, higher temperatures than those
that are possible for the pair are needed to change the porosity further
(e.g. through an earlier formation time). We have explored this aspect with some test runs
by increasing the grain radius even further up to the size of 1 cm appropriate for chondrules (Weisberg et al. 2006). For that extreme case, some
residual porosity was present even at super-solidus temperatures of the metal phase and
even of the silicate phase (T
≥ 1425 K) of ordinary chondritic material. This means that at moderate
pressures and for certain values of activation energy, compaction takes place
simultaneously with the production of partial melt (see Discussion).
3.4. Effective stress
The compaction model used considers that for porous material the effective stress can be
several orders of magnitude higher than the stress caused simply by lithostatic pressure
(see Fig. 2). In Fig. 6 we show the influence of the efffective stress on the evolution of the central
temperature (solid lines) and of the central porosity (dashed lines). The left panel
corresponds to the case with ORP and the associated effective
stress σ1, whereas the right panel corresponds to
a simulation where the lithostatic pressure was used instead of the effective stress.
While in the first case the central porosity changes by 1% of its initial value
φ0 at the temperature of 655 K and reaches
zero at 739 K (see Table 3), in the second case
compaction requires a higher threshold temperature and starts at 732 K. Compaction is,
however, completed for 739 K as in the case using the effective stresses. Additional
output parameters of this simulation are  %, Rf = 57.57 km,
Dp =
41.20 km, and Tmax = 739 K (for the same case with a
proper σ1 we had
%, Rf = 57.57 km,
Dp =
41.20 km, and Tmax = 739 K (for the same case with a
proper σ1 we had
 %, Rf = 54.12 km,
Dp =
23.70 km, and Tmax = 739 K; see Table 3). Although the maximum temperature is the same, the
smaller values of σ0 compared to those of σ1 (see Fig.
1) lead to a less effective compaction. Thus, the
insulation of the centre is more effective (Dp = 41.20 km) and the temperature of
≥700 K in the centre can be
maintained for more than 60 Ma. This allows the centre to compact to φ = 0 after ≈40 Ma (in the standard case with
σ1 only ≈8 Ma were needed, compare the compaction
time tcomp in Table 3).
%, Rf = 54.12 km,
Dp =
23.70 km, and Tmax = 739 K; see Table 3). Although the maximum temperature is the same, the
smaller values of σ0 compared to those of σ1 (see Fig.
1) lead to a less effective compaction. Thus, the
insulation of the centre is more effective (Dp = 41.20 km) and the temperature of
≥700 K in the centre can be
maintained for more than 60 Ma. This allows the centre to compact to φ = 0 after ≈40 Ma (in the standard case with
σ1 only ≈8 Ma were needed, compare the compaction
time tcomp in Table 3).
The compaction timescale can be roughly estimated as in 3.1. If not the effective stress, but the central lithostatic pressure is used, for T = 739 K and σ0 = 2.5 MPa we obtain tcomp ≈ 87 Ma. However, the pressure increases upon compaction up to the value of 4.6 MPa. For this value, tcomp ≈ 35 Ma follows. This agrees very well with the results obtained from the simulations.
The porosity and temperature in Fig. 6 show that compaction by hot pressing is influenced strongly by the interplay of the temperature and the applied stresses and their temporal evolution. A lack of pressure can be compensated by heating far above some critical temperature (onset of compaction at 732 K). Furthermore, although for t0 = 3.2 Ma a higher maximum temperature than 739 K cannot be reached, a drastically prolonged heating of the centre due to an effective insulation by the porous shell is possible, leading eventually to the closure of the pores.
4. Summary and discussion
Here we compare hot pressing via the creep related approach (Kakar & Chaklader 1967; Rao & Chaklader 1972; Schwenn & Goetze 1978) with the simplified parametrised approach used by several studies (e.g. Hevey & Sanders 2006; Sahijpal et al. 2007; Gupta & Sahijpal 2010; Solano et al. 2012). Using the creep related approach, hot pressing is triggered when a powder assemblage reaches a certain temperature. This critical (or threshold) temperature is a function of the effective stress for otherwise fixed parameters. The higher the effective stress, the lower the critical temperature. Thus, the threshold temperature varies with depth (pressure) within a planetesimal. Since compaction is a creep process, to fully compact the material, this threshold temperature must either be sustained for a sufficiently long time, or higher temperatures are necessary to enhance the compaction rate. Thus, compaction in a thermally evolving planetesimal takes place in a certain temperature interval for a given stress. In our study, we found that for a central pressure of 200−300 MPa (equivalent to a planetesimal with a radius of 500 km) the temperature interval is 597−690 K, for a pressure of 2−3 MPa (equivalent to a planetesimal with a radius of 50 km) it is 645−739 K, and for a pressure of 0.02 − 0.03 MPa (equivalent to a planetesimal with a radius of 5 km) it is 740−925 K, assuming an activation energy of 356 kJ mol-1 (Table 2).
In conclusion, only for a rather narrow parameter space or pressure range in a planetesimal, compaction occurs approximately between 650 K and 700 K as used in the parametrised approach. Depending on the pressure, initial grain size, activation energy and initial porosity, the temperature interval is instead 500 − 1000 K. For some extreme values of E and b, the upper boundary exceeds even the solidus temperature of the silicates. Significant differences in the interior structure and temperature evolution are the consequence; with the simplified approach compaction is overestimated predicting final porosities that are too low and thus a cooling that is unrealistically fast.
For the small body of 5 km radius and a formation time t0 of 2.3 Ma the
porous layer is at least 1 km
thinner and for a body of 50 km radius and t0 = 3.2 Ma at least 12 km, if the parametrised approach is used.
Differences in the maximum temperatures between the two approaches can be observed,
especially for small bodies (radius ≈ ).
The maximum temperature varies by up to 32% as the consequence of different extents of compaction.
).
The maximum temperature varies by up to 32% as the consequence of different extents of compaction.
We note that although porosity plays a substantial role in the thermal evolution and interior structure of undifferentiated planetesimals, in the case of high levels of partial melt and efficient differentiation, effects associated with porosity and compaction would be painted over in the subsequent evolution.
The parameter that has the strogest influence is the activation energy E of the material. A small value of E shifts the onset of compaction to lower temperatures, and a high E to higher temperatures. For our cases with E = 477 kJ mol-1, some left-over porosity is observed in the centre directly before the melting of the metal-rich phase begins. This in fact requires a simultaneous treatment of porosity loss and melting. Experiments by e.g. Kohlstedt (2002) and Jin et al. (1994) suggest that a few percent of melt can reduce the creep strength by more than one order of magnitude because of the fast diffusion of the melt (see also Karato 2013). Therefore, it is likely that in these specific cases partial melting provokes quasi-instantaneous compaction on a geological timescale.
The activation energy is in general related to the mineralogical composition. For planetesimals with a “wet” rheology, i.e. containing hydrated silicates or ice, as suggested for carbonaceous chondritic compositions that are dominated by serpentine, the activation energy is lower than for dry material and thus lower compared to the ordinary chondritic composition assumed in the current study (Hilairet et al. 2007). For the ordinary chondritic composition it is assumed that olivine dominates the rheology. On the other hand, the creep activation energy of an enstatite chondritic composition seems to be higher than that of the ordinary chondritic composition (Karato 2013). This would also suggest that a carbonaceous chondritic body will compact at lower temperatures than the ordinary chondritic and the enstatitic ones at similar pressure. It should be noted, however, that the pre-factor B, the stress exponent n, and the grain size exponent m need to be adjusted to the rheological properties of the material.
The shift of the compaction temperature interval to lower temperatures in a body consisting of a carbonaceous chondritic assemblage also implies that compaction and dehydration of hydrated minerals (≈298–1073 K, Castillo-Rogez 2011) occur simultaneously. The shrinkage due to hot pressing overlaps with the shrinkage resulting from the density changes of the silicate minerals due to the dehydration on the one hand and by the filling of the pores with the water freed by the dehydration process on the other hand. Furthermore, dehydration of certain minerals proceeds in some cases simultaneously with the hydration of other silicate minerals, which could be accompanied by expansion. Thus, compaction of planetesimals that contained water in some form is an even more complex issue than compaction of rocky bodies.
Four different packings have been compared on the compaction process. The assumption on the
packing of the dust grains influences the initial porosity and is particularly important for
small bodies with  ; a variation in Tmax by up to
16% has been observed. With
increasing body radii the offset becomes gradually smaller and for a planetesimal radius of
50 km and larger the choice of the suitable packing of grains is less important.
; a variation in Tmax by up to
16% has been observed. With
increasing body radii the offset becomes gradually smaller and for a planetesimal radius of
50 km and larger the choice of the suitable packing of grains is less important.
We have further examined the influence of the effective stress on the compaction history.
The results indicate that neglecting the effective stress, which acts on the contact points
of the grains in case of porous material, and assuming only the lithostatic pressure leads
to a longer timescale of compaction and to a higher threshold temperature at which
compaction starts. Thus, compaction is underestimated when neglecting the effective stress.
This finding might have implications for a number of studies that calculate or estimate the
porosity reduction of a porous layer and only consider the lithostatic pressure for
compaction (e.g. Wieczorek et al. 2013; Nimmo et al. 2003; Fu
& Elkins-Tanton 2014). The timescale of the porosity loss tcomp varies in
our calculations between  and
and  (see Table 3), which argues against assumptions of
fixed compaction timescales utilised in some planetesimal studies.
(see Table 3), which argues against assumptions of
fixed compaction timescales utilised in some planetesimal studies.
In the current approach, we neglect compaction prior to hot pressing and assume that the
initial porosity φ0 of the material is limited by the
porosities of the random close and random loose packing. The initial porosity, however, may
be reduced by a purely mechanical mechanism called cold pressing, which is driven by the
applied pressure. Cold pressing does not impose any further requirements and can act at any
temperature. Porosity evolution due to cold pressing is an important topic in the study of
dust coagulation and planetesimal formation in protoplanetary discs and was studied in
theory in e.g. Ormel et al. (2007), Suyama et al. (2008), Zsom et al. (2010, 2011), Kataoka et al. (2013a). This kind of compaction was also
discussed and investigated through the laboratory experiments of Guettler et al. (2009) and the numerical experiments of Kataoka et al. (2013b). The latter authors derived a
relation for the change of the relative density D with the applied stress σ0. In the limit
σ0 →
∞, the maximum relative density of Dmax = 0.58 (or
minimal porosity  is obtained. In conclusion, it is only
possible to compact porous material by cold pressing to the limit of φ = 0.42. Since SCP with
φ0 =
0.4764 is the only model with an initial porosity of φ0 ≥ 0.4, we
neglect this kind of compaction in the present study.
is obtained. In conclusion, it is only
possible to compact porous material by cold pressing to the limit of φ = 0.42. Since SCP with
φ0 =
0.4764 is the only model with an initial porosity of φ0 ≥ 0.4, we
neglect this kind of compaction in the present study.
As a further complication, however, recent dynamic cold pressing experiments of Beitz et al. (2013) indicate that this process might have been important during accretion. Beitz et al. (2013) used aluminium cylinders as projectiles to compact the chondrite-analog samples with the initial porosities of 39 − 70% in a velocity range of 1200−165 m s-1, down to the porosities of 1−30%. Taking the projectile velocity as velocity of the accreting dust particles suggests that a smaller initial porosity φ0 should be used than the values corresponding to the packings. Moreover, this cold pressing experiment does most certainly result in crushing of the dust grains, meaning that the geometric model for the computation of the effective stress would be not applicable without further adjustments. Here future studies are needed in order to assess how this might change compaction and the structural and thermal evolution of a planetesimal.
Online material
Appendix A: Geometric model for the computation of the effective stress
The geometric approach to the deformation theory of hot pressing and the conclusions for the plastic flow have been investigated by Kakar & Chaklader (1967) and Rao & Chaklader (1972). However, the detailed derivation of the formulae was not provided. Thus, we present the theory in detail and improve some aspects that were treated in a simplified manner in the studies mentioned above.
In the study by Kakar & Chaklader (1967) four basic systems of packing are considered, defined by the geometric arrangement of the grains and by the coordination number (this is the number Z of the contact points, an average value for equally sized spheres). In the simple cubic packing (SCP) every grain has four neighbours in a horizontal layer and two additional neighbours in the layers above and below. Orthorhombic (ORP) packing corresponds to six neighbours in a layer (plus two above and below). The rhombohedral packing (RHP) has coordination number 12 and the body-centred cubic packing (BCCP) 8. Although in a unidirectional force field the body-centred cubic packing is an unstable arrangement, we consider this case for the sake of completeness. Furthermore, although stability varies with the packing type, we assume that the symmetry is sustained throughout the whole compaction process. Assuming homogeneous and isotropic composition of the grains and symmetrical spread upon application of stress, for different packings the spheres will deform to polyhedra upon complete compaction, e.g. cubes for SCP, hexagonal prisms for ORP, rhombic dodecahedra for RHP, and tetrakaidecahedra for BCCP. During the deformation, necks develop at the contact points. The form of the grains will change, whereas the volume will remain constant.
For each kind of packing a specific unit cell of a certain form which is occupied by a
dust particle is considered. The form of a unit cell is defined by the polyhedra
mentioned above. From Figs. A.2–A.4, the volume V of such a unit cell can
be computed. For SCP, this is the volume of a cube, and, since
 , we obtain
  (A.1)For ORP, the volume of a hexagonal prism is
 (A.2)For RHP we compute
  (A.3)and for BCCP
  (A.4)Thus, the volume of the unit cell can be
expressed as the product of a constant β1 (the pre-factor of the bracket) and
the power
(A.4)Thus, the volume of the unit cell can be
expressed as the product of a constant β1 (the pre-factor of the bracket) and
the power  .
.
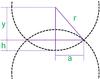 |
Fig. A.1 General deformation geometry at any contact point between two grains. |
The deformation of the BCC packing proceeds in two stages. For this reason we describe the theory for the other cases and the first stage of the BCCP deformation first, and then consider the second deformation stage of the BCC packing separately.
Prior to the hot pressing, the grain touches the surface of the unit cell at
Z points
where the neighbouring grains touch each other (Z1 for BCCP).
During compaction, the grains deform plastically at the contact points and develop
necks. The cross-section of such a neck between two grains has a circular form and is
called the face (the contact points have evolved to contact cross-sections). Still, the
volume of the particle needs to be kept constant. Thus, the current radius of the grain
is assumed to increase and the volume of those parts of the grain now lying outside of
the unit cell (the caps) need to be subtracted from the current sphere volume (we note
that the initial sphere volume is normalised to 1): 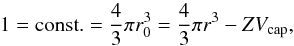 (A.5)where r is the current grain
radius and
(A.5)where r is the current grain
radius and  (A.6)is the volume of a cap. Using the relation
h = r −
y defined by the geometry of the packings (Fig.
A.1), we obtain the normalised volume of the
particle for the first three packings as
(A.6)is the volume of a cap. Using the relation
h = r −
y defined by the geometry of the packings (Fig.
A.1), we obtain the normalised volume of the
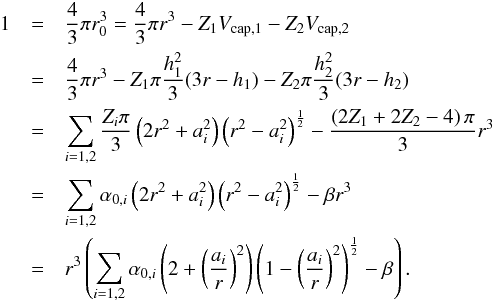
particle for the first three packings as ![Mathematical equation: \appendix \setcounter{section}{1} \begin{eqnarray} 1&=&\frac{4}{3}\pi r_{0}^{3}=\frac{4}{3}\pi r^{3}-ZV_{\text{cap}} \nonumber \\[1mm] &=& \frac{4}{3}\pi r^{3} -\frac{Z \pi}{3} \left( r-y \right) ^{2} \left( 2r+y \right) \nonumber \\[1mm] &=& \frac{4}{3}\pi r^{3} -\frac{Z \pi}{3} \left(2 r^{3}-2r^{2}\sqrt{r^{2}-a^{2}}-a^{2}\sqrt{r^{2}-a^{2}} \right) \nonumber \\[1mm] &=& \frac{4}{3}\pi r^{3} -\frac{Z \pi}{3} 2r^{3}+\frac{Z \pi}{3} \left( 2r^{2}+a^{2} \right) \sqrt{r^{2}-a^{2}} \nonumber \\[1mm] &=& \frac{Z\pi}{3} \left( 2r^{2}+a^{2} \right) \left(r^{2}-a^{2} \right) ^{\frac{1}{2}}-\frac{\left( 2Z-4 \right) \pi}{3} r^{3} \nonumber \\[1mm] &=& \alpha \left( 2r^{2}+a^{2}\right) \left( r^{2}-a^{2} \right) ^{\frac{1}{2}}-\beta r^{3} \nonumber \\[1mm] &=& r^{3}\left( \alpha \left( 2+\left( \frac{a}{r} \right)^{2} \right) \left( 1-\left(\frac{a}{r} \right) ^{2} \right) ^{\frac{1}{2}}-\beta \right) . \label{part} \end{eqnarray}](/articles/aa/full_html/2014/07/aa23648-14/aa23648-14-eq387.png) (A.7)This defines the geometric constants
α and
β from
Table 1 as α = Zπ/
3 and β =
(2Z − 4)π/ 3. From Eq. (A.7) the current radius of the particle is
computed:
(A.7)This defines the geometric constants
α and
β from
Table 1 as α = Zπ/
3 and β =
(2Z − 4)π/ 3. From Eq. (A.7) the current radius of the particle is
computed:
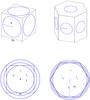 |
Fig. A.2 Unit cells and their intersections with an inscribed grain for the SCP and the ORP (top row from left to right) along with the top views of the unit cells and of the grain at its initial and critical (final) stages of deformation (bottom row). |
![Mathematical equation: \appendix \setcounter{section}{1} \begin{equation} r= \left[ \alpha\left( 2+\left( \frac{a}{r} \right)^{2}\right) \left( 1-\left(\frac{a}{r} \right)^{2}\right) ^{\frac{1}{2}}-\beta \right]^{-\frac{1}{3}}\cdot \label{partrad} \end{equation}](/articles/aa/full_html/2014/07/aa23648-14/aa23648-14-eq392.png) (A.8)Given the ratio a/r, the
current radius r of the sphere during deformation can be found (in
arbitrary units corresponding to unit volume of the sphere). The ratio a/r is
computed from the expression for the bulk density D, defined as the ratio
of the volume of the particle to the volume of the unit cell. This last value is
β1(r2 −
a2)3/2 (see Table 1). From the normalised grain volume 1 and the volume of the unit cell we
obtain
(A.8)Given the ratio a/r, the
current radius r of the sphere during deformation can be found (in
arbitrary units corresponding to unit volume of the sphere). The ratio a/r is
computed from the expression for the bulk density D, defined as the ratio
of the volume of the particle to the volume of the unit cell. This last value is
β1(r2 −
a2)3/2 (see Table 1). From the normalised grain volume 1 and the volume of the unit cell we
obtain 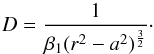 (A.9)Prior to compaction, i.e. for
a = 0,
the radius equals the initial radius (r = r0), hence
(A.9)Prior to compaction, i.e. for
a = 0,
the radius equals the initial radius (r = r0), hence
 (A.10)holds, thus,
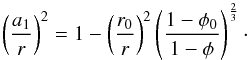
 ![Mathematical equation: \appendix \setcounter{section}{1} \begin{eqnarray} \frac{1-\phi_{0}}{1-\phi}&=&\frac{D_{0}}{D} =\left[ \frac{(r^{2}-a^{2})}{r_{0}^{2}} \right] ^{\frac{3}{2}} = \left[ \left( \frac{r}{r_{0}} \right) ^{2}-\left( \frac{a}{r_{0}} \right) ^{2} \right] ^{\frac{3}{2}} \nonumber \\[2mm] &=&\left( \frac{r}{r_{0}} \right) ^{3} \left[ 1-\left( \frac{a}{r} \right) ^{2} \right] ^{\frac{3}{2}}\cdot \label{forar} \end{eqnarray}](/articles/aa/full_html/2014/07/aa23648-14/aa23648-14-eq399.png) (A.11)This is solved for (a/r)2:
(A.11)This is solved for (a/r)2: 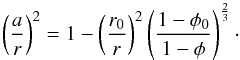 (A.12)For the computation of the effective
stress, we also need the area of the cross-section of the unit cell. In terms of the
geometries shown in Figs. A.2–A.4, the cross-section of a unit cell is the area of its projection
onto the horizontal plane. For SCP this is a square with the edge length 2y, for ORP a regular
hexagon with the edge length
(A.12)For the computation of the effective
stress, we also need the area of the cross-section of the unit cell. In terms of the
geometries shown in Figs. A.2–A.4, the cross-section of a unit cell is the area of its projection
onto the horizontal plane. For SCP this is a square with the edge length 2y, for ORP a regular
hexagon with the edge length  , for RHP a square with the edge length
2y, and
for BCCP an irregular octagon with four edges of the length
, for RHP a square with the edge length
2y, and
for BCCP an irregular octagon with four edges of the length
 , four edges of the length
 and the internal angle of
135 degrees. The areas of
those polygons can be written as γy2 (or as
and the internal angle of
135 degrees. The areas of
those polygons can be written as γy2 (or as
 for BCCP; see Table 1 for the values of γ).
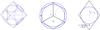 |
Fig. A.3 Unit cell of the RHP and its intersections with an inscribed grain (left panel), the top right view of the unit cell and of the grain at its initial and critical (final) stage of deformation (central panel), and a single face of the unit cell at the critical stage of the deformation (right panel). |
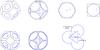 |
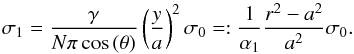
Fig. A.4 Unit cells and their intersections with an inscribed grain for the two deformation stages of the BCCP (top row, first and second panels); the faces of the unit cell at the second critical deformation stage (top row, third and fourth panels); topview of the unit cell before the first critical stage (bottom row, left panel) and after the first but before the second critical stage (bottom row, central panel); and the arrangement of the spheres at the first critical deformation stage as seen in the plane defined by the centres of the three spheres (bottom row, right panel). |
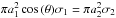
If a load m acts on a face then the stress on the face is
equal m/
(γy2). The total
stress on the sphere is Zm/
(γy2). In a
planetesimal, the applied stress is the lithostatic pressure σ0 and is
equal to the stress on the face:
 (A.13)From this the load acting on the
cross-section of the unit cell follows as m =
σ0γy2
and can be divided into two components. It is equal to the sum of the load acting on the
sphere through N non-vertical flat faces πa2cos(θ)σ1
lying above the equator of the unit cell and of the load acting on the void space
cσ2,
(A.13)From this the load acting on the
cross-section of the unit cell follows as m =
σ0γy2
and can be divided into two components. It is equal to the sum of the load acting on the
sphere through N non-vertical flat faces πa2cos(θ)σ1
lying above the equator of the unit cell and of the load acting on the void space
cσ2, 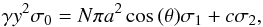 (A.14)where πa2 is the area of the
neck, θ is
the inclination angle of the faces, c is the cross-section of the porous part of the
unit cell, γ is a geometric constant which depends on the
packing (see Table 1), σ1 is the
stress acting along the z-axis through the neck, and σ2 = 0 is the
stress on the void space. The last equation is solved for σ1 to obtain
(A.14)where πa2 is the area of the
neck, θ is
the inclination angle of the faces, c is the cross-section of the porous part of the
unit cell, γ is a geometric constant which depends on the
packing (see Table 1), σ1 is the
stress acting along the z-axis through the neck, and σ2 = 0 is the
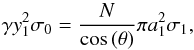
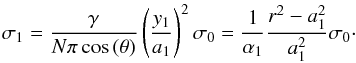
stress on the void space. The last equation is solved for σ1 to obtain
 (A.15)Above we have shown
 . From this we compute
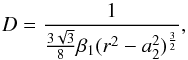
 ![Mathematical equation: \appendix \setcounter{section}{1} \begin{eqnarray} D&=&\frac{1}{\beta_{1}(r^{2}-a^{2})^{\frac{3}{2}}} \nonumber \\[2mm] &\Leftrightarrow& r^{2}-a^{2}=\frac{1}{D^{\frac{2}{3}}\beta_{1}^{\frac{2}{3}}}\nonumber \\[2mm] &\Leftrightarrow& \frac{1}{r^{2}-a^{2}}=\beta_{1}^{\frac{2}{3}}D^{\frac{2}{3}} \nonumber \\[2mm] &\Leftrightarrow& \frac{r^{2}}{r^{2}-a^{2}}=r^{2}\beta_{1}^{\frac{2}{3}}D^{\frac{2}{3}} \nonumber \\[2mm] &\Leftrightarrow& \frac{r^{2}-a^{2}+a^{2}}{r^{2}-a^{2}}=r^{2}\beta_{1}^{\frac{2}{3}}D^{\frac{2}{3}} \nonumber \\[2mm] &\Leftrightarrow& 1+\frac{a^{2}}{r^{2}-a^{2}}=r^{2}\beta_{1}^{\frac{2}{3}}D^{\frac{2}{3}} \nonumber \\[2mm] &\Leftrightarrow& \frac{a}{r^{2}-a^{2}}=D^{\frac{2}{3}}\beta_{1}^{\frac{2}{3}}r^{2}-1 . \label{ratio} \end{eqnarray}](/articles/aa/full_html/2014/07/aa23648-14/aa23648-14-eq425.png) (A.16)Thus,
(A.16)Thus,  (A.17)To obtain the particle volume in the second
deformation stage of the BCCP, one needs to subtract Z1 = 8 caps of
the volume
(A.17)To obtain the particle volume in the second
deformation stage of the BCCP, one needs to subtract Z1 = 8 caps of
the volume  and additionally Z2 = 6 caps of
the volume
and additionally Z2 = 6 caps of
the volume  :
:  (A.18)This defines the geometric constants
 ,
,  and
and
 for BCCP. Similarly to the other cases,
Eq. (A.18) implies
for BCCP. Similarly to the other cases,
Eq. (A.18) implies ![Mathematical equation: \appendix \setcounter{section}{1} \begin{equation} r=\left[ \sum_{i=1,2}\alpha_{0,i} \left( 2+\left( \frac{a_{i}}{r} \right)^{2} \right) \left( 1-\left(\frac{a_{i}}{r} \right) ^{2} \right) ^{\frac{1}{2}} -\beta \right] ^{-\frac{1}{3}}. \label{partrad2} \end{equation}](/articles/aa/full_html/2014/07/aa23648-14/aa23648-14-eq434.png) (A.19)The power (a1/r)2 is
computed analogously to Eq. (A.12):
(A.19)The power (a1/r)2 is
computed analogously to Eq. (A.12):
 (A.20)For (a2/r)2 we
consider the first critical stage c1 when the cap of the second kind
with the radius a2 starts to form and express the
relative density in the terms of y2,
(A.20)For (a2/r)2 we
consider the first critical stage c1 when the cap of the second kind
with the radius a2 starts to form and express the
relative density in the terms of y2,
Additional parameter values for the derivation of the effective stress.
 (A.21)because
 . Then
![Mathematical equation: \appendix \setcounter{section}{1} \begin{eqnarray} \frac{1-\phi_{\rm c_{1}}}{1-\phi}&=&\frac{D_{\rm c_{1}}}{D}=\frac{\frac{3\sqrt{3}}{8}\beta_{1}(r^{2}-a_{2}^{2})^{\frac{3}{2}}}{\frac{3\sqrt{3}}{8}\beta_{1}r_{\rm c_{1}}^{3}}=\frac{(r^{2}-a_{2}^{2})^{\frac{3}{2}}}{r_{\rm c_{1}}^{3}} \nonumber \\ &=&\left( \frac{r}{r_{\rm c_{1}}} \right)^{3} \left[ 1-\left( \frac{a_{2}}{r} \right)^{2} \right]^{\frac{3}{2}} \end{eqnarray}](/articles/aa/full_html/2014/07/aa23648-14/aa23648-14-eq463.png) (A.22)and
(A.22)and 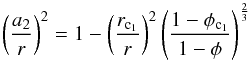 (A.23)follow. The relation between
a1 and a2 is obtained
from Eqs. (A.20) and (A.23) as
(A.23)follow. The relation between
a1 and a2 is obtained
from Eqs. (A.20) and (A.23) as
![Mathematical equation: \appendix \setcounter{section}{1} \begin{equation} a_{2}=\left[ \frac{ 1-\left( \frac{r_{\rm c_{1}}}{r} \right)^{2} \left( \frac{1-\phi_{\rm c_{1}}}{1-\phi} \right)^{\frac{2}{3}} }{ 1-\left( \frac{r_{0}}{r} \right)^{2}\left( \frac{1-\phi_{0}}{1-\phi} \right)^{\frac{2}{3}} } \right]^{\frac{1}{2}}a_{1}= c(\phi)a_{1}. \end{equation}](/articles/aa/full_html/2014/07/aa23648-14/aa23648-14-eq466.png) (A.24)The load on the octagonal cross-section of
the unit cell of the BCCP is
(A.24)The load on the octagonal cross-section of
the unit cell of the BCCP is 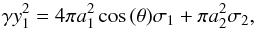 (A.25)where σ1 is the
effective stress on the faces of the first kind, σ2 on the
second kind, and
(A.25)where σ1 is the
effective stress on the faces of the first kind, σ2 on the
second kind, and  . Assuming equal load per face, we obtain
 and from this
 (A.26)where N = 5. Thus,
 (A.27)The geometric relations described above are
valid from the beginning of the deformation until the faces start to touch each other.
In the beginning, for the normalised grain volume 1 the initial grain radius r0 is equal to
(3/4π)1 /
3. The stage when the equations lose their validity corresponds
to a certain particle radius rc, the critical radius. This can be
computed as
(A.27)The geometric relations described above are
valid from the beginning of the deformation until the faces start to touch each other.
In the beginning, for the normalised grain volume 1 the initial grain radius r0 is equal to
(3/4π)1 /
3. The stage when the equations lose their validity corresponds
to a certain particle radius rc, the critical radius. This can be
computed as
follows. For the first four cases, the critical face radius a can be expressed in
terms of the critical particle radius as ac =
δrc with the constants
δ (equal
to  , 1/2, 1/2, and 1/2, respectively). Substituting this
into Eq. (A.8) we obtain
, 1/2, 1/2, and 1/2, respectively). Substituting this
into Eq. (A.8) we obtain ![Mathematical equation: \appendix \setcounter{section}{1} \begin{equation} r_{\rm c}=\left[ \alpha \left( 2+\delta^{2} \right) \left( 1-\delta^{2} \right)^{\frac{1}{2}}-\beta \right] ^{-\frac{1}{3}}. \label{radcrit} \vspace*{2mm} \end{equation}](/articles/aa/full_html/2014/07/aa23648-14/aa23648-14-eq479.png) (A.28)From Eq. (A.10) we obtain the relative initial densities D0 (see Table
1). The critical density Dc is obtained
by substituting rc and ac =
δrc into Eq. (A.9):
(A.28)From Eq. (A.10) we obtain the relative initial densities D0 (see Table
1). The critical density Dc is obtained
by substituting rc and ac =
δrc into Eq. (A.9):  (A.29)At the transition from the first to the
second deformation stage of the BCC packing, contact points between the particle and the
six rectangular faces of the unit cell form. Using δ1 = 1/2,
the particle radius at this moment of deformation rc1
and the first critical density Dc1 follow from Eqs. (A.8) and (A.9), or using δ1 = 0.5 and a2 = 0, from
Eqs. (A.19) and (A.21), respectively. At the end of the
second stage, all fourteen faces come in contact. Here, with
(A.29)At the transition from the first to the
second deformation stage of the BCC packing, contact points between the particle and the
six rectangular faces of the unit cell form. Using δ1 = 1/2,
the particle radius at this moment of deformation rc1
and the first critical density Dc1 follow from Eqs. (A.8) and (A.9), or using δ1 = 0.5 and a2 = 0, from
Eqs. (A.19) and (A.21), respectively. At the end of the
second stage, all fourteen faces come in contact. Here, with
 and δ2 = 1/3,
the second critical radius rc2 and the second
critical density Dc2 follow from Eqs.
(A.19) and (A.21).
and δ2 = 1/3,
the second critical radius rc2 and the second
critical density Dc2 follow from Eqs.
(A.19) and (A.21).
After the respective critical density is reached, the geometric approach to the
computation of the effective stress σ1 can no longer be applied (i.e. for
D ≥
Dc or
 ). In this case we use a continuous
linear relationship between
). In this case we use a continuous
linear relationship between  and
and
 .
.
Acknowledgments
We thank the reviewer Satoshi Okuzumi for his constructive and helpful suggestions and comments on the paper. This work was supported by the Deutsche Forschungsgemeinschaft (DFG) Priority Programme 1385 “The First 10 Million Years of the Solar System – a Planetary Materials Approach” and by the Helmholtz Association through the research alliance “Planetary Evolution and Life”.
References
- Akridge, G., Benoit, P. H., & Sears, D. W. G. 1997, Lunar and Planetary Science Conf., XXVIII, 1178 [Google Scholar]
- Akridge, G., Benoit, P. H., & Sears, D. W. G. 1998, Icarus, 132, 185 [NASA ADS] [CrossRef] [Google Scholar]
- Beitz, E., Guettler, C., Nakamura, A. M., Tsuchiyama, A., & Blum, J. 2013, Icarus, 225, 558 [NASA ADS] [CrossRef] [Google Scholar]
- Bystricky, M., Lawlis, J., Mackwell, S. J., Heidelbach, F., & Raterron, P. C. 2011, in American Geophysical Union, Fall Meeting 2011, T13A-2366 [Google Scholar]
- Castillo-Rogez, J. C. 2011, Icarus, 215, 599 [NASA ADS] [CrossRef] [Google Scholar]
- Coogan, A. H., & Manus, R. W. 1975, Compaction of Coarse-Grained Sediments, I, eds. G. V. Chilingarian, & K. H. Wolf (Elsevier Scientific Publishing Company), 78 [Google Scholar]
- Dullien, F. A. L. 1992, Porous Media. Fluid Transport and Pore Structure, 2nd edn. (Academic Press) [Google Scholar]
- Durham, W. B., Stern, L. A., & Kirby, S. H. 2001, J. Geophys. Res., 106, 11031 [NASA ADS] [CrossRef] [Google Scholar]
- Elkins-Tanton, L. T., Weiss, B. P., & Zuber, M. T. 2011, Earth and Planetary Science Letters, 305, 1 [Google Scholar]
- Farnsworth, P. L., & Coble, R. L. 1966, J. Amer. Ceramic Soc., 49, 264 [CrossRef] [Google Scholar]
- Fowler, A. C. 1985, Geophys. Astrophys. Fluid Dyn., 33, 63 [NASA ADS] [CrossRef] [Google Scholar]
- Fu, R. R., & Elkins-Tanton, L. T. 2014, Earth Planet. Sci. Lett., 390, 128 [NASA ADS] [CrossRef] [Google Scholar]
- Goldsby, D. L., & Kohlstedt, D. L. 2001, J. Geophys. Res., 106, 11017 [Google Scholar]
- Guettler, C., Krause, M., Geretshauser, R., Speith, R., & Blum, J. 2009, ApJ, 701, 130 [NASA ADS] [CrossRef] [Google Scholar]
- Gupta, G., & Sahijpal, S. 2010, J. Geophys. Res., 115, E08001 [NASA ADS] [Google Scholar]
- Henke, S., Gail, H.-P., Trieloff, M., Schwarz, W. H., & Kleine, T. 2012, A&A, 537, A45 [NASA ADS] [CrossRef] [EDP Sciences] [Google Scholar]
- Hevey, P., & Sanders, I. 2006, Meteoritics, 41, 95 [Google Scholar]
- Hilairet, N., Reynard, B., Wang, Y., et al. 2007, Science, 318, 1910 [NASA ADS] [CrossRef] [Google Scholar]
- Hutchison, R. 2004, Meteorites: A petrologic, chemical and isotopic synthesis (Cambridge University Press) [Google Scholar]
- Jin, Z. M., Green, H. W., I. & Zhou, Y. 1994, Nature, 372, 164 [NASA ADS] [CrossRef] [Google Scholar]
- Kakar, A. K., & Chaklader, A. C. D. 1967, J. Appl. Phys., 38, 3223 [NASA ADS] [CrossRef] [Google Scholar]
- Karato, S.-I. 2013, Physics and Chemistry of the Deep Earth (Wiley) [Google Scholar]
- Kataoka, A., Tanaka, H., Okuzumi, S., & Wada, K. 2013a, A&A, 557, L4 [NASA ADS] [CrossRef] [EDP Sciences] [Google Scholar]
- Kataoka, A., Tanaka, H., Okuzumi, S., & Wada, K. 2013b, A&A, 554, A4 [NASA ADS] [CrossRef] [EDP Sciences] [Google Scholar]
- Kohlstedt, D. 2002, Plastic Deformation of Minerals and Rocks, eds. S. Karato, & H.-R. Wenk (Washington: Mineralogical Society of America), 121 [Google Scholar]
- Krause, M., Henke, S., Gail, H.-P., et al. 2011, Lunar and Planeteary Science Conf. Letters, 42, 2696 [Google Scholar]
- Moskovitz, N., & Gaidos, E. 2011, Meteoritics, 46, 903 [NASA ADS] [CrossRef] [Google Scholar]
- Neumann, W., Breuer, D., & Spohn, T. 2012, A&A, 543, A141 [NASA ADS] [CrossRef] [EDP Sciences] [Google Scholar]
- Neumann, W., Breuer, D., & Spohn, T. 2013, Icarus, 224, 126 [NASA ADS] [CrossRef] [Google Scholar]
- Nimmo, F., Pappalardo, R. T., & Giese, B. 2003, Icarus, 166, 21 [NASA ADS] [CrossRef] [Google Scholar]
- Ormel, C. W., Spaans, M., & Tielens, A. G. G. M. 2007, A&A, 461, 215 [NASA ADS] [CrossRef] [EDP Sciences] [Google Scholar]
- Rao, A. S., & Chaklader, A. C. D. 1972, J. Amer. Ceramic Soc., 55, 596 [Google Scholar]
- Rietmeijer, F. J. M. 1993, Earth Planet. Sci. Lett., 117, 609 [NASA ADS] [CrossRef] [Google Scholar]
- Sahijpal, S., Soni, P., & Gupta, G. 2007, Meteoritics, 42, 1529 [NASA ADS] [CrossRef] [Google Scholar]
- Schwenn, M. B., & Goetze, C. 1978, Tectonophysics, 48, 41 [NASA ADS] [CrossRef] [Google Scholar]
- Senshu, H. 2006, Frontier Research on Earth Evolution, 2, 5 [Google Scholar]
- Solano, J. M., Kiefer, W. S., & Mittlefehldt, D. W. 2012, in Lunar and Planetary Science, XLIII, 2063 [Google Scholar]
- Suyama, T., Wada, K., & Tanaka, H. 2008, ApJ, 684, 1310 [NASA ADS] [CrossRef] [Google Scholar]
- Weisberg, M. K., McCoy, T. J., & Krot, A. N. 2006, Systematics and Evaluation of Meteorite Classification. In: Meteorites and the Early Solar System II, 19, eds. D. S. Lauretta, & H. Y. McSwen (Tucson: University of Arizona Press) [Google Scholar]
- Wieczorek, M. A., Neumann, G. A., Nimmo, F., et al. 2013, Science, 339, 671 [NASA ADS] [CrossRef] [Google Scholar]
- Wilkinson, S. L., McCoy, T. J., McCamant, J. E., Robinson, M. S., & Britt, D. T. 2003, Meteoritics, 38, 1533 [Google Scholar]
- Yomogida, K., & Matsui, T. 1984, Earth Planet. Sci. Lett., 68, 34 [NASA ADS] [CrossRef] [Google Scholar]
- Zsom, A., Ormel, C. W., Güttler, C., Blum, J., & Dullemond, C. P. 2010, A&A, 513, A57 [NASA ADS] [CrossRef] [EDP Sciences] [Google Scholar]
- Zsom, A., Ormel, C. W., Dullemond, C. P., & Henning, T. 2011, A&A, 534, A73 [NASA ADS] [CrossRef] [EDP Sciences] [Google Scholar]
All Tables
Initial porosity φ0, initial thermal conductivity
k0, average final porosity
, initial planetesimal radius
R0, final planetesimal radius
Rf, thickness of the porous layer
Dp, central maximum temperature
Tmax, and central pressure
Pc at
.
All Figures
|
Fig. 1 Relative stress σ1/σ0 for the adopted four basic systems of packing plotted against the relative density D = 1 − φ (after Rao & Chaklader 1972, their Fig. 6). The lines are truncated at the respective critical density Dc (see Table 1), above which the effective stress is computed using a linear relationship between the value at Dc and the lithostatic pressure. |
| In the text | |
|
Fig. 2 Porosity after the cooling of the body below 300 K as a function of depth.
Left panel: |
| In the text | |
|
Fig. 3 Central temperature (solid line) and central porosity (dashed line) as functions of time for the case Screep with RHP. |
| In the text | |
|
Fig. 4 Porosity as a function of depth for |
| In the text | |
|
Fig. 5 Porosity as a function of depth for |
| In the text | |
|
Fig. 6 The central temperature (solid lines) and the central porosity (dashed lines) as
functions of time. Left panel: case
|
| In the text | |
|
Fig. A.1 General deformation geometry at any contact point between two grains. |
| In the text | |
|
Fig. A.2 Unit cells and their intersections with an inscribed grain for the SCP and the ORP (top row from left to right) along with the top views of the unit cells and of the grain at its initial and critical (final) stages of deformation (bottom row). |
| In the text | |
|
Fig. A.3 Unit cell of the RHP and its intersections with an inscribed grain (left panel), the top right view of the unit cell and of the grain at its initial and critical (final) stage of deformation (central panel), and a single face of the unit cell at the critical stage of the deformation (right panel). |
| In the text | |
|
Fig. A.4 Unit cells and their intersections with an inscribed grain for the two deformation stages of the BCCP (top row, first and second panels); the faces of the unit cell at the second critical deformation stage (top row, third and fourth panels); topview of the unit cell before the first critical stage (bottom row, left panel) and after the first but before the second critical stage (bottom row, central panel); and the arrangement of the spheres at the first critical deformation stage as seen in the plane defined by the centres of the three spheres (bottom row, right panel). |
| In the text | |
Current usage metrics show cumulative count of Article Views (full-text article views including HTML views, PDF and ePub downloads, according to the available data) and Abstracts Views on Vision4Press platform.
Data correspond to usage on the plateform after 2015. The current usage metrics is available 48-96 hours after online publication and is updated daily on week days.
Initial download of the metrics may take a while.