Fig. 5
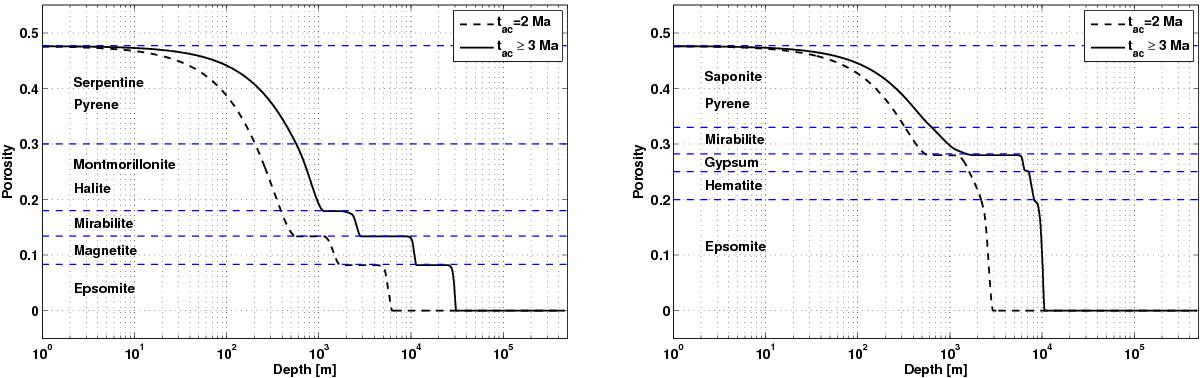
Black lines show the porosity versus depth (taken at 4.5 Ga after CAIs) for varying accretion durations. Blue lines indicate the porosity intervals in which single mineral phases compact. For the accretion durations considered here, the porosity is reduced to zero except in an outer shell with a thickness lower than 30 km (CIa, left panel) or lower than 10 km (CIb, right panel). The loss of porosity is mainly due to the heating by the long-lived nuclides. A slightly more efficient compaction is possible for tac = 2 Ma after the CAIs. For all other cases with a longer accretion duration of 3−50 Ma, the porous layer is thicker. However, the porosity profiles in the latter cases are almost identical. In all runs for both CIa and CIb, an average porosity of φ(t) < 2.5% is reached in the present-day Ceres. The curve shapes result from a stepwise increase of the creep activation energy E according to the volume fractions and the activation energies of single minerals.
Current usage metrics show cumulative count of Article Views (full-text article views including HTML views, PDF and ePub downloads, according to the available data) and Abstracts Views on Vision4Press platform.
Data correspond to usage on the plateform after 2015. The current usage metrics is available 48-96 hours after online publication and is updated daily on week days.
Initial download of the metrics may take a while.