| Issue |
A&A
Volume 583, November 2015
|
|
|---|---|---|
| Article Number | A132 | |
| Number of page(s) | 11 | |
| Section | Interstellar and circumstellar matter | |
| DOI | https://doi.org/10.1051/0004-6361/201526696 | |
| Published online | 05 November 2015 | |
The little-studied cluster Berkeley 90
II. The foreground ISM
1 Centro de Astrobiología, CSIC-INTA, campus ESAC, apartado postal 78, 28 691 Villanueva de la Cañada, Madrid, Spain
e-mail: This email address is being protected from spambots. You need JavaScript enabled to view it.
2 Departamento de Física y Astronomía, Universidad de La Serena, Av. Cisternas 1200 Norte, La Serena, Chile
3 Instituto de Astrofísica de Andalucía-CSIC, Glorieta de la Astronomía s/n, 18 008 Granada, Spain
4 Instituto de Astrofísica de Canarias, 38 200 La Laguna, Tenerife, Spain
5 Departamento de Astrofísica, Universidad de La Laguna, 38 205 La Laguna, Tenerife, Spain
Received: 8 June 2015
Accepted: 21 September 2015
Abstract
Context. Nearly one century after their discovery, the carrier or carriers of diffuse interstellar bands (DIBs) is/are still unknown and there are few sightlines studied in detail for a large number of DIBs.
Aims. We want to study the ISM sightlines toward LS III +46 11 and LS III +46 12, two early-O-type stellar systems, and LS III +46 11 B, a mid-B-type star. The three targets are located in the stellar cluster Berkeley 90 and have a high extinction.
Methods. We used the multiepoch high-S/N optical spectra presented in Paper I, the extinction results derived there, and additional spectra.
Results. We measured equivalent widths, velocities, and FWHMs for a large number of absorption lines in the rich ISM spectrum in front of Berkeley 90. The absorbing ISM has at least two clouds at different velocities, one with a lower column density (thinner) in the K i lines located away from Berkeley 90 and another with a higher column density (thicker) associated with the cluster. The first cloud has similar properties for both O-star sightlines, but the second is thicker for LS III +46 11. The comparison between species indicate that the cloud with a higher column density has a denser core, allowing us to classify the DIBs in a σ−ζ scale, some of these for the first time. The LS III +46 12 sightline also has a high-velocity redshifted component.
Key words: dust, extinction / ISM: lines and bands / open clusters and associations: individual: Berkeley 90 / stars: early-type / stars: individual: LS III +46 11 / stars: individual: LS III +46 12
© ESO, 2015
1. Introduction
Diffuse interstellar bands (DIBs) were discovered nearly a century ago (Heger 1922; Merrill 1934). Many DIBs are known, with FWHMs that range from under 1 Å to several tens of Å. The DIBs are correlated with the amount of extinction but not perfectly correlated. To date, the carrier or carriers that produce DIBs have not been identified with certainty. Different options have been proposed, most of them carbon-based substances (Herbig 1995; Ehrenfreund et al. 1995; Thorburn et al. 2003; Kaźmierczak et al. 2010; Maier et al. 2011; Salama et al. 2011; Steglich et al. 2011).
Broadly speaking, DIB observational studies can be classified in two categories. The studies in the first category select one or a small number of DIBs and measure them for a large sample of stars. The pioneering study was Duke (1951) and in recent years this type of investigation has become popular (Thorburn et al. 2003; Munari et al. 2008; Friedman et al. 2011; Vos et al. 2011; Raimond et al. 2012; Puspitarini et al. 2013; van Loon et al. 2013). The second category corresponds to studies that select one or a small number of stars and study their DIBs in depth throughout a large wavelength range (Jenniskens & Desert 1994; Galazutdinov et al. 2000; Tuairisg et al. 2000; Cox et al. 2005; Hobbs et al. 2008, 2009). The work presented here is of the second category, although it is part of a larger project that plans to study the interstellar medium (ISM) using thousands of high-quality spectra of OB stars (Penadés Ordaz et al. 2013; Maíz Apellániz et al. 2014b).
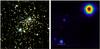 |
Fig. 1 Left: 2MASS KSHJ three-color RGB mosaic of Berkeley 90. The intensity level in each channel is logarithmic. Right: false-color AstraLux |

LS III +46 11, LS III +46 12, and LS III +46 11 B summary.
The sparse young open cluster Berkeley 90 is almost unstudied. In Maíz Apellániz et al. (2015b), from now on Paper I, we analyzed it with an emphasis on LS III +46 11, a very massive early-type binary composed of two of the four O stars earlier than O4 known in the northern hemisphere. Paper I also studied LS III +46 12, the other early-O-type system with a significant contribution to the ionizing flux of the cluster, and other properties of Berkeley 90. The cluster is immersed in an H ii region, Sh 2-115. In Table 1 we summarize some of the properties of the two dominant systems in the cluster and of a third star, which is also studied here. The two dominant stars experience a similar extinction law, as evidenced by the measured R5495 values (Maíz Apellániz 2013a; Maíz Apellániz et al. 2014a), but LS III +46 11 has an extinction that is higher by ≈30%. In this paper, we study the signature of the foreground ISM in the optical spectra of both stars. We also include a third system, LS III +46 11 B, which is spatially resolved from LS III +46 11 (Fig. 1), and whose photometry was presented in Paper I, for which we have also obtained spectra.
2. Data
Most of the spectra used here are a selection of those used in Paper I. We only summarize the most relevant information here; see Paper I for details. The spectra were obtained under four different projects (GOSSS, Maíz Apellániz et al. 2011; NoMaDS, Maíz Apellániz et al. 2012; Pellerin et al. 2012; IACOB, Simón-Díaz et al. 2011, 2015; and CAFÉ-BEANS, Negueruela et al. 2015) at resolving powers ranging from 2800 to 65 000 and covering different ranges from 3811 Å to 9225 Å.
In addition to the spectra from Paper I, we have obtained long-slit spectroscopy on 29 April 2015 with the OSIRIS instrument at the 10.4 m Gran Telescopio Canarias (GTC), as part of an extension of GOSSS to larger-aperture telescopes to include fainter O stars. Two gratings were used, R2500U (3440−4610 Å, texp of 1800 s) and R2500V (4445−6060 Å, texp of 300 s), with a resolving power R between 2500 and 3000. As in the rest of the GOSSS data, the long slit was placed to include both LS III +46 11 and LS III +46 12. The larger aperture of GTC allowed us to extract the spectra of a third star, LS III +46 11 B (2MASS J20351402+4650549; see Paper I and Fig. 1), which was present in the long-slit exposures.
The number of epochs, signal-to-noise ratio (S/N), and wavelength coverage at each resolution for each star varies, and hence there are differences in the ISM lines that can be studied for each star. In particular, the blue-violet range was significantly less covered for LS III +46 12 than for LS III +46 11 and the number of lines that could be measured for LS III +46 11 B was relatively small. The telluric lines in the high-resolution spectra were eliminated according to the procedure of Gardini et al. (2013).
The results in this paper can be divided into two types. We first conduct a brief analysis of the spectra and photometry of LS III +46 11 B to derive its properties and place it in the context of Berkeley 90. We then study the ISM in front of the three targets, which is the core of this paper.
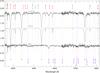 |
Fig. 2 Top: GTC combined spectrum of LS III +46 11 B. Middle: best TLUSTY fit for LS III +46 11 B. Bottom: residual obtained by dividing the top spectrum by the middle fit. |
For the ISM we have measured as many as seven atomic and seven molecular lines and 50 DIBs. We give the equivalent widths (EWs), full-widths at half maximum (FWHMs), and central velocities (v) for LS III +46 11 and LS III +46 12 obtained with the WHT and the high-resolution spectroscopy in Table 2. Before analyzing the results, we detail some aspects of the extraction:
ISM lines measured for LS III +46 11 (S1) and LS III +46 12 (S2) in the WHT and high-resolution spectra.
-
Our spectra are diverse in terms of wavelength coverage, S/N, andspectral resolution. Therefore, each absorption line wasextracted spectrum by spectrum and the results were combined aposteriori using the best available data in each case.
-
In cases where spectra of similar resolutions but different S/N values were available, we only used those where the S/N was adequate.
-
For narrow lines, high-resolution spectroscopy is preferred over intermediate-resolution data. For broad DIBs, however, the situation is reversed as measurement errors are dominated by normalization, which is easier to carry out in long-slit spectra than in echelle data. For the intermediate-resolution case, we only used the WHT spectra as a result of their slightly higher spectral resolution compared to the CAHA-3.5 m data.
-
In most cases, fitting with a single Gaussian yields better results than numerical integration; the former are given in Table 2. However, some lines are asymmetric because of their intrinsic profiles (Galazutdinov et al. 2008) or the existence of two or three kinematic components (see below). For those lines, we give the numerical integration results in Table 2.
-
No attempt was made to fit broad DIBs with Lorentzian profiles instead of Gaussians (Snow et al. 2002; van Loon et al. 2013) because of the rectification difficulties that exist for the wings. However, differences in the results are small (Maíz Apellániz et al. 2014b).
-
For the DIB groups at 4761.12+4762.36+4779.69 Å and 4879.83+4887.43 Å (Maíz Apellániz et al. 2014b), the lines were fitted simultaneously. For the DIB at 6203.05 Å, however, only the inner narrow DIB was fit (but not the broad one) and a single Gaussian was also used for the 6177.30 Å DIB, despite its obvious asymmetry due to the complexity of the spectral region1.
-
The reference values and sources for the rest wavelength (λ0) of each line are listed in Table 2. For the DIBs with Gaussian fits we first attempted fixing the FWHM using the reference value from the source. If that first attempt was successful, it is listed in the table as a single value. If we thought that the FWHM could be improved, we made a second attempt leaving it as a free parameter for each fit. Those cases are listed with a measurement and an uncertainty in Table 2 and those with the most significant changes also appear in Table 3.
-
We only measured those lines where additional information could be added to that in Table 2.
-
For LS III +46 11 B, we extracted the absorption lines after subtracting a model TLUSTY SED (see below). This allowed us to measure Ca iiλ3968.468 for that sightline (but not for the other two).
-
The three CN lines at 3873.999+74.607+75.760 could not be individually resolved and, therefore, we give the total EW.
-
For CH+ λ3957.692 and Ca iλ4226.7275, we would not obtain an EW for LS III +46 11 B due to the poor S/N.
-
A single measurement flag (Mf) is used to indicate either a Gaussian fit (F) or numerical integration (I) was used to obtain the EW.
-
In most cases, the uncertainties for LS III +46 11 and LS III +46 12 are larger than in Table 2 despite the larger aperture of GTC compared to the other telescopes. This is caused by the lower spectral resolution, fewer epochs, and shorter exposure times.
DIBs for which the measured values of λ0 and/or FWHM are significantly different for LS III +46 11 and LS III +46 12 when compared with the reference values.
EWs measured for LS III +46 11 (S1), LS III +46 11 B (S1B), and LS III +46 12 (S2) in the GTC spectra.
3. LS III +46 11 B
The blue-violet section of the GTC combined spectrum of LS III +46 11 B is shown at the top of Fig. 2. The jump in S/N at 4590 Å is caused by the use of two gratings, R2500U and R2500V, to the left and right, respectively, with different exposure times.
As in Paper I for LS III +46 11 and LS III +46 12, we used MGB (Maíz Apellániz et al. 2012) to derive the stellar properties of LS III +46 11 B. We built a classification grid based not on observed spectra but on the TLUSTY grids of Lanz & Hubeny (2003, 2007) using their SYNSPEC output. The grid uses Teff (15 000−55 000 K) as a horizontal coordinate and log g (1.75−4.75 cgs) as vertical coordinate and, as before, MGB allows for the variation of the rotation speed vsini.
MGB yields a good fit to the observed spectrum with Teff = 16 000 ± 1000 K, log g = 4.00 ± 0.25 cgs, and vsini = 175 ± 25 km s-1. LS III +46 11 B appears to be a normal main-sequence mid-B star2 with a moderately high rotation speed. The value of log g is slightly lower than the expected value for a ~4.5 M⊙ star of the young age of Berkeley 90, but the discrepancy is of only 1 sigma. The estimated uncertainties are obtained by eye comparing different models in the grid, i.e., they are not formal uncertainties derived by, e.g., χ2 fitting. The best TLUSTY fit is shown in the middle of Fig. 2 and the residual of the fit is shown at the bottom. The residual yields the ISM spectrum used to measure the EWs of its absorption lines. In particular, we find the residual has subtracted Hε correctly, leaving the narrow ISM Ca iiλ3968.468 line clearly visible.
We have also performed a CHORIZOS (Maíz Apellániz 2004) analysis of LS III +46 11 B, similar to those in Paper I for the O stars, but with some differences:
-
As input photometry, we used 2MASS (JHKS, Skrutskie et al. 2006) and IPHAS (ri, Barentsen et al. 2014), as there is no other high quality optical data available. As it happened for LS III +46 11 with KS, there is no good detection of LS III +46 11 B in the 2MASS J photometry. We downloaded the image from the archive and we performed a differential photometry analysis similar to our analysis for LS III +46 11 in Paper I, which yielded a J magnitude of 12.552 ± 0.050 for LS III +46 11 B.
We used the same Milky Way grid (Maíz Apellániz 2013b) and extinction laws (Maíz Apellániz 2013a; Maíz Apellániz et al. 2014a) as in Paper I.
For the baseline CHORIZOS run we fixed Teff to 16 000 K (see above), the photometric luminosity class (LC) to 5.5 (ZAMS, since the star is expected to be ~2 Ma, which is young for the lifetime of a mid-B star in the main sequence), and the extinction type (R5495) to 3.34 (an average of the two very similar values measured in Paper I for LS III +46 11 and LS III +46 12). The amount of extinction [E(4405−5495)] and logarithmic distance (log d) were left as free parameters.
We performed two additional runs, one changing LC to 5.0 (average main sequence) and another changing Teff to 17 000 K to quantify the effect of the parameter uncertainty in the output.
-
The three runs give similar results for
 and E(4405−5495) and only differ significantly in log d. This happens because the optical+NIR colors to the right of the Balmer jump for early/mid B stars are nearly independent of luminosity and only weakly dependent on Teff.
 -
The values of
indicate that the fit is very good in all cases (because, as stated in the previous item, they are all expected to be similar). This is in principle a sign of the validity of the extinction laws and the R5495 value, but it is only a weak sign as the SED is not probed for λ< 6000 Å. -
The LS III +46 11 B amount of extinction is intermediate between those of LS III +46 11 and LS III +46 12, but significantly closer to that of LS III +46 11 (which is a shorter distance away in the plane of sky).
-
If LS III +46 11 B is close to the ZAMS, log d must be close to 3.20. Allowing for an older age places the system slightly farther away but not as far as the preferred value of 3.40−3.45 derived in Paper I, which required that LS III +46 12 is a hidden binary. A log d close to 3.20 poses no problem for a single LS III +46 12, but it implies that if all the stars are at the same distance, the two spectroscopic components of LS III +46 11 would have similar visual luminosities as LS III +46 12, which contradicts their supergiant spectroscopic classification. An alternative, already hinted at in Paper I, would imply that He iiλ4685.71 for the earliest O stars is a measurement of wind strength but not of luminosity.
Results of the CHORIZOS fits for LS III +46 11 B.
4. ISM results
We analyze the ISM lines in three steps. We first concentrate on the velocities in Table 2 and the EWs in Tables 2 and 4:
-
All the EWs with values in both Tables 2 and 4 are consistent within the errors, so from now on we refer only to the most precise value of the two in each case.
All the atomic and molecular lines for LS III +46 11 have velocities between −20.6 and −13.8 km s-1. CH+ λ4232.548, CH λ4300.313, and K iλ7664.911+7698.974 for LS III +46 12 also have similar velocities. However, the Ca iiλ3933.663 and Na iλ5889.951+5895.924 velocities for that star are significantly larger, especially in the first case. The cause is explained below.
The two R(0) lines of CH+ are easily detected in the NoMaDS spectra of LS III +46 11 but the R(1) and Q(1) lines are not, possibly due to an insufficient S/N (Oka et al. 2013).
The majority of the DIBs for both stars have velocities close to those of the atomic and molecular lines, indicating that the DIBs originate at the same clouds (from one point of view) or that we have a good knowledge of their central wavelengths (from another point of view). The most clear exceptions are listed in Table 3, where we computed the new values of λ0 assuming that the DIBs originated at the same velocity as the atomic and molecular lines. The majority of the changes listed there correspond to values measured by Maíz Apellániz et al. (2014b), who used only intermediate-resolution spectroscopy, which biases FWHM toward larger values, and combined profiles from different stars, which can also broaden the FWHM as well as introduce biases in λ0. Among those cases, we find the well-known DIB with λ ≈ 4428 Å, which is very strong but broad and contaminated by weak stellar lines: the value found here is ≈0.5 Å toward the blue compared with that in Maíz Apellániz et al. (2014b). The 8621 Å DIB was not included on the Hobbs et al. (2008) or Maíz Apellániz et al. (2014b) lists so the reference values listed in Tables 2 and 3 are from Jenniskens & Desert (1994). This DIB has received recent attention due to its inclusion in large-scale surveys such as RAVE and Gaia, so it is important to know its intrinsic characteristics with accuracy. Our values for λ0 and FWHM are significantly different from the reference values, but more recent studies (e.g., Munari et al. 2008; Hobbs et al. 2009; Kos et al. 2013) have also pointed toward changes in the same direction (lower central wavelengths and broader profiles).
-
The EWs for the LS III +46 11 B lines have, in general, relatively large errors. However, they are all consistent in that they have the same values as those for LS III +46 11, pointing toward similar properties for both sightlines (as also indicated by the similar extinction values).
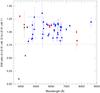
Fig. 3 Equivalent-width ratios between LS III +46 12 and LS III +46 11 for the cases in Table 2 where measurements for both stars could be obtained. Red is used for atomic lines, green for molecular lines, and blue for DIBs. All points show the EW uncorrected for saturation (which should be a good approximation in all cases except for the intense atomic lines) except for K iλ7664.911+7698.974. In that case, besides the uncorrected values, we show the corrected value (as an unfilled symbol) calculated using the kinematic decomposition described in the text. The x value in each case is λ0, the length of the horizontal error bars is proportional (with a threshold for the narrowest ones) to the FWHM of the line, and the vertical error bars show the uncertainty in the measurement. The two dotted lines are the ratios for E(4405−5495) and AV.
-
The EW ratios between LS III +46 12 and LS III +46 11 are plotted in Fig. 3, along with the corresponding ratios for the dust measurements, 0.76 and 0.78 for E(4405−5495) and AV, respectively (as previously noted, the two stars show similar values of R5495, hence, the similar values for the two ratios).
The behavior for the EW ratios of the molecular lines in Fig. 3 is very different. CH+ λ4232.548 has a value of 1.09, clearly above the values for dust and similar to the values for the DIBs (see below). On the other hand, the value for CH λ4300.313, 0.55, is clearly below the dust values and that for CN λ3873.999+74.607+75.760, 0.10, is much lower.
Based on the previous points, if we model the ISM toward Berkeley 90 as a common cloud (cloud σ) that affects LS III +46 11 and LS III +46 12 similarly, and a second cloud (cloud ζ) that affects LS III +46 11 almost exclusively3, cloud ζ would have little or no CH+ but a significant amount of dust, an even larger (in relative terms) amount of CH, and more CN by an order of magnitude4. Given that CH traces gas denser than CH+ (Smoker et al. 2014), cloud ζ should be denser than cloud σ.
A similar comparison for atomic EW ratios is less straightforward because of saturation effects associated with the larger optical depths. The ratio for K iλ7698.974, which is optically thinner than the Na i and Ca ii lines, is 0.85, which is relatively close to the dust ratios. See below for a more detailed analysis taking kinematics and saturation into account.
There is a significant scatter in the vertical axis of Fig. 3 for the DIBs, as expected, since the correlations between DIBs and extinction are good but not perfect. However, what is more surprising is that for all cases the EW ratio is higher than for E(4405−5495) or AV. If we follow the two-cloud hypothesis previously described, this would mean that cloud ζ is depleted in DIBs with respect to cloud σ.
Within the scatter shown in Fig. 3, ζ-type DIBs (e.g., DIB λ5797.06 and DIB λ5849.81, Krelowski et al. 1997) have values of ≈1.0 or below while σ-type DIBs (e.g., DIB λ5780.48) have values of ≈1.1 or above. This is another indication that cloud ζ should be interpreted as being denser than cloud σ.
-
McCall et al. (2010) discovered that the 6195.98 Å and 6613.62 Å DIBs are nearly perfectly correlated. LS III +46 11 and LS III +46 12 are more extinguished than the majority of stars in their sample but the strong correlation still appears to hold. The EW ratios for those two lines in Fig. 3 are 1.037±0.020 and 1.012±0.014, i.e., one sigma away from each other, and the ratios of one line to another are 4.1−4.2, very close to the 3.96 value determined by McCall et al. (2010). However, a nearly perfect correlation does not necessarily imply a same carrier (Oka et al. 2013).
Table 6Logarithm of the measured ISM column densities (in cm-2).
-
There are two clear kinematic components in K iλ7664.911+7698.974 for LS III +46 11 and LS III +46 12 in the CAFÉ-BEANS data. A stronger component is at −19.34±0.01 km s-1 for LS III +46 11 (−20.96±0.02 km s-1 for LS III +46 12), and a weaker component is at −8.00 ± 0.02 for LS III +46 11 (−6.43 ± 0.04 km s-1 for LS III +46 12). The larger velocity difference between components for LS III +46 12 manifests itself in the height of the central peak in the top two spectra of Fig. 5.
-
The strong component has a velocity consistent with that of LS III +46 11 measured in Paper I and is relatively close to that of LS III +46 12. The weak component, on the other hand, has a velocity intermediate between those of the stars and that of the Sun. We adopt as our model that the strong component originates in a cloud associated with Berkeley 90 and that the weak one originates in a cloud in the path between the cluster and the Sun. In terms of the σ and ζ clouds defined before, the strong component would contribute to both clouds σ and ζ, while the weak component would contribute only to σ. Or, putting it in another way, the ISM common to both sightlines could be described by a cloud σ1 far away from the cluster (the weak kinematic component) and a cloud σ2 associated with the cluster (part of the strong kinematic component). In addition, the LS III +46 11 sightline would have another (denser) cloud ζ associated with the cluster (i.e., with the same velocity as σ2). In the most simplified version of the model, σ1 and σ2 would produce the same effect in the spectra of LS III +46 11 and LS III +46 12, but we know that this cannot be completely true, as some absorption lines have values above 1.0 in Table 3. This can be explained by the fact that σ2 is longer along the LS III +46 12 sightline than along the LS III +46 11 sightline. Figure 4 represents this description.
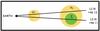
Fig. 4 Model for the ISM clouds present in the LS III +46 11 and LS III +46 12 sightlines. Cloud σ1 is of low density, not associated with the cluster, and affects both sightlines similarly. Cloud σ2 is also of low density, is the skin of the cloud associated with the cluster, and is longer along the LS III +46 12 sightline. Cloud ζ is of high density, is the core of the cloud associated with the cluster, and affects LS III +46 11 exclusively (or, at least, to a much larger degree than LS III +46 12).
-
Na iλ5889.951+5895.924 is saturated for both stars but the profiles are consistent with the existence of the two same kinematic components as for K i.
-
Ca iiλ3933.663+3968.468 for LS III +46 11 is also close to saturation and the only spectra with good S/N are from NoMaDS, hence, the resolution is lower than for K i or Na i. Also, for LS III +46 12 the high-resolution spectra have low S/N in the 4000 Å region, so we only have GOSSS data there; and, the data is only for Ca iiλ3933.663, since it is not possible to separate Ca iiλ3968.468 from Hε at the GOSSS lower resolution. In any case, the available data are consistent with the existence of the two kinematic components detected in the K i lines.
-
The existence of two kinematic components can also be seen in the asymmetric profile of CH+ λ4232.548 and CH λ4300.313 in LS III +46 11.
-
We do not detect two kinematic components in CN λ3873.999+3874.607+3875.760, CH λ3886.410, CH+ λ3957.692, or Ca iλ4226.7275, which is very possibly due to an insufficient S/N. However, their measured velocities in Table 2 indicate that they originate mostly in the strong K i kinematic component.
-
In addition, there is a third high-velocity redshifted component detectable only for LS III +46 12 in Na iλ5889.951+5895.924 and Ca iiλ3968.468. The component is weak in Na i, but the high-resolution data allows us to measure a precise velocity of +196.04±0.22 km s-1. The third component is much stronger in Ca iiλ3968.468, making it easily detectable even at the GOSSS resolution (but we do not see it in either LS III +46 11 or LS III +46 11 B). The strength of Ca iiλ3968.468 is a common feature in high-velocity absorption components due to the lifting of the calcium depletion (Routly & Spitzer 1951; Walborn et al. 2002) and is the reason why Ca iiλ3968.468 appears near the top of Fig. 3. The high-velocity component is not seen in the K i lines.
-
We were unable to detect the two kinematic components in any of the DIBs. This is expected, given the spectral resolution of our data, the small velocity difference between the two clouds, and the asymmetric and possibly variable profile of the narrow strong DIBs (Galazutdinov et al. 2008; Oka et al. 2013).
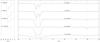 |
Fig. 5 Line profiles with multiple components for LS III +46 11 (left) and LS III +46 12 (right). The K i and Na i spectra are from CAFÉ-BEANS, the CH and CH+ spectra from NoMaDS, and the Ca ii from GOSSS, hence, the significantly lower resolution, though the final spectrum has been drizzled from the original data to improve it. The horizontal dotted lines indicate the normalized continuum level (the spectra are separated by one unit) and the vertical dotted lines indicate the velocities measured for K i and for the third high-velocity component. |
Third, we analyze the widths and column densities by kinematic component (Fig. 5 and Table 6) and calculate the column densities for the atomic and molecular species (whenever possible):
-
The values for the b velocity parameter for the strong kinematic component are rather constant across different lines for the two stars, with values between 3.2 and 3.6 km s-1. The values for the weak component are similar but with a larger scatter, possibly due to the fitting noise induced by the presence of a stronger component. Given the large values of b, its most likely origin is “turbulence” (i.e., multiple components not detectable with the available resolution) rather than thermal motions.
-
The weak component has very similar K i column densities for both stars. That fact agrees with our model that it originates in a cloud (σ1) not associated with Berkeley 90.
-
When we compute the total column-density ratio between LS III +46 12 and LS III +46 11 for K i, we find a value of 0.76±0.07, which is in agreement (within the errors) with the ratios for E(4405−5495) and AV (Fig. 3). It appears that the lower value obtained directly from the EW ratios is indeed caused by a saturation effect. In other words, the comparison between the two sightlines provides a good correlation between the amounts of dust and K i, which is better than for any of the measured DIBs.
-
Even though the uncertainty for the CH+ λ4232.548 weak component is large, the ratio between the column densities of CH and CH+ is larger for the strong component than for the weak component. This finding points in favor of (some of) the strong component originating in a denser medium than the weak component. More specifically, if we include the values in the last panel of Fig. 5 of Smoker et al. (2014), [a] the weak component would have large values of N(CH) and N(CH+) but they would follow the average relation, while [b] the strong component would be located at the top right corner (very large values of both column densities) with a larger than average N(CH)/N(CH+).
-
We can only compare the total column densities of CN with those of CH and CH+. For LS III +46 12, the three column densities fall reasonably well within the trends shown in Fig. 5 of Smoker et al. (2014). For LS III +46 11, CH and CN fall within their trend but both of them are above their expected values with respect to CH+. This indicates that all clouds (and especially cloud ζ) are “CN-like CH”, i.e., dense. If we use the Weselak et al. (2008) sample as a comparison, both stars would be among those with the highest CH column densities. LS III +46 11 would also be in that category for CN but LS III +46 12 would be among the targets with low column densities.
5. Discussion
Our analysis of the ISM in front of Berkeley 90 points toward the existence of [a] one component (σ1) located at a different velocity (and likely distance) than that of the cluster that affects both stars similarly, and [b] a second component at a velocity similar to that of the cluster that affects LS III +46 11 and LS III +46 11 B (as σ2 + ζ) more than LS III +46 12 (as just σ2). All clouds appear to be relatively dense, but cloud ζ is denser than the average of clouds σ1 and σ2. This is shown with several indicators when comparing the equivalent widths different absorption lines for LS III +46 11 (the star with the larger extinction) and LS III +46 12:
-
The EWs for CH λ4300.313 and CNλ3873.999+74.607+ 75.760 increase more than the extinction while CH+ λ4232.548 increases less.
K iλ7664.911+7698.974 increases in a similar way as extinction (once saturation is taken into account).
All DIBs increase less than extinction (the skin effect, Herbig 1995).
ζ-type DIBs (e.g., DIB λ5797.06) increase more than σ-type DIBs (e.g., DIB λ5780.48). ζ-type DIBs originate in different parts of the ISM, including UV-shielded, dense regions, while σ-type DIBs originate preferentially in UV-exposed, thin regions of the ISM and are strongly depleted in dense regions (Krelowski et al. 1997; Cami et al. 1997). This DIB property is the reason for the chosen cloud nomenclature.
For the limited amount of lines with information for LS III +46 11 B, the ISM in front of that star appears to be more similar to LS III +46 11 (to which is spatially closer) than to LS III +46 12.
As previously mentioned, there are few sightlines in the literature with a large number of DIBs and even fewer for targets with extinction as high as these and with the ISM lines measured for the whole optical spectrum. Here we have a pair of sightlines with a common absorption component and another component that affects only one star and which is [a] dense and [b] DIB-depleted. This provides the opportunity to rank the measured DIBs in a σ−ζ scale (Krelowski et al. 1997; Cox et al. 2005) by sorting them by the ratios of the equivalent widths plotted in Fig. 3. We have done that in Table 7:
-
DIB λ4501.67 and DIB λ4726.70 combine the properties of being apparently less affected by depletion in the dense ISM with being relatively narrow and strong. Those two DIBs would be good candidates to correlate better with extinction even when the ISM becomes very dense, which is a hypothesis that we plan to test in the future with other sightlines with high extinction. Previous studies that included DIB λ4726.70, such as Puspitarini et al. (2013), tend to probe just the diffuse ISM. At longer wavelengths the best candidate is still the ζ-prototype, DIB λ5797.06.
-
At the other end of the scale, DIB λ8621.20, present in the Gaia band, is a good example of a strong DIB that is expected to correlate poorly with extinction because it appears to be highly depleted in the dense ISM. A similar case is DIB λ5487.23, which already had the worst correlation with extinction of the eight DIBs in Friedman et al. (2011).
-
An interesting result is that for the pair DIB λ5404.56 + DIB λ5418.87. They have relatively large errors in Table 7, but they are close in wavelength and in opposite sides of the σ−ζ scale, making them good candidates to sample the diverse behavior of DIBs with density. Unfortunately, they are not very strong and they are placed at the wings of He iiλ5411.53, which is strong for O stars.
-
The order in Table 7 is in good agreement with the correlation with extinction for eight DIBs of Friedman et al. (2011).
-
There is no apparent correlation between the σ−ζ scale and the width of the DIBs: there are both narrow and broad DIBs at both ends of the scale.
We have convincingly shown that the amount of extinction is variable across the face of Berkeley 90, with the value for LS III +46 11 being greater than that of LS III +46 12 by 30%, even though they are separated by a little over a pc in the plane of the sky. Also, the additional extinction experienced by LS III +46 11 appears to take place in a relatively dense cloud with properties different from the average of those that cause the rest of the extinction along the line of sight (regarding, e.g., DIBs). Yet, despite those differences, the measured R5495 for both stars is essentially the same, indicating that there are no large differences in the average dust grain size for both sightlines. In other words, environments with different dust grain sizes are not required to produce differences in the observed DIBs.
The velocities for the 6177.30 Å DIB differ from the rest of the DIBs precisely for this reason and should not be considered; only its EWs in Table 2 are of practical use. Nevertheless, the velocities for LS III +46 11 and LS III +46 12 are consistent between them, which is a sign that they originate in the same clouds.
Comparison with our original GOSSS standard grid extended to B stars using MGB yields a B4 V spectral type (Maíz Apellániz et al. 2015a).
The reason for the cloud nomenclature is explained later on.
We should think of these two clouds not as two exclusive physical entities. Indeed, as described below, cloud ζ appears to be associated with the cluster, while cloud σ appears to have two components: one associated with the cluster and one located in the path between Berkeley 90 and the Sun.
Acknowledgments
We would like to thank Nolan R. Walborn and Ignacio Negueruela for useful comments on a previous version of this manuscript. J.M.A. and A.S. acknowledge support from [a] the Spanish Government Ministerio de Economía y Competitividad (MINECO) through grants AYA2010-15 081, AYA2010-17 631, and AYA2013-40 611-P and [b] the Consejería de Educación of the Junta de Andalucía through grant P08-TIC-4075. J.M.A. was also supported by the George P. and Cynthia Woods Mitchell Institute for Fundamental Physics and Astronomy. He is grateful to the Department of Physics and Astronomy at Texas A&M University for their hospitality during some of the time this work was carried out. R.H.B. acknowledges support from FONDECYT Project 1 140 076. S.S.-D. acknowledges funding by [a] the Spanish Government Ministerio de Economía y Competitividad (MINECO) through grants AYA2010-21 697-C05-04, AYA2012-39 364-C02-01, and Severo Ochoa SEV-2011-0187 and [b] the Canary Islands Government under grant PID2 010 119. The data in this article were obtained with the 4.2 m William Hershel Telescope (WHT), the 10.4 m Gran Telescopio Canarias (GTC), and the 2.6 m Nordic Optical Telescope (NOT) at the Observatorio del Roque de los Muchachos (Spain); the 2.2 m and the 3.5 m telescopes at the Calar Alto Observatory (Spain); and the 9.2 m Hobby-Eberly Telescope (HET) at McDonald Observatory (USA).
References
- Barentsen, G., Farnhill, H. J., Drew, J. E., et al. 2014, MNRAS, 444, 3230 [NASA ADS] [CrossRef] [Google Scholar]
- Cami, J., Sonnentrucker, P., Ehrenfreund, P., & Foing, B. H. 1997, A&A, 326, 822 [NASA ADS] [Google Scholar]
- Cox, N. L. J., Kaper, L., Foing, B. H., & Ehrenfreund, P. 2005, A&A, 438, 187 [NASA ADS] [CrossRef] [EDP Sciences] [Google Scholar]
- Duke, D. 1951, ApJ, 113, 100 [NASA ADS] [CrossRef] [Google Scholar]
- Ehrenfreund, P., Foing, B. H., D’Hendecourt, L., Jenniskens, P., & Desert, F. X. 1995, A&A, 299, 213 [NASA ADS] [Google Scholar]
- Friedman, S. D., York, D. G., McCall, B. J., et al. 2011, ApJ, 727, 33 [NASA ADS] [CrossRef] [Google Scholar]
- Galazutdinov, G. A., Musaev, F. A., Krełowski, J., & Walker, G. A. H. 2000, PASP, 112, 648 [NASA ADS] [CrossRef] [Google Scholar]
- Galazutdinov, G. A., LoCurto, G., & Krełowski, J. 2008, ApJ, 682, 1076 [NASA ADS] [CrossRef] [Google Scholar]
- Gardini, A., Maíz Apellániz, J., Pérez, E., Quesada, J. A., & Funke, B. 2013, in Highlights of Spanish Astrophysics VII, 947 [Google Scholar]
- Heger, M. L. 1922, Lick Observatory Bulletin, 10, 146 [Google Scholar]
- Herbig, G. H. 1995, ARA&A, 33, 19 [NASA ADS] [CrossRef] [Google Scholar]
- Hobbs, L. M., York, D. G., Snow, T. P., et al. 2008, ApJ, 680, 1256 [NASA ADS] [CrossRef] [Google Scholar]
- Hobbs, L. M., York, D. G., Thorburn, J. A., et al. 2009, ApJ, 705, 32 [NASA ADS] [CrossRef] [Google Scholar]
- Høg, E., Fabricius, C., Makarov, V. V., et al. 2000, A&A, 355, L27 [NASA ADS] [Google Scholar]
- Jenniskens, P., & Desert, F.-X. 1994, A&AS, 106, 39 [NASA ADS] [Google Scholar]
- Kaźmierczak, M., Schmidt, M. R., Galazutdinov, G. A., et al. 2010, MNRAS, 408, 1590 [NASA ADS] [CrossRef] [Google Scholar]
- Kos, J., Zwitter, T., Grebel, E. K., et al. 2013, ApJ, 778, 86 [NASA ADS] [CrossRef] [Google Scholar]
- Krelowski, J., Schmidt, M., & Snow, T. P. 1997, PASP, 109, 1135 [NASA ADS] [CrossRef] [Google Scholar]
- Lanz, T., & Hubeny, I. 2003, ApJS, 146, 417 [NASA ADS] [CrossRef] [Google Scholar]
- Lanz, T., & Hubeny, I. 2007, ApJS, 169, 83 [CrossRef] [Google Scholar]
- Maier, J. P., Walker, G. A. H., Bohlender, D. A., et al. 2011, ApJ, 726, 41 [NASA ADS] [CrossRef] [Google Scholar]
- Maíz Apellániz, J. 2001, AJ, 121, 2737 [Google Scholar]
- Maíz Apellániz, J. 2004, PASP, 116, 859 [NASA ADS] [CrossRef] [Google Scholar]
- Maíz Apellániz, J. 2013a, in Highlights of Spanish Astrophysics VII, 583 [Google Scholar]
- Maíz Apellániz, J. 2013b, in Highlights of Spanish Astrophysics VII, 657 [Google Scholar]
- Maíz Apellániz, J., Alfaro, E. J., & Sota, A. 2008, ArXiv e-print [arXiv:0804.2553] [Google Scholar]
- Maíz Apellániz, J., Sota, A., Walborn, N. R., et al. 2011, in Highlights of Spanish Astrophysics VI, eds. M. R. Zapatero Osorio, J. Gorgas, J. Maíz Apellániz, J. R. Pardo, & A. Gil de Paz, 467 [Google Scholar]
- Maíz Apellániz, J., Pellerin, A., Barbá, R. H., et al. 2012, in ASP Conf. Ser. 465, eds. L. Drissen, C. Robert, N. St-Louis, & A. F. J. Moffat, 484 [Google Scholar]
- Maíz Apellániz, J., Evans, C. J., Barbá, R. H., et al. 2014a, A&A, 564, A63 [NASA ADS] [CrossRef] [EDP Sciences] [Google Scholar]
- Maíz Apellániz, J., Sota, A., Barbá, R. H., et al. 2014b, in IAU Symp. 297, eds. J. Cami, & N. L. J. Cox, 117 [Google Scholar]
- Maíz Apellániz, J., Alfaro, E. J., Arias, J. I., et al. 2015a, in Highlights of Spanish Astrophysics VIII, eds. A. J. Cenarro, F. Figueras, C. Hernández-Monteagudo, J. Trujillo Bueno, & L. Valdivielso, 603 [Google Scholar]
- Maíz Apellániz, J., Negueruela, I., Barbá, R. H., et al. 2015b, A&A, 579, A108 [NASA ADS] [CrossRef] [EDP Sciences] [Google Scholar]
- McCall, B. J., Drosback, M. M., Thorburn, J. A., et al. 2010, ApJ, 708, 1628 [NASA ADS] [CrossRef] [Google Scholar]
- Merrill, P. W. 1934, PASP, 46, 206 [NASA ADS] [CrossRef] [Google Scholar]
- Munari, U., Tomasella, L., Fiorucci, M., et al. 2008, A&A, 488, 969 [NASA ADS] [CrossRef] [EDP Sciences] [Google Scholar]
- Negueruela, I., Maíz-Apellániz, J., Simón-Díaz, S., et al. 2015, in Highlights of Spanish Astrophysics VIII, eds. A. J. Cenarro, F. Figueras, C. Hernández-Monteagudo, J. Trujillo Bueno, & L. Valdivielso, 524 [Google Scholar]
- Oka, T., Welty, D. E., Johnson, S., et al. 2013, ApJ, 773, 42 [NASA ADS] [CrossRef] [Google Scholar]
- Pellerin, A., Maíz Apellániz, J., Simón-Díaz, S., & Barbá, R. H. 2012, in Am. Astron. Soc. Meet. Abstr., 219, 224.03 [Google Scholar]
- Penadés Ordaz, M., Maíz Apellániz, J., & Sota, A. 2013, in Highlights of Spanish Astrophysics VII, eds. J. C. Guirado, L. M. Lara, V. Quilis, & J. Gorgas, 600 [Google Scholar]
- Puspitarini, L., Lallement, R., & Chen, H.-C. 2013, A&A, 555, A25 [NASA ADS] [CrossRef] [EDP Sciences] [Google Scholar]
- Raimond, S., Lallement, R., Vergely, J. L., Babusiaux, C., & Eyer, L. 2012, A&A, 544, A136 [NASA ADS] [CrossRef] [EDP Sciences] [Google Scholar]
- Routly, P. M., & Spitzer, Jr., L. 1951, AJ, 56, 138 [NASA ADS] [CrossRef] [Google Scholar]
- Salama, F., Galazutdinov, G. A., Krełowski, J., et al. 2011, ApJ, 728, 154 [NASA ADS] [CrossRef] [Google Scholar]
- Simón-Díaz, S., Castro, N., García, M., & Herrero, A. 2011, in IAU Symp. 272, eds. C. Neiner, G. Wade, G. Meynet, & G. Peters, 310 [Google Scholar]
- Simón-Díaz, S., Negueruela, I., Maíz Apellániz, J., et al. 2015, in Highlights of Spanish Astrophysics VIII, eds. A. J. Cenarro, F. Figueras, C. Hernández-Monteagudo, J. Trujillo Bueno, & L. Valdivielso, 576 [Google Scholar]
- Skrutskie, M. F., Cutri, R. M., Stiening, R., et al. 2006, AJ, 131, 1163 [NASA ADS] [CrossRef] [Google Scholar]
- Smoker, J., Ledoux, C., Jehin, E., et al. 2014, MNRAS, 438, 1127 [NASA ADS] [CrossRef] [Google Scholar]
- Snow, T. P., Zukowski, D., & Massey, P. 2002, ApJ, 578, 877 [NASA ADS] [CrossRef] [Google Scholar]
- Steglich, M., Bouwman, J., Huisken, F., & Henning, T. 2011, ApJ, 742, 2 [NASA ADS] [CrossRef] [Google Scholar]
- Thorburn, J. A., Hobbs, L. M., McCall, B. J., et al. 2003, ApJ, 584, 339 [NASA ADS] [CrossRef] [Google Scholar]
- Tuairisg, S. Ó., Cami, J., Foing, B. H., Sonnentrucker, P., & Ehrenfreund, P. 2000, A&AS, 142, 225 [NASA ADS] [CrossRef] [EDP Sciences] [Google Scholar]
- van Hoof, P. 1999, UV, Optical & Infrared Line List v2.04, on line, http://www.pa.uky.edu/~peter/atomic/index.html [Google Scholar]
- van Loon, J. T., Bailey, M., Tatton, B. L., et al. 2013, A&A, 550, A108 [NASA ADS] [CrossRef] [EDP Sciences] [Google Scholar]
- Vos, D. A. I., Cox, N. L. J., Kaper, L., Spaans, M., & Ehrenfreund, P. 2011, A&A, 533, A129 [NASA ADS] [CrossRef] [EDP Sciences] [Google Scholar]
- Walborn, N. R., Danks, A. C., Vieira, G., & Landsman, W. B. 2002, ApJS, 140, 407 [NASA ADS] [CrossRef] [Google Scholar]
- Weselak, T., Galazutdinov, G. A., Musaev, F. A., & Krełowski, J. 2008, A&A, 484, 381 [NASA ADS] [CrossRef] [EDP Sciences] [Google Scholar]
All Tables
ISM lines measured for LS III +46 11 (S1) and LS III +46 12 (S2) in the WHT and high-resolution spectra.
DIBs for which the measured values of λ0 and/or FWHM are significantly different for LS III +46 11 and LS III +46 12 when compared with the reference values.
EWs measured for LS III +46 11 (S1), LS III +46 11 B (S1B), and LS III +46 12 (S2) in the GTC spectra.
All Figures
|
Fig. 1 Left: 2MASS KSHJ three-color RGB mosaic of Berkeley 90. The intensity level in each channel is logarithmic. Right: false-color AstraLux |
| In the text | |
|
Fig. 2 Top: GTC combined spectrum of LS III +46 11 B. Middle: best TLUSTY fit for LS III +46 11 B. Bottom: residual obtained by dividing the top spectrum by the middle fit. |
| In the text | |
|
Fig. 3 Equivalent-width ratios between LS III +46 12 and LS III +46 11 for the cases in Table 2 where measurements for both stars could be obtained. Red is used for atomic lines, green for molecular lines, and blue for DIBs. All points show the EW uncorrected for saturation (which should be a good approximation in all cases except for the intense atomic lines) except for K iλ7664.911+7698.974. In that case, besides the uncorrected values, we show the corrected value (as an unfilled symbol) calculated using the kinematic decomposition described in the text. The x value in each case is λ0, the length of the horizontal error bars is proportional (with a threshold for the narrowest ones) to the FWHM of the line, and the vertical error bars show the uncertainty in the measurement. The two dotted lines are the ratios for E(4405−5495) and AV. |
| In the text | |
|
Fig. 4 Model for the ISM clouds present in the LS III +46 11 and LS III +46 12 sightlines. Cloud σ1 is of low density, not associated with the cluster, and affects both sightlines similarly. Cloud σ2 is also of low density, is the skin of the cloud associated with the cluster, and is longer along the LS III +46 12 sightline. Cloud ζ is of high density, is the core of the cloud associated with the cluster, and affects LS III +46 11 exclusively (or, at least, to a much larger degree than LS III +46 12). |
| In the text | |
|
Fig. 5 Line profiles with multiple components for LS III +46 11 (left) and LS III +46 12 (right). The K i and Na i spectra are from CAFÉ-BEANS, the CH and CH+ spectra from NoMaDS, and the Ca ii from GOSSS, hence, the significantly lower resolution, though the final spectrum has been drizzled from the original data to improve it. The horizontal dotted lines indicate the normalized continuum level (the spectra are separated by one unit) and the vertical dotted lines indicate the velocities measured for K i and for the third high-velocity component. |
| In the text | |
Current usage metrics show cumulative count of Article Views (full-text article views including HTML views, PDF and ePub downloads, according to the available data) and Abstracts Views on Vision4Press platform.
Data correspond to usage on the plateform after 2015. The current usage metrics is available 48-96 hours after online publication and is updated daily on week days.
Initial download of the metrics may take a while.