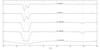
Fig. 5
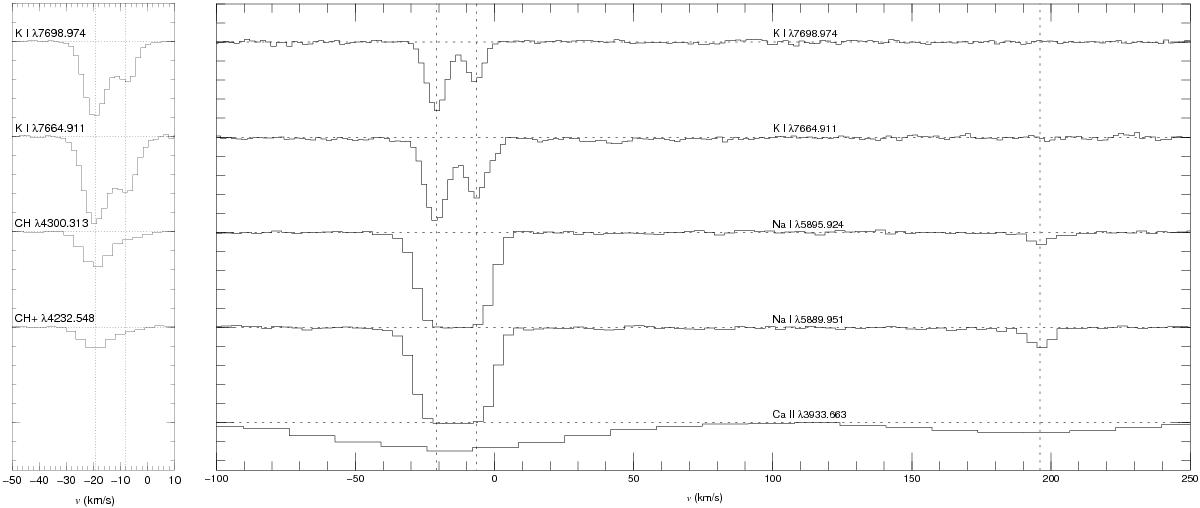
Line profiles with multiple components for LS III +46 11 (left) and LS III +46 12 (right). The K i and Na i spectra are from CAFÉ-BEANS, the CH and CH+ spectra from NoMaDS, and the Ca ii from GOSSS, hence, the significantly lower resolution, though the final spectrum has been drizzled from the original data to improve it. The horizontal dotted lines indicate the normalized continuum level (the spectra are separated by one unit) and the vertical dotted lines indicate the velocities measured for K i and for the third high-velocity component.
Current usage metrics show cumulative count of Article Views (full-text article views including HTML views, PDF and ePub downloads, according to the available data) and Abstracts Views on Vision4Press platform.
Data correspond to usage on the plateform after 2015. The current usage metrics is available 48-96 hours after online publication and is updated daily on week days.
Initial download of the metrics may take a while.