Free Access
Fig. 1
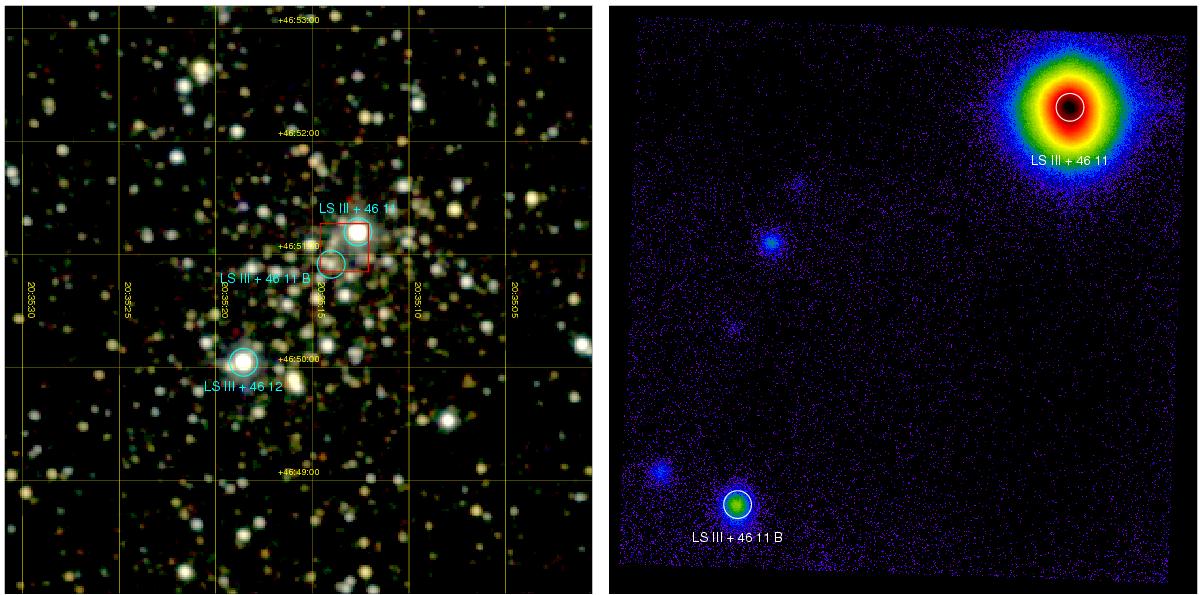
Left: 2MASS KSHJ three-color RGB mosaic of Berkeley 90. The intensity level in each channel is logarithmic. Right: false-color AstraLux ![]() i-band image of LS III +46 11 (see Paper I). North is up and east is left and the image location corresponds to the red square in the left panel. The intensity level is logarithmic.
i-band image of LS III +46 11 (see Paper I). North is up and east is left and the image location corresponds to the red square in the left panel. The intensity level is logarithmic.
This figure is made of several images, please see below:
Current usage metrics show cumulative count of Article Views (full-text article views including HTML views, PDF and ePub downloads, according to the available data) and Abstracts Views on Vision4Press platform.
Data correspond to usage on the plateform after 2015. The current usage metrics is available 48-96 hours after online publication and is updated daily on week days.
Initial download of the metrics may take a while.