| Issue |
A&A
Volume 583, November 2015
|
|
|---|---|---|
| Article Number | A48 | |
| Number of page(s) | 13 | |
| Section | Extragalactic astronomy | |
| DOI | https://doi.org/10.1051/0004-6361/201526446 | |
| Published online | 26 October 2015 | |
Mapping the inner regions of the polar disk galaxy NGC 4650A with MUSE⋆
1
INAF-Astronomical Observatory of Capodimonte, via Moiariello 16, 80131
Naples, Italy
e-mail:
iodice@na.astro.it
2
ESO, Karl-Schwarzschild-Strasse 2, 85748
Garching,
Germany
3
Observatoire de Paris, LERMA, PSL, CNRS, Sorbonne Univ. UPMC and
College de France, 75014
Paris,
France
4
Collège de France, 11 place Marcelin Berthelot, 75005
Paris,
France
5
Leiden Observatory, Leiden University,
Postbus 9513, 2300 RA
Leiden, The
Netherlands
6
Leibniz-Institut
für
Astrophysik Potsdam (AIP), An der
Sternwarte 16, 14482
Potsdam,
Germany
7
CRAL – Observatoire de Lyon, 9 avenue Charles André, 69230
Saint-Genis-Laval,
France
8
INAF, Osservatorio Astronomico di Torino, Strada Osservatorio
20, 10025
Pino Torinese,
Italy
Received: 30 April 2015
Accepted: 19 August 2015
The polar disk galaxy NGC 4650A was observed during the commissioning of the Multi Unit Spectroscopic Explorer (MUSE) at the ESO Very Large Telescope to obtain the first 2D map of the velocity and velocity dispersion for both stars and gas. The new MUSE data allow the analysis of the structure and kinematics towards the central regions of NGC 4650A, where the two components co-exist. These regions were unexplored by the previous long-slit literature data available for this galaxy. The stellar velocity field shows that there are two main directions of rotation, one along the host galaxy major axis (PA = 67 deg) and the other along the polar disk (PA = 160 deg). The host galaxy has, on average, the typical pattern of a rotating disk, with receding velocities on the SW side and approaching velocities on the NE side, and a velocity dispersion that remains constant at all radii (σstar ~ 50−60 km s-1). The polar disk shows a large amount of differential rotation from the centre up to the outer regions, reaching V ~ 100−120 km s-1 at R ~ 75 arcsec ~ 16 kpc. Inside the host galaxy, a velocity gradient is measured along the photometric minor axis. Close to the centre, for R ≤ 2 arcsec the velocity profile of the gas suggests a decoupled component and the velocity dispersion increases up to ~110 km s-1, while at larger distances it remains almost constant (σgas ~ 30−40 km s-1). The extended view of NGC 4650A given by the MUSE data is a galaxy made of two perpendicular disks that remain distinct and drive the kinematics right into the very centre of this object. In order to match this observed structure for NGC 4650A, we constructed a multicomponent mass model made by the combined projection of two disks. By comparing the observations with the 2D kinematics derived from the model, we found that the modelled mass distribution in these two disks can, on average, account for the complex kinematics revealed by the MUSE data, also in the central regions of the galaxy where the two components coexist. This result is a strong constraint on the dynamics and formation history of this galaxy; it further supports the idea that polar disk galaxies like NGC 4650A were formed through the accretion of material that has different angular momentum.
Key words: galaxies: kinematics and dynamics / galaxies: individual: NGC 4650A
© ESO, 2015
1. Introduction
The polar disk galaxy NGC 4650A is the prototype of the class of polar-ring galaxies (PRG, see Iodice 2014, for a review). Since it is characterized by two components, the central host galaxy (HG) and the polar structure that rotate on almost perpendicular planes, it is also classified as a multispin galaxy (Rubin 1994), a class that includes all systems with a kinematically distinct component of gas and/or stars with a variety of inclination angles and radial extent with respect to the host galaxy. Two main processes were proposed for the formation of the decoupled component in multispin galaxies: accretion of material (gas and/or stars) from outside (from other galaxies and/or environments) by the pre-existing host galaxy, or merging galaxy (see Combes 2014; Iodice 2014, for reviews). In the cold dark matter scenario for galaxy formation, such gravitational interactions play a fundamental role in defining the morphology of “normal” galaxies, in particular in the building up of spheroids. Thus, in this framework, the study of multispin galaxies, both at low and high redshift, can shed light on the main processes at work during galaxy interactions and on the influence of the environment (see Conselice 2014, for a review). Moreover, the existence of two orthogonal components of the angular momentum makes the PRGs the ideal laboratory in which to derive the 3D shape of the dark matter spheroid that dominates the gravitational potential (see Arnaboldi 2014, for a review).
In the last ten years, a large amount of data (images in the optical and near-infrared bands, emission and absorption line long-slit spectroscopy and H i radio emission) has been collected for NGC 4650A. In the combined analysis of the whole data set, by studying morphology, kinematics, and stellar population, the structure and formation for this fascinating galaxy was outlined very accurately. In detail, NGC 4650A is the first PRG classified as a polar disk galaxy; in these galaxies stars and dust in the polar structure are traced inward within the HG, down to the galaxy centre (Arnaboldi et al. 1997; Iodice et al. 2002; Gallagher et al. 2002; Swaters & Rubin 2003). Thus, the two components co-exist in the inner regions. The main properties of the polar structure are i) the large amount of H i gas, 1011M⊙, which is four times more extended than the optical counterpart (i.e. up to 40 kpc from the centre); ii) the differential rotation; and iii) the subsolar metallicity Z = 0.2 Z⊙, which is constant over the whole extension of the disk (Spavone et al. 2010). Given its spheroidal shape, the HG in NGC 4650A has been classified as a S0-like system. This morphological classification was disputed by Iodice et al. (2006) on the basis of the stellar kinematics along the spheroid’s main axes. In fact, even if this component is rotationally supported, with a maximum rotation velocity along the major axis of V ≃ 80−100 km s-1, the velocity dispersion remains almost constant (σ ~ 65 km s-1) at all radii and along both axes. These measurements put the HG far from the Faber-Jackson relation for early-type galaxies (see Iodice et al. 2006; Iodice 2014), which shows that NGC 4650A has lower central velocity dispersion than that measured for spheroids of comparable luminosity.
The structure, kinematics, and metallicity derived for NGC 4650A are consistent with the formation of a polar disk galaxy through the accretion of gas from outside, either from a cosmic filament or from a gas-rich donor with a different angular momentum (Spavone et al. 2010; Combes 2014).
From dynamical studies for the kinematics of NGC 4650A, the best models predict a flattened E6–E7 dark halo, with its major axis aligned along the plane of the polar disk itself (Combes & Arnaboldi 1996; Napolitano et al. 2014). The biggest uncertainties in these mass models reside i) in the limited spatial coverage of the long-slit spectra and ii) in the contamination of the HG kinematics by the stars in the polar disk, in the regions where the two components coexist. The long-slit spectra cannot trace both the S-shape morphology of the polar disk towards the centre of the galaxy (Iodice et al. 2002) and the warped arms at large radii (Swaters & Rubin 2003), thus the star and gas motions for this component are not mapped in these regions.
Recently, Coccato et al. (2014) made a first attempt to disentangle the contribution of the stars in the two components (HG and polar disk) along the HG minor axis. The main results indicate that along this direction i) the significant rotation measured seems to be an intrinsic property of the HG rather then an artefact caused by the contamination of the stars in the polar disk and ii) the polar disk shows a kinematic decoupling in the inner regions, which is counter-rotating with respect to the outer regions and the HG. These findings pointed out again the complex structure of NGC 4650A in the regions where the two components coexist and suggested that the determination of the internal structure of NGC 4650A clearly requires integral-field spectroscopy.
In this work we present new observations taken for NGC 4650A with the Multi Unit Spectroscopic Explorer (MUSE) at the ESO Very Large Telescope (VLT). The wide wavelength range and the high spectral resolution combined with the large field of view and fine angular sampling of MUSE (Bacon et al. 2010) allow us to derive the first 2D field of the rotation velocity and velocity distribution for both stars and gas in NGC 4650A. Thus, we are able to analyse the entire 2D structure (morphology and kinematics) of both HG and polar disk, in particular in the regions close to the galaxy centre where both components contribute to the light distribution and kinematics.
In this paper, we adopt a distance to NGC 4650A of 43.4 Mpc and H0 = 73 km s-1 Mpc-1. This implies that 1 arcsec = 0.21 kpc.
2. Observations and data reduction
Observations of NGC 4650A were taken with the Multi Unit Spectroscopic Explorer (MUSE) mounted on Unit Telescope 4 (UT4) of the ESO VLT at Paranal, Chile, during the instrument commissioning run on 8 and 12 February 2014. Observations were acquired in the wide field mode, having a 1 × 1 arcmin field of view and a scale of 0.2 arcsec/pixel. The spectral range is 4800−9300 Å and the instrumental dispersion is about 55 km s-1 at 5200 Å (Bacon et al. 2010).
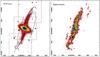 |
Fig. 1 Left panel: MUSE mosaic of NGC 4650A in the SDSS r-band. The mosaic covers an area of 1.5′ × 2.5′. The X-axis is the right ascension (h min s) and the Y-axis is the declination (in degrees). Dashed boxes indicate the single MUSE pointings. Dashed and dotted arcs trace the structure of the spiral arms (see text). Right panel: Hα emission from MUSE data. North is up and east is on the left. |
The data consist of 12 dithered exposures of 10 min each, divided into three pointings. The central pointing, obtained by combining six exposures, covers the host galaxy of NGC 4650A and part of the polar structure. The northern and southern arms of the polar disk are covered by combining three exposures for each side. A standard calibration was adopted for this run, which includes bias, flat field, and comparison arcs. A standard star (GD 71) was observed at the beginning of each night to correct for instrument response across the wavelength range. The average seeing was FWHM ~ 0.6 arcsec.
Data reduction was performed using the MUSE pipeline version 0.18.5 (Weilbacher et al. 2014) under the REFLEX environment (Freudling et al. 2013). The sky background was evaluated on the regions of the field of view where the galaxy contribution was negligible. The different pointings were aligned using foreground stars as reference, and then combined to create a final datacube. The alignment consisted of offsets along the RA and Dec direction, and a ~3 deg rotation1. We noticed that imperfect sky subtraction left strong residuals for wavelengths larger than ~7000 Å. We therefore concentrated our analysis on the wavelength range 4780 Å−6850 Å.
The final MUSE mosaic of NGC 4650A is 1.5 × 2.5 arcmin (see Fig. 1). The MUSE optical r-band image of NGC 4650A (see left panel Fig. 1) shows clearly that the light distribution is dominated by two almost perpendicular disk-like components.
The MUSE map of the Hα emission is shown in the right panel in Fig. 1. As already known for this galaxy (Arnaboldi et al. 1997; Swaters & Rubin 2003), the neutral and ionized gas component resides completely in the polar disk. The MUSE data reveal the whole 2D distribution of the ionized gas and that the emission from the star forming regions is also quite strong close to the centre of the galaxy.
The MUSE data for NGC 4650A are consistent with the view given by previous HI data (Arnaboldi et al. 1997) and the optical and near-infrared images (Iodice et al. 2002; Gallagher et al. 2002). They showed that the S-shape observed in the near-infrared images, the dust and bright blue knots detected in the optical data, and the HI iso-velocity contours are reconciled by the presence of spiral arms in the almost edge-on polar disk (Arnaboldi et al. 1997). These features originate near the centre of the galaxy, the southern arm passes in front of the HG and its light and dust affect the underlying HG component on the SW side. The structure of the spiral arms derived by the best fit of the HI data is plotted on the MUSE r-band image of NGC 4650A (see left panel in Fig. 1). The Hα emission shows several bright knots in correspondence with the outer parts of the NW and SE arms.
3. Two-dimensional kinematics of stars and gas
3.1. Measurements
To measure the absorption line kinematics, it was necessary to add the spectra of adjacent spatial pixels in the field of view. To this aim, we adopted the Voronoi binning scheme, using the IDL implementation by Cappellari & Copin (2003). The ionized gas emission lines were strong enough to be measured on individual spatial pixels, except for the innermost 5′′, where we used the spatial bins defined in the Voronoi Tesselation.
We first measured the stellar and ionized gas kinematics on the spatial bins defined by the Voronoi Tesselation, using the pPXF (Cappellari & Emsellem 2004) and Gandalf (Sarzi et al. 2006) IDL fitting routines. We then used the measured stellar kinematics to constrain the stellar continuum in each single spatial pixel and subsequently measured the emission line kinematics.
In both the absorption and emission line fits, we include multiplicative polynomials of degree 8 to account for the shape of the stellar continuum. In the pPXF fitting, we used the library of single stellar population spectra from Vazdekis et al. (2012).
Each emission line was fitted independently; the mean ionized gas kinematics was derived by averaging the results for each emission line. The fitted emission lines are Hβλ4861, [O iii]λλ4959,5007, [N i]λλ5198,5200, [He i]λ5876, [Na i]λλ5890,5896, [O ii]λλ6300,6364, [N ii]λ6548, Hαλ6563, [N ii]λ6583, [S ii]λ6717, and [S ii]λ6731. The amplitude versus noise of each line was used as a weight in the average; we did not consider emission lines whose amplitude-to-noise ratio was lower than 4. The mean velocity and velocity dispersion are the luminosity weighted mean of the lines that satisfy the above criteria. For the majority of the spatial bins, only the Hα, Hβ, [N ii], and [O iii] lines satisfy the above criteria.
3.2. Stellar kinematics
The 2D maps of the line-of-sight velocity and velocity dispersion for stars in NGC 4650A are shown in Fig. 2. The two main directions of the star rotation are along the HG major axis (where the position angle is PA = 67 deg) and along the polar disk (PA = 160 deg), which is almost perpendicular to the HG (see left panel in Fig. 2).
Inside the HG, the velocity dispersion remains quite constant at all distances from the galaxy centre and PAs, at σ ~ 50−60 km s-1, while it is larger along the polar disk up to σ~100 km s-1 in the outer regions (see right panel in Fig. 2). The increase in the stellar velocity dispersion along the polar disk direction was already found from the long-slit data by Iodice et al. (2006). By using this data set, after separating the contribution by the stars in the HG from that of the stars in the polar disk, Coccato et al. (2014) concluded that the increase of velocity dispersion observed along the polar disk is an intrinsic property.
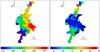 |
Fig. 2 Map of the line-of-sight rotation velocity (left panel) and velocity dispersion (right panel) of stars in NGC 4650A. The cross marks the centre of the galaxy where the systemic velocity is V = 2875 ± 3 km s-1 and velocity dispersion is σ = 60 ± 6 km s-1. |
Below, we focus on the description of the 2D kinematics in the regions where the two components, HG and polar disk, co-exist. In particular, we discuss how features and perturbations in the velocity field of stars can be reconciled by the structure of the light distribution at the same radii.
HG major axis − The overall iso-velocity contours inside the HG resemble the typical pattern of a rotating disk, with receding velocities on the SW side and approaching velocities on the NE side. Nevertheless, the MUSE measurements show that along the HG major axis the iso-velocity contours on the side indicates a flatter rotation curve than the corresponding regions on the east side (see top left panel in Fig. 3). Along this direction, the light distribution is also not symmetric with respect to the centre: the optical image shows that at R ≥ 10 arcsec the SW isophotes are rounder than those at the same distance from centre on the other side, which appear more disky (see left panel in Fig. 1). This asymmetry in the light is more evident from the high-frequency residual image2 of the MUSE r-band mosaic where the disk of the HG is more extended on the NE side (R ~ 20 arcsec) than on the SW side (R ≤ 16 arcsec, see the top left panel in Fig. 3). This is a strong indication that the asymmetry in the kinematics reflects an asymmetry in the structure of the HG disk. This effect can be quantified by looking at the folded light profiles and the folded line-of-sight velocity profiles extracted along the HG major axis, shown in Fig. 4. As noticed in the velocity field, the NE velocity profile rises at all radii, while the SW velocities tend to have constant values for R ≥ 10 arcsec. The light profiles have a different slope for R ≥ 16 arcsec, where the NE profile has a steeper decline than that the SW profile.
Finally, we found that the kinematic and photometric major axis are not coincident. We measured the kinematic PA profile by using the software Kinemetry3, and it is shown in Fig. 5. The average value in the range of radii inside the regions of the HG that are not perturbed by the polar disk (4 ≤ R ≤ 12 arcsec) is PAkin = 72.2 ± 0.6 deg. This was compared with the photometric PA profile derived by the fit of the isophote performed on the MUSE mosaic of NGC 4650A in the r-band. In the same range of radii the photometric PA is about 5 deg smaller than the kinematic PA, being PApho = 67 ± 2 deg (see Fig. 5).
HG minor axis − Another interesting feature in the stellar velocity field inside the HG is the non-zero velocity curve along the PA = 157 deg, which corresponds to the HG minor axis and to the polar disk major axis (see top left panel in Fig. 3). This suggests some rotation along this direction that was already found in the velocity curves derived from the long-slit data. By separating the contribution of the velocity of stars in the polar disk from that in the HG, which co-exist along this direction, Coccato et al. (2014) suggested that this could be a real additional feature of the galaxy structure.
Perturbations due to the polar disk − The co-existence of the polar disk in the inner regions of the HG (as shown by the high-frequency residual image in the top right panel in Fig. 3) generates some perturbations to the velocity distribution of stars.
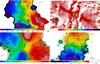 |
Fig. 3 Top left panel: enlarged image of the 2D map of the line-of-sight velocity of stars in the region of the HG. The iso-velocity contours are overlaid on the image, the minimum and maximum values are 2785 km s-1 and 2960 km s-1, with a step of about 6 km s-1. The cross marks the centre of the galaxy where the systemic velocity is V = 2875 ± 3 km s-1. The dashed lines indicate the photometric major and minor axes of the HG. Top right panel: high-frequency residual image obtained by the ratio of the original reduced r-band MUSE image with a smoothed one, where each original pixel value is replaced with the median value in a rectangular window of 25 × 25 pixels. Bottom left panel: enlarged image of the 2D map of the velocity field derived by the model. The dashed line indicates the direction of the HG minor axis PA = 157°. The iso-velocity contours are overlaid on the image, the minimum and maximum values are −145 km s-1 and 145 km s-1, with a step of about 13 km s-1. See Sect. 4 for details. Bottom right panel: enlarged image of the 2D map of the line-of-sight velocity of gas in the regions close to centre of the galaxy. The iso-velocity contours are overlaid on the image, the minimum and maximum values are 2800 km s-1 and 2920 km s-1, with a step of about 6 km s-1. In all images the cross marks the centre of the galaxy and north is up, east on the left. |
Along the HG major axis, for 3 ≤ R ≤ 6 arcsec, the iso-velocity contours are affected by the stars in the polar disk arms which pass in front of the HG on the SW side and behind the HG on the NE side (see upper panel in Fig. 3). The same features are also evident in the folded light profiles and rotation curves, shown in Fig. 4.
On the NW side, at R ~ 7 arcsec from the centre (see top left panel in Fig. 3), the velocity field shows a region where the stellar velocity is blue-shifted with respect to those of the surrounding area, which are red-shifted. In the same region, the velocity dispersion is larger than the average value at the nearby points (see right panel in Fig. 2). We checked that these measurements are not the result of a bad fit. They correspond to the region of the NW arm of the polar disk that emerges from the galaxy centre on the north side and then goes down, passing in front of the HG (see top right panel in Fig. 3). The measured velocity and velocity dispersion in this spatial bin, where the contribution from the stars in the HG is negligible, have similar values to those in the southern arm of the polar disk at about 10 arcsec from the centre.
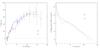 |
Fig. 4 Folded line-of-sight velocity profiles of stars (left panel) and surface brightness profiles (right panel) along the HG photometric major axis (PA = 67 ± 2 deg) from the MUSE data. |
The same explanation can be valid for another “out-of-bound” region on the SE side of the HG at R ≃ 15 arcsec from the centre, where velocity is lower and dispersion is higher with than in the nearby regions (see top left panel in Fig. 3 and the right panel in Fig. 2). This area can match the kinematics of the fainter southern arm of the polar disk which goes up and intersects the outer regions of the HG on the east side (see left panel in Fig. 1 and top right panel in Fig. 3). In this case the velocity and velocity dispersion are also consistent with the values measured for the SE arm of the polar disk.
3.3. Comparison with the kinematics from long-slit data
From the 2D kinematics of the stars in NGC 4650A we derived the profiles of the line-of-sight velocity and velocity dispersion, along the major and minor axis of the HG. These are shown in Fig. 6 and are compared with the same quantities for this component in NGC 4650A obtained by the long-slit data taken with FORS2 at VLT (Iodice et al. 2006) and data published by Sackett et al. (1994). The agreement among the new and literature line-of-sight velocity profiles is very good. The velocity dispersion measured by Iodice et al. (2006) from the long-slit data is systematically larger for measurements based on the the absorption lines around 5100 Å. We understand that this is a systematic effect caused by the contamination of the Paschen lines in the calcium triplet (CaT) wavelength range, which leads to a higher estimation of the velocity dispersion (Iodice et al. 2006). The MUSE 2D map of the Hα emission also shows a strong intensity in the regions of the HG (see Fig. 1, right panel). This suggests the presence of hot and young stars and hence the contamination of the Paschen lines as the origin to the systematic effect that caused lager velocity dispersion measurements for the CaT lines versus those measured with the Mgb and Fe lines. The velocity dispersion values measured from the MUSE spectra are derived from the Mgb and Fe lines and they are smaller.
3.4. Gas kinematics
The 2D maps of the line-of-sight velocity and velocity dispersion derived by the emission lines in NGC 4650A are shown in Fig. 7 and in the bottom right panel in Fig. 3. The ionized gas kinematics is mapped out to 75 arcsec from the centre, i.e. up to about 16 kpc, while the previous rotation curves from long-slit data extend up to 10−12 kpc (Swaters & Rubin 2003). The 2D velocity map of the ionized gas show that the polar disk has a large amount of differential rotation from the centre out to the outer regions, reaching V ~ 100−120 km s-1 at R ~ 75 arcsec ~16 kpc. This is consistent with the HI distribution that was well fitted by a model of disk in differential rotation (Arnaboldi et al. 1997).
From the MUSE data of the ionized gas, the velocity of the approaching and receding arms on the NW and SE sides of the polar disk is measured for the first time. The gas velocity dispersion remains almost constant (σgas ~ 30−40 km s-1) at all radii (see right panel in Fig. 7).
Along the polar disk, there are some regions where the line-of-sight velocity and velocity dispersion have different values to those measured in the nearby regions. This is particular evident on the east side and on the outer north-west side, where velocities are lower (close to the systemic value) than in the adjacent regions. These features reflect the structure of the polar disk. As discussed in Sect. 2, the polar disk contains two prominent spiral arms that originate near the centre of the galaxy, and two fainter arms that are visible at larger radii. The fainter southern arm goes up on the east side and it overlaps the north arm at about 30 arcsec from the centre (see Fig. 7 and also left panel in Fig. 1). As a consequence, in these regions the velocity of the gas has different values from that in the surrounding area. Consistently, the velocity dispersion also has different values to those in the adjacent regions.
We measured the rotation curve and velocity dispersion profile along the polar disk major axis, at PA = 160 deg, and they are shown in the left panels in Fig. 8. The line-of-sight velocity increases with distance from the galaxy centre. It reaches ~100 km s-1 at R ~ 50 arcsec on the NW side and ~120 km s-1 at R ~ 58 arcsec on the SE side. The rotation curve along the polar disk derived from the MUSE data is consistent with that derived by Swaters & Rubin (2003) from the [O iii] and Hα emission lines by using slit spectra. The above values are consistent with the HI velocities in the range 4 ≤ R ≤ 16 kpc4. As pointed out previously, the velocity dispersion along the polar disk is almost constant (σ ~ 30−40 km s-1) at all radii, except for the centre.
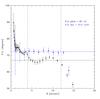 |
Fig. 5 Kinematic (blue points) and photometric (black points) PA profiles. The straight lines (blue and black) indicate the average values of the two PAs in the range of radii inside the regions of the HG that are not perturbed by the polar disk (4 ≤ R ≤ 12 arcsec). |
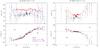 |
Fig. 6 Stellar kinematics along the major axis (left panel) and minor axis (right panel) of the HG in NGC 4650A derived by MUSE data (black points) in the Mgb wavelength region compared with the profiles obtained by Sackett et al. (1994), blue points, in the same region, and longslit spectra by Iodice et al. (2006), red points, in the CaT wavelength region. |
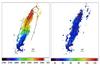 |
Fig. 7 Maps of the line-of-sight velocity (left panel) and velocity dispersion (right panel) of the gas in NGC 4650A. The cross marks the centre of the galaxy where rotation is V = 2880 ± 19 km s-1 and velocity dispersion is σ = 100 ± 20 km s-1. In the left panel, the dashed and dotted arcs trace the structure of the spiral arms, as in Fig. 1. |
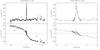 |
Fig. 8 Left panel: line-of-sight velocity (bottom panel) and velocity dispersion (upper panel) of the gas along the polar disk major axis, PA = 160°. Right panel: zoom of the gas rotation (bottom) and dispersion (upper) curves towards the centre of the galaxy. |
3.5. Gas kinematics in the galaxy centre
The MUSE data for NGC 4650A allow us to map the 2D kinematics of the ionized gas all the way to the centre of this galaxy. Previous long-slit data traced the ionized gas kinematics only along the two arms of the polar disk where the line emission is stronger and so did not cross the galaxy centre.
The MUSE data show that inside 5 arcsec (see bottom right panel in Fig. 3), the iso-velocity contours are almost parallel to the minor axis of the polar disk (i.e. PA = 70 deg), suggesting a cylindrical rotation inside this region. Deviations from such behaviour are observed closer to the centre, for R ≤ 1 arcsec, where the iso-velocity contours show a modest twist. As noted for the velocity distribution of the stars (see Sect. 3.2), the observed distortions in the velocity field of the ionized gas are due to the presence of the several star forming regions along the polar disk, which are particularly intense when they are close to the galaxy centre (see right panel in Fig. 1 and top right panel in Fig. 3).
Inside 2 arcsec from the galaxy centre, the velocity dispersion profile shows a steep increase up to a value of about 110 km s-1 (see upper right panel in Fig. 8). In the same range of radii, a hint of a decoupled component is also observed in the velocity curve (see bottom right panel in Fig. 8). However, taking into account that the fit is based on a few pixels and that the error bars are large, we cannot be certain that this feature corresponds to a real component. One possible explanation of the higher velocity dispersion is the presence in the centre of two components that lead to a broadening of the emission line. By looking at the spectra in this region we did not find any sign of a double peak. Thus, by summing two Gaussians convolved with the MUSE resolution, we checked that, if two components exist, they should have a separation in velocity of V ≤ 60 km s-1; otherwise, for larger values a double peak should be observed in the emission line. Alternatively, the existence of an outflow along the line of sight could generate an increasing velocity dispersion of the gas towards the nucleus, and an almost zero velocity, as observed for NGC 4650A. Finally, the same effect could also be due due to chaotic motions of the gas in the nuclear regions.
4. The multicomponent mass model for NGC 4650A
In this section we present the numerical model made to reproduce the observed structure and the 2D kinematics of stars and gas showed by the MUSE data for NGC 4650A.
Photometry and spectroscopy (including new MUSE data) have shown that the light distribution and kinematics are consistent with two almost perpendicular disks where the two main directions of the star rotation are along the equatorial host disk (PA = 67 deg) and along the polar disk (PA = 160 deg). The two components co-exist in the central regions of the galaxy since stars and dust in the polar disk can be traced up to the galaxy centre, following a spiral pattern (see top left panel in Fig. 3).
Even if the morphology of the central HG resembles that of an S0 galaxy (see left panel in Fig. 1), the observed light distribution (Iodice et al. 2002) and the constant velocity dispersion of stars at all radii (as revealed by FORS2 and the current MUSE absorption line spectra) strongly suggested that this component can be considered a puff-up disk, rather than a hot spheroid. The disk nature of the HG is also evident from the high-frequency structure along the equatorial direction found in the residual image shown in the top left panel in Fig. 3.
Based on these observational facts and taking into account that the contribution to the total velocity comes from stars in the HG and in the polar structure, we built a minimum model made of two perpendicular disks. The low value measured for the velocity dispersion of both components further supports this idea.
The model does not include any rotation along the minor axis of the HG, the spiral arms in the polar disk, and a decoupled component in the centre, as well as the misalignment between kinematic and photometric major axis of the HG, also revealed by the MUSE data. This approach allows us to verify whether the minor axis rotation in the HG and/or the decoupled central component are due to the projection of the orbits in the polar disk onto the HG ones. If this is the case, we should also measure these features in the velocity and velocity dispersion fields derived by the model. Alternatively, they are to be considered intrinsic properties of the HG in NGC 4650A.
To derive the velocity field in both equatorial and polar planes, one technique is to build a 3D gravitational potential by combining density models of the host galaxy and the polar disk, and then to search for the symmetric close orbits in both the equatorial and perpendicular planes by shooting test particles (e.g. Sackett & Sparke 1990; Sackett et al. 1994; Combes & Arnaboldi 1996). This procedure is quite long, since particles are launched tangentially on the major axis at each radius of the minor axis, and the launching velocity is adjusted until the closed orbit is found. Instead, we adopt here the epicyclic approximation in each plane (equatorial and polar) to compute the closed orbits in a non-axisymmetric potential (e.g. Binney & Tremaine 1987). Indeed, in their respective planes, the existence of the perpendicular component is equivalent to a weak bar, with zero pattern speed.
In this work, we choose the multicomponent mass model previously developed by Combes & Arnaboldi (1996). This model was proposed in order to revisit the 3D shape of the dark matter halo in NGC 4650A, and they found that the luminous mass closely fitted the kinematics along the major axis of the HG galaxy and the optical rotation curve of the polar disk, while to account for the high polar velocities at large radii given by the HI data, a dark matter halo is required from 8−10 kpc. The main result of this study was on the shape of the dark matter halo: the best fit to data with the least amount of dark matter was obtained with a flattened E6–E7 dark halo, having its major axis aligned along the polar disk major axis.
In this work we adopt the same configuration for NGC 4650A as in the model proposed by Combes & Arnaboldi (1996), i.e. two luminous components HG and a polar disk plus a flattened dark matter halo, with only slight modifications to take into account the extended and deeper photometry in the I and K-bands published by Iodice et al. (2002).
As in Combes & Arnaboldi (1996), according to the light distribution, the central host galaxy can be described as a very small bulge plus a thick disk. The bulge is very light, and its influence might be ignored. It is represented here by a Plummer component, having a characteristic radius rB and a total mass MB. The host disk is represented by a double exponential, with mass Md, characteristic scale rd, and height hd. All the above parameters are given in Table 1.
The stellar and gaseous polar structure are represented by different Miyamoto-Nagai potential-density pairs (Miyamoto & Nagai 1975). Table 1 indicates their masses MPD, their common height h, and their two internal and external radii r1 and r2. The model of the polar disk does not account for the observed spiral arms and for the several star forming regions that strongly perturb this component.
A dark matter halo is added to account for the high velocities in the outer parts. Its density shape is that of a pseudo-isothermal ellipsoid ![\begin{eqnarray*} \rho_{\rm h} = \rho_0 \left[1 + \frac{(R^2 + z^2/q^2)}{r_h^2}\right]^{-1} \end{eqnarray*}](/articles/aa/full_html/2015/11/aa26446-15/aa26446-15-eq85.png) whose characteristic parameters are also listed in Table 1. The values of the central density ρ0 and the halo flattening q were those derived by the dynamical model from Combes & Arnaboldi (1996).
whose characteristic parameters are also listed in Table 1. The values of the central density ρ0 and the halo flattening q were those derived by the dynamical model from Combes & Arnaboldi (1996).
The sum of all these mass components yields a 3D potential in the whole space. In particular, we are interested in the resulting closed orbits in the two planes, equatorial and polar, which have lost their axisymmetry. In each plane, the potential is computed, and decomposed in Fourier components Φ(R,φ) = Φ0(R) + Φm(R)cos(mφ − φm). We consider only the m = 2,4, and 6 components.
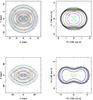 |
Fig. 9 Closed orbit positions (left panels) and velocities (right) for the NGC 4650A host galaxy (top) and polar structure (bottom). |
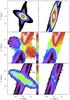 |
Fig. 10 Projection of the model of the stellar (left panels) and ionized gas kinematics (right) for NGC 4650A. The surface density distribution of stars and gas are shown in the upper panels, the projected velocity in the middle panels, and the velocity dispersion in the bottom panels. The colour scales are indicated in km s-1. North is up, east is on the left. |
Following the epicyclic approximation, the closed orbits in a non-axisymmetric potential, such as a weak bar, can be developed in polar coordinates (R,φ) as in Binney & Tremaine (1987) and Schoenmakers et al. (1997):  We take φ = 0 as the long axis of the potential. For the unperturbed circular orbit,
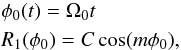 where m is the Fourier component in which the potential has been decomposed,
 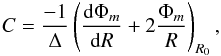 and
and  with κ0 the unperturbed epicyclic frequency.
Masses and scales for the model components.
The expression of the perturbed angle is ![\begin{eqnarray*} \phi_1 = \frac{\sin(m\phi_0)}{m} \left[\frac{2}{\Delta R_0} \left(\frac{{\rm d}\Phi_m}{{\rm d}R} + 2 \frac{\Phi_m}{R}\right) - \frac{\Phi_m}{R_0^2\Omega_0^2} \right]\cdot \end{eqnarray*}](/articles/aa/full_html/2015/11/aa26446-15/aa26446-15-eq108.png) Computing derivatives of these quantities, the velocities in the plane of the closed orbits can be obtained as
Computing derivatives of these quantities, the velocities in the plane of the closed orbits can be obtained as
![\begin{eqnarray*} &&V_R = m V_0 \frac{1}{\Delta R_0} \left(\frac{{\rm d}\Phi_m}{{\rm d}R} + 2 \frac{\Phi_m}{R}\right) \sin(m\phi_0), \\ &&V_{\phi} = V_0 + V_0 \cos(m\phi_0) \left[\frac{1}{\Delta R_0} \left(\frac{{\rm d}\Phi_m}{{\rm d}R} + 2 \frac{\Phi_m}{R}\right) - \frac{\Phi_m}{R_0^2\Omega_0^2} \right]\cdot \end{eqnarray*}](/articles/aa/full_html/2015/11/aa26446-15/aa26446-15-eq109.png) To sum the potential of the various components, we adopt a grid of 480 × 480 in each plane, equatorial and polar. The system of closed orbits found in the equatorial and polar planes are displayed in Fig. 9.
To sum the potential of the various components, we adopt a grid of 480 × 480 in each plane, equatorial and polar. The system of closed orbits found in the equatorial and polar planes are displayed in Fig. 9.
We then undertake to project the two components, host galaxy and polar disk, taking their thickness into account, with the adopted shapes and parameters indicated in Table 1. As for the velocities, we take velocity dispersions of the stars into account, as well as their asymmetric drift, i.e. we adopt for an axisymmetric exponential disk (with scalelength rd) the Jeans equation,  where the dispersion σr and σφ in the radial and tangential directions are related in the epicyclic approximation by
  Since the MUSE data have further confirmed that the velocity dispersion profile along the major axis of the host galaxy is flat with radius (see Fig. 6), we have adopted here the constant value σr = 65 km s-1. For the z dispersion, we simply adopt
  where Σ is the disk surface density.
Since neither the host disk nor the polar disk are exactly edge-on, we projected them between 5° and 15° from edge-on, and the polar disk is not quite perpendicular to the host but inclined by 20° from the pole.
The model was convolved with the seeing and the final result is shown in Fig. 10 and in the bottom left panel in Fig. 3.
The main result of this analysis is that the above model can account for the overall 2D field of the velocity and velocity dispersion derived by the MUSE data (see Figs. 2 and 7). In particular, the line-of-sight velocities of stars and ionized gas obtained by the model show the same pattern and values as those observed in both HG and polar disk. In the region of the central host disk, the velocity dispersion of the stars (see bottom left panel in Fig. 10) is nearly constant at all radii, with comparable values (40 ≤ σ ≤ 70 km s-1) to those observed in the MUSE data (see right panel in Fig. 2).
We noticed some differences between the data and the model. In the region of the polar disk, the velocity dispersion of the stars and the gas derived from the model does not completely match that observed in the data. The model shows a lower stellar velocity dispersion (~30 km s-1, see bottom left panel in Fig. 10) than that observed in the MUSE data (~100−150 km s-1, see right panel in Fig. 2). We noticed an increase in the velocity dispersion of the model only in a restricted region at about 3 kpc (14 arcsec) on the NE and SW sides along the polar disk, where σ ~ 90 km s-1, followed by a steep decrease.
The velocity dispersion of the ionized gas derived from the model shows a gradient (see bottom right panel in Fig. 10). It is higher in the centre (~50 km s-1 for R ≤ 2 kpc ~10 arcsec) and then it decreases at larger radii, where σ ~ 20−40 km s-1 for 2 ≤ R ≤ 10 kpc (~10−50 arcsec). This gradient is not observed in the MUSE data, where the velocity dispersion of the gas along the polar disk is almost constant at all radii and σ ~ 40 km s-1 (see Fig. 7, right panel).
Such differences in the velocity dispersion of stars and gas could arise because the real structure of the polar disk is more complicated than that assumed in the simple geometrical model described above. In particular, one of the dominant features is the presence of the spiral arms, which are not included in the model. Moreover, the data show that the polar disk is characterized by several star forming regions that dominate the emissions along the spiral arms (see Fig. 1). Hence, the outflows from these regions may influence the measured velocity dispersion of the gas. This can explain why in the MUSE data σ has a constant value at ~40 km s-1 at all radii, while in the model it decreases with radius to ~20 km s-1.
Finally, in the nuclear regions (R ≤ 2 arcsec ~ 0.4 kpc), the model does not show the apparent counter-rotation or the high velocity dispersion observed in the gas rotation curve and velocity dispersion profiles (see right panel in Fig. 8). Thus, as suggested in Sect. 3.5, this could be due to the presence of a real decoupled component or to the chaotic motions of the gas in the nuclear regions, also generated by an outflow, and the two features are not included in the model. Alternatively, the observed feature in the nuclear regions could be due to non-axisymmetric distortions generated by the two disks in the two planes. In fact, the model shows that none of the two disks have circular motions, the potential is never axisymmetric in the host disk nor in the polar disk. This non-axisimmetry, combined with a position angle that is not completely perpendicular, leads to non-circular motions that are seen tilted in projection (like an undetected bar misaligned from the major/minor axis).
In the central regions of the HG, the model does not show the increasing velocity along the HG minor axis (see bottom left panel in Fig. 3, as observed in the MUSE data (see top left panel in Fig. 3). Along the NW-SE directions, the systemic velocity contour in the stellar velocity field of the model is parallel to the HG minor axis for R ≤ 2 kpc (~10 arcsec, see middle left panel in Fig. 10). Since the model does not include any rotation along this direction, this could be a real feature in the structure of the HG disk, and it does not result from the geometry of the two disks and its projection on the sky. This confirms the previous results by Coccato et al. (2014). A definitive conclusion on this point will come from the 2D spectral decomposition of the MUSE stellar velocity field, which is the subject of a forthcoming paper.
5. Summary and conclusions
In this paper we presented new MUSE data obtained for the polar disk galaxy NGC 4650A. The 2D velocity distribution of stars and ionized gas is mapped all the way to the galaxy centre where the two components co-exist, overcoming the limited spatial coverage of the long-slit data available for this object. They confirm that NGC 4650A is made of two perpendicular disks that rotate on orthogonal planes, and that drive the kinematics right into the very centre of this galaxy. In the following we summarize the main results obtained by the 2D map of the line-of-sight velocity and velocity dispersion of stars and ionized gas, and we address the main implications on the structure and formation of NGC 4650A.
-
The final MUSE mosaic of NGC 4650A covers an area of 1.5 × 2.5 arcmin (see Fig. 1). The MUSE image of the emission lines (see right panel in Fig. 1) confirms that all the gas is associated with the polar disk. Strong emissions are observed both in the outer arms and close to the centre of the galaxy.
-
Overall, the velocity field of stars inside the HG has the typical pattern of a rotating disk, with receding velocities on the SW side and approaching velocities on the NE side. In addition, we also observed that i) the velocity field is not symmetric with respect to the centre, since the rotation curve is flatter on the SW side, while it is still rising on the NE side (see Fig. 3); and ii) there is a velocity gradient along the photometric minor axis of the HG.
-
The velocity dispersion remains almost constant, at σ ~ 50−60 km s-1, at all distances from the galaxy centre and PAs inside the HG, while it increases along the polar disk, up to σ ~ 100 km s-1 in the outer regions.
-
Inside the HG regions, the photometric and kinematic PA differ by about 5 deg (see Fig. 5), with the photometric PA, PApho = 67 ± 2 deg, is smaller than the kinematic PA
-
The 2D line-of-sight velocity of the ionized gas, which is distributed along the polar disk of NGC 4650A, (Fig. 7, left panel) is mapped up to 75 arcsec (~16 kpc) from the centre. It shows a large amount of differential rotation (of about 100−120 km s-1) from the centre up to the outer regions. On the NW and SE sides of the polar disk, the velocity of the approaching and receding arms is measured, including the regions where they overlap with the underlying disk.
-
The gas velocity dispersion remains almost constant (σgas ~ 30 − 40 km s-1) at all radii (see right panel in Fig. 7), except inside 2 arcsec from the galaxy centre, where we measured a steep increment of σ that reaches a value of about 110 km s-1. In the same range of radii, we also observe a hint of a decoupled component in the velocity curve (see right panel in Fig. 8).
In order to reproduce the observed structure and the new 2D kinematics for NGC 4650A given by the MUSE data, we constructed a multicomponent mass model made by the combined projection of two disks, plus a dark matter halo (see Sect. 4). It is based on the dynamical model developed by Combes & Arnaboldi (1996), where the dark halo is flattened and its major axis is aligned with the polar disk. The structural parameters for the light distribution take the extended and deeper photometry published by Iodice et al. (2002) into account. It is a “minimum” model that does not include the spiral arms in the polar disk, the rotation along the minor axis of the HG and the nuclear decoupled component in the centre.
By comparing the observations with the 2D kinematics derived by the model, we find that the complex velocity field revealed by the MUSE data for NGC 4650A is overall well reproduced by this simple model, also in the central regions of the galaxy, where the two components coexist (see Fig. 10).
This result is a strong constraint on the dynamics and formation history of the polar disk, in particular on the nature of the dark matter. In the framework of disk galaxy formation, an extended and massive polar disk like that observed in NGC 4650A can form through the accretion of cold gas along a filament. In this scenario, the central HG is disk that formed first. The decoupling of the angular momentum at a certain epoch of the formation history moved the accretion of gas in the orthogonal direction, forming the polar disk (Snaith et al. 2012; Combes 2014). Alternatively, a polar disk could also form from the tidal accretion of material from a gas-rich companion galaxy. Both mechanisms were successfully tested for NGC 4650A (Spavone et al. 2010).
The analysis performed in this work shows that a mass model made by the two perpendicular disks reproduce well the observed structure and kinematics of NGC 4650A, which result from one of the accretion mechanism described above. Since the mass model includes a flattened dark halo, having its major axis aligned with the polar disk, this suggests that if the polar disk is formed through the accretion of material from outside, dissipative dark matter might to be essential.
Some differences are noted between the observed and modelled kinematics. They are the rotation velocity along the minor axis of the HG, the high stellar velocity dispersion in the polar disk, and a possible decoupled component in the galaxy centre, which are detected in the data but not in the model.
They do not affect the main conclusion discussed above, since they are limited to regions that are not dynamically important for the whole model. In fact, inside the HG, the minor axis rotation is for R ≤ 5 arcsec (~1 kpc), which are only about 15% of the measured kinematics along the major axis, and which are fully reproduced by the model.
In the polar disk, we measured an increasing velocity dispersion of stars, for 5 ≤ R ≤ 10 arcsec (~1−2 kpc), out to about 110 km s-1 (see right panel in Fig. 2), and a difference in the velocity dispersion of the gas of about 20 km s-1 at 16 kpc (see right panel in Fig. 7 and right bottom panel in Fig. 4). Along the polar disk, the dynamics is strongly constrained by the high velocities (~120 km s-1) of the HI gas at 40 kpc from the centre.
As pointed out in Sect. 4, such differences in both stellar and gaseous velocity dispersion could be a consequence of the perturbed structure of the polar disk, which are not taken into account by the simple model made in this work. The differences in the measured velocity dispersion of the gas with respect to that derived from the model could be due to the outflows from the several star forming regions that dominate the emissions along the spiral arms. On the other hand, the higher velocity dispersion of the stars in the outer regions of the polar disk and the counter-rotation in the centre of the polar disk, if the latter is a real decoupled component, could be the result of the angular momentum evolution of the accreted material during the formation process.
Kinemetry is a generalization of photometry to the higher moments of the line-of-sight velocity distribution (Krajnović et al. 2006).
The velocities derived by the H i inside 4 kpc from the centre are affected by large errors (see Iodice et al. 2008), thus values can be compared with velocities from the MUSE ionized gas only in the range 4 ≤ R ≤ 16 kpc.
Acknowledgments
This work is based on observations taken at the ESO La Silla Paranal Observatory within the MUSE Commissioning. The authors wish to thank the anonymous referee for his/her comments and suggestions that allowed us to greatly improve the paper. E.I. wishes to thank the European Southern Observatory for the financial support, the hospitality and the access to the computer facilities during the several visits in 2014 and 2015 that allowed us to perform the fundamental steps of the work presented in this paper. F.C. acknowledges the European Research Council for the Advanced Grant Program Num 267399-Momentum. P.M.W. received funding through BMBF Verbundforschung (project MUSE-AO, grant 05A14BAC and 05A14MGA). R.B. acknowledges support from the ERC advanced grant 339659-MUSICOS.
References
- Arnaboldi, M. 2014, in Multi-Spin Galaxies, eds. E. Iodice, & E. M. Corsini, ASP Conf. Ser., 486, 161 [Google Scholar]
- Arnaboldi, M., Oosterloo, T., Combes, F., Freeman, K. C., & Koribalski, B. 1997, AJ, 113, 585 [Google Scholar]
- Bacon, R., Accardo, M., Adjali, L., et al. 2010, in SPIE Conf. Ser., 7735, 8 [Google Scholar]
- Binney, J., & Tremaine, S. 1987, Galactic dynamics, 747 [Google Scholar]
- Cappellari, M., & Copin, Y. 2003, MNRAS, 342, 345 [NASA ADS] [CrossRef] [Google Scholar]
- Cappellari, M., & Emsellem, E. 2004, PASP, 116, 138 [NASA ADS] [CrossRef] [Google Scholar]
- Coccato, L., Iodice, E., & Arnaboldi, M. 2014, A&A, 569, A83 [NASA ADS] [CrossRef] [EDP Sciences] [Google Scholar]
- Combes, F. 2014, in Multi-Spin Galaxies, eds. E. Iodice, & E. M. Corsini, ASP Conf. Ser. 486, 207 [Google Scholar]
- Combes, F., & Arnaboldi, M. 1996, A&A, 305, 763 [NASA ADS] [Google Scholar]
- Conselice, C. J. 2014, in Multi-Spin Galaxies, eds. E. Iodice, & E. M. Corsini, ASP Conf. Ser., 486, 85 [Google Scholar]
- Freudling, W., Romaniello, M., Bramich, D. M., et al. 2013, A&A, 559, A96 [NASA ADS] [CrossRef] [EDP Sciences] [Google Scholar]
- Gallagher, J. S., Sparke, L. S., Matthews, L. D., et al. 2002, ApJ, 568, 199 [NASA ADS] [CrossRef] [Google Scholar]
- Iodice, E. 2014, in ASP Conf. Ser. 486, eds. E. Iodice, & E. M. Corsini, 39 [Google Scholar]
- Iodice, E., Arnaboldi, M., De Lucia, G., et al. 2002, AJ, 123, 195 [NASA ADS] [CrossRef] [Google Scholar]
- Iodice, E., Arnaboldi, M., Saglia, R. P., et al. 2006, ApJ, 643, 200 [NASA ADS] [CrossRef] [Google Scholar]
- Iodice, E., Arnaboldi, M., Napolitano, N. R., Oosterloo, T. A., & Józsa, G. I. G. 2008, in Formation and Evolution of Galaxy Disks, eds. J. G. Funes, & E. M. Corsini, ASP Conf. Ser, 396, 483 [Google Scholar]
- Krajnović, D., Cappellari, M., de Zeeuw, P. T., & Copin, Y. 2006, MNRAS, 366, 787 [NASA ADS] [CrossRef] [Google Scholar]
- Miyamoto, M., & Nagai, R. 1975, PASJ, 27, 533 [NASA ADS] [Google Scholar]
- Napolitano, N. R., Iodice, E., & Arnaboldi, M. 2014, in Multi-Spin Galaxies, eds. E. Iodice, & E. M. Corsini, ASP Conf. Ser., 486, 217 [Google Scholar]
- Rubin, V. C. 1994, AJ, 108, 456 [NASA ADS] [CrossRef] [Google Scholar]
- Sackett, P. D., & Sparke, L. S. 1990, ApJ, 361, 408 [NASA ADS] [CrossRef] [Google Scholar]
- Sackett, P. D., Rix, H.-W., Jarvis, B. J., & Freeman, K. C. 1994, ApJ, 436, 629 [NASA ADS] [CrossRef] [Google Scholar]
- Sarzi, M., Falcón-Barroso, J., Davies, R. L., et al. 2006, MNRAS, 366, 1151 [NASA ADS] [CrossRef] [Google Scholar]
- Schoenmakers, R. H. M., Franx, M., & de Zeeuw, P. T. 1997, MNRAS, 292, 349 [NASA ADS] [CrossRef] [Google Scholar]
- Snaith, O. N., Gibson, B. K., Brook, C. B., et al. 2012, MNRAS, 425, 1967 [NASA ADS] [CrossRef] [Google Scholar]
- Spavone, M., Iodice, E., Arnaboldi, M., et al. 2010, ApJ, 714, 1081 [NASA ADS] [CrossRef] [Google Scholar]
- Swaters, R. A., & Rubin, V. C. 2003, ApJ, 587, L23 [NASA ADS] [CrossRef] [Google Scholar]
- Vazdekis, A., Ricciardelli, E., Cenarro, A. J., et al. 2012, MNRAS, 424, 157 [NASA ADS] [CrossRef] [Google Scholar]
- Weilbacher, P. M., Streicher, O., Urrutia, T., et al. 2014, in Astronomical Data Analysis Softward and Systems XXIII, eds. N. Manset, & P. Forshay, ASP Conf. Ser., 486, 451 [Google Scholar]
All Tables
All Figures
|
Fig. 1 Left panel: MUSE mosaic of NGC 4650A in the SDSS r-band. The mosaic covers an area of 1.5′ × 2.5′. The X-axis is the right ascension (h min s) and the Y-axis is the declination (in degrees). Dashed boxes indicate the single MUSE pointings. Dashed and dotted arcs trace the structure of the spiral arms (see text). Right panel: Hα emission from MUSE data. North is up and east is on the left. |
| In the text | |
|
Fig. 2 Map of the line-of-sight rotation velocity (left panel) and velocity dispersion (right panel) of stars in NGC 4650A. The cross marks the centre of the galaxy where the systemic velocity is V = 2875 ± 3 km s-1 and velocity dispersion is σ = 60 ± 6 km s-1. |
| In the text | |
|
Fig. 3 Top left panel: enlarged image of the 2D map of the line-of-sight velocity of stars in the region of the HG. The iso-velocity contours are overlaid on the image, the minimum and maximum values are 2785 km s-1 and 2960 km s-1, with a step of about 6 km s-1. The cross marks the centre of the galaxy where the systemic velocity is V = 2875 ± 3 km s-1. The dashed lines indicate the photometric major and minor axes of the HG. Top right panel: high-frequency residual image obtained by the ratio of the original reduced r-band MUSE image with a smoothed one, where each original pixel value is replaced with the median value in a rectangular window of 25 × 25 pixels. Bottom left panel: enlarged image of the 2D map of the velocity field derived by the model. The dashed line indicates the direction of the HG minor axis PA = 157°. The iso-velocity contours are overlaid on the image, the minimum and maximum values are −145 km s-1 and 145 km s-1, with a step of about 13 km s-1. See Sect. 4 for details. Bottom right panel: enlarged image of the 2D map of the line-of-sight velocity of gas in the regions close to centre of the galaxy. The iso-velocity contours are overlaid on the image, the minimum and maximum values are 2800 km s-1 and 2920 km s-1, with a step of about 6 km s-1. In all images the cross marks the centre of the galaxy and north is up, east on the left. |
| In the text | |
|
Fig. 4 Folded line-of-sight velocity profiles of stars (left panel) and surface brightness profiles (right panel) along the HG photometric major axis (PA = 67 ± 2 deg) from the MUSE data. |
| In the text | |
|
Fig. 5 Kinematic (blue points) and photometric (black points) PA profiles. The straight lines (blue and black) indicate the average values of the two PAs in the range of radii inside the regions of the HG that are not perturbed by the polar disk (4 ≤ R ≤ 12 arcsec). |
| In the text | |
|
Fig. 6 Stellar kinematics along the major axis (left panel) and minor axis (right panel) of the HG in NGC 4650A derived by MUSE data (black points) in the Mgb wavelength region compared with the profiles obtained by Sackett et al. (1994), blue points, in the same region, and longslit spectra by Iodice et al. (2006), red points, in the CaT wavelength region. |
| In the text | |
|
Fig. 7 Maps of the line-of-sight velocity (left panel) and velocity dispersion (right panel) of the gas in NGC 4650A. The cross marks the centre of the galaxy where rotation is V = 2880 ± 19 km s-1 and velocity dispersion is σ = 100 ± 20 km s-1. In the left panel, the dashed and dotted arcs trace the structure of the spiral arms, as in Fig. 1. |
| In the text | |
|
Fig. 8 Left panel: line-of-sight velocity (bottom panel) and velocity dispersion (upper panel) of the gas along the polar disk major axis, PA = 160°. Right panel: zoom of the gas rotation (bottom) and dispersion (upper) curves towards the centre of the galaxy. |
| In the text | |
|
Fig. 9 Closed orbit positions (left panels) and velocities (right) for the NGC 4650A host galaxy (top) and polar structure (bottom). |
| In the text | |
|
Fig. 10 Projection of the model of the stellar (left panels) and ionized gas kinematics (right) for NGC 4650A. The surface density distribution of stars and gas are shown in the upper panels, the projected velocity in the middle panels, and the velocity dispersion in the bottom panels. The colour scales are indicated in km s-1. North is up, east is on the left. |
| In the text | |
Current usage metrics show cumulative count of Article Views (full-text article views including HTML views, PDF and ePub downloads, according to the available data) and Abstracts Views on Vision4Press platform.
Data correspond to usage on the plateform after 2015. The current usage metrics is available 48-96 hours after online publication and is updated daily on week days.
Initial download of the metrics may take a while.