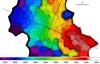
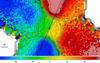
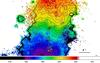
Fig. 3
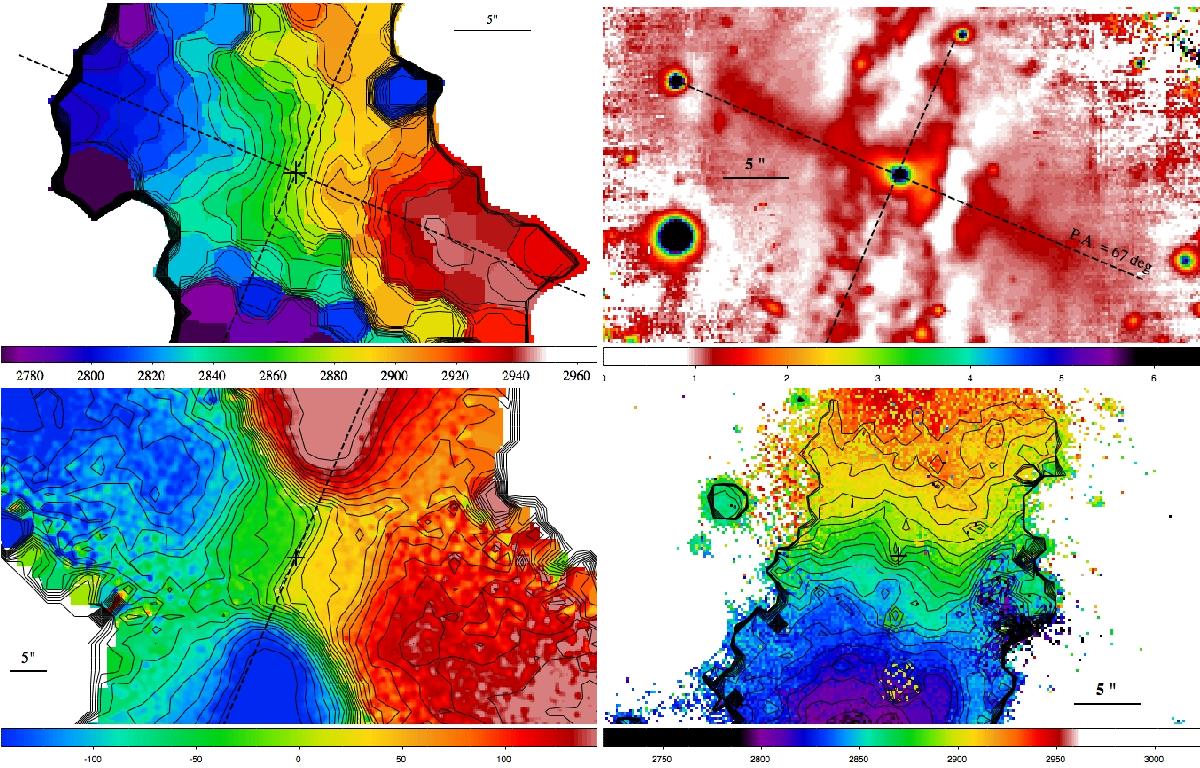
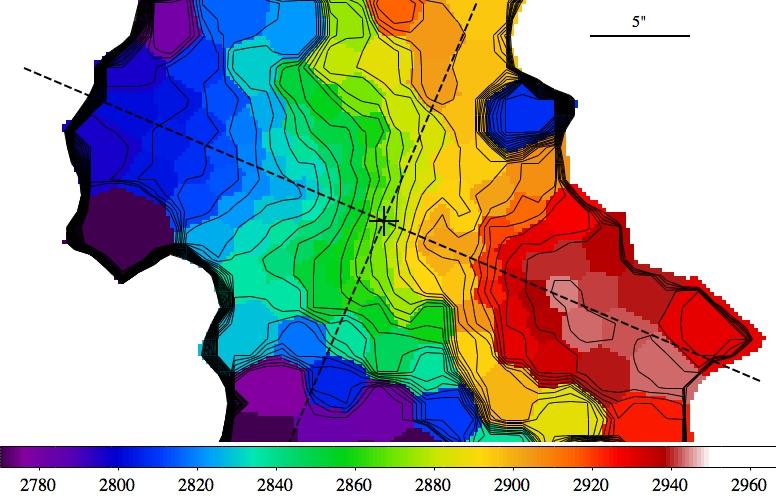
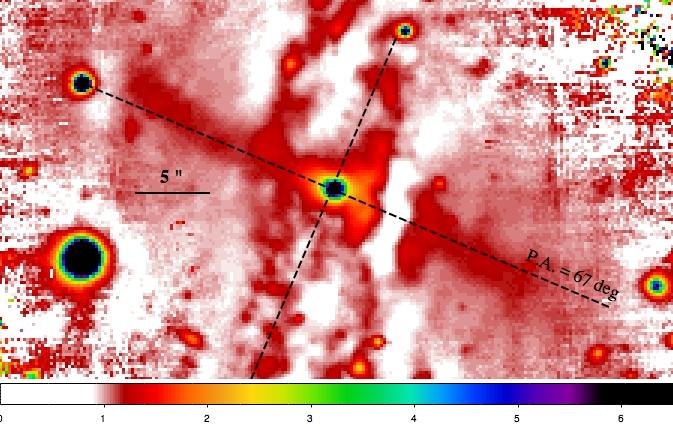
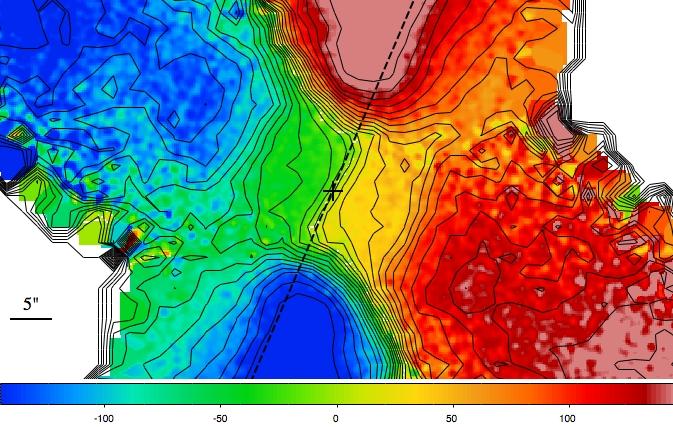
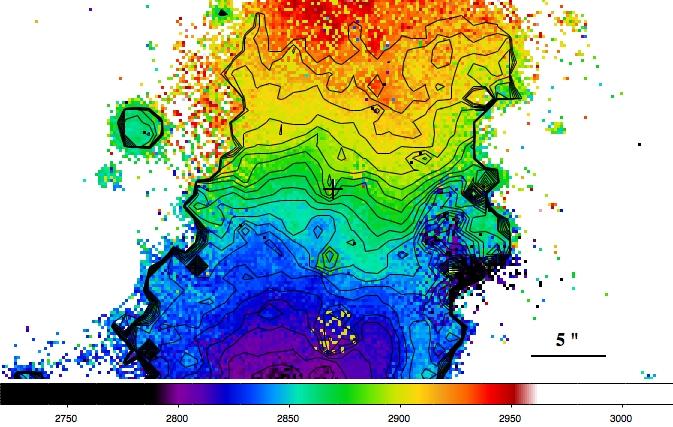
Top left panel: enlarged image of the 2D map of the line-of-sight velocity of stars in the region of the HG. The iso-velocity contours are overlaid on the image, the minimum and maximum values are 2785 km s-1 and 2960 km s-1, with a step of about 6 km s-1. The cross marks the centre of the galaxy where the systemic velocity is V = 2875 ± 3 km s-1. The dashed lines indicate the photometric major and minor axes of the HG. Top right panel: high-frequency residual image obtained by the ratio of the original reduced r-band MUSE image with a smoothed one, where each original pixel value is replaced with the median value in a rectangular window of 25 × 25 pixels. Bottom left panel: enlarged image of the 2D map of the velocity field derived by the model. The dashed line indicates the direction of the HG minor axis PA = 157°. The iso-velocity contours are overlaid on the image, the minimum and maximum values are −145 km s-1 and 145 km s-1, with a step of about 13 km s-1. See Sect. 4 for details. Bottom right panel: enlarged image of the 2D map of the line-of-sight velocity of gas in the regions close to centre of the galaxy. The iso-velocity contours are overlaid on the image, the minimum and maximum values are 2800 km s-1 and 2920 km s-1, with a step of about 6 km s-1. In all images the cross marks the centre of the galaxy and north is up, east on the left.

Current usage metrics show cumulative count of Article Views (full-text article views including HTML views, PDF and ePub downloads, according to the available data) and Abstracts Views on Vision4Press platform.
Data correspond to usage on the plateform after 2015. The current usage metrics is available 48-96 hours after online publication and is updated daily on week days.
Initial download of the metrics may take a while.