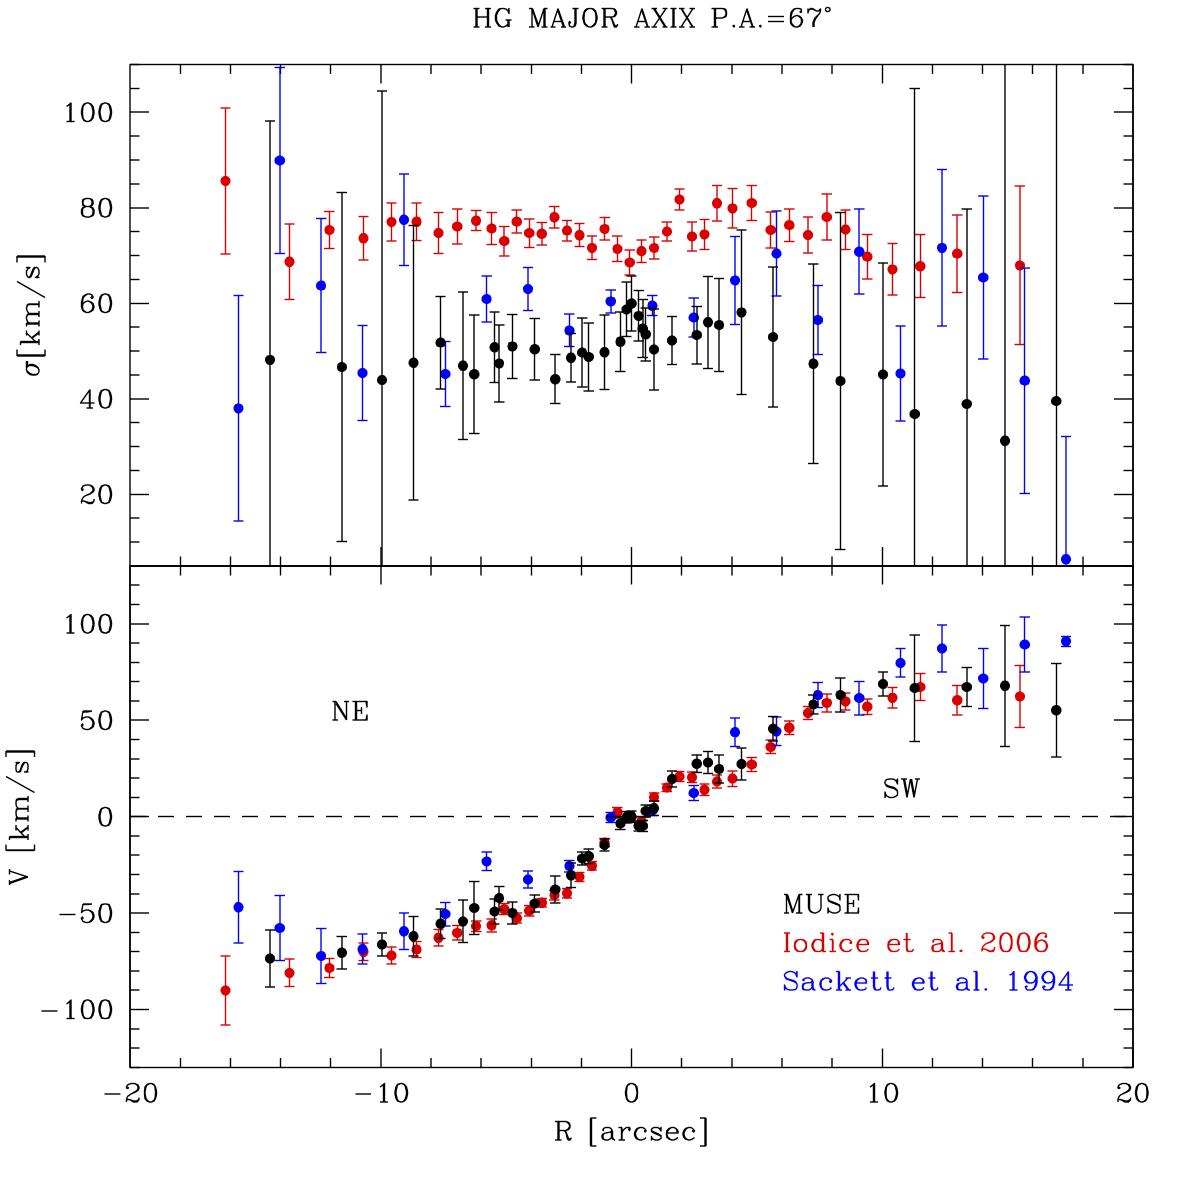
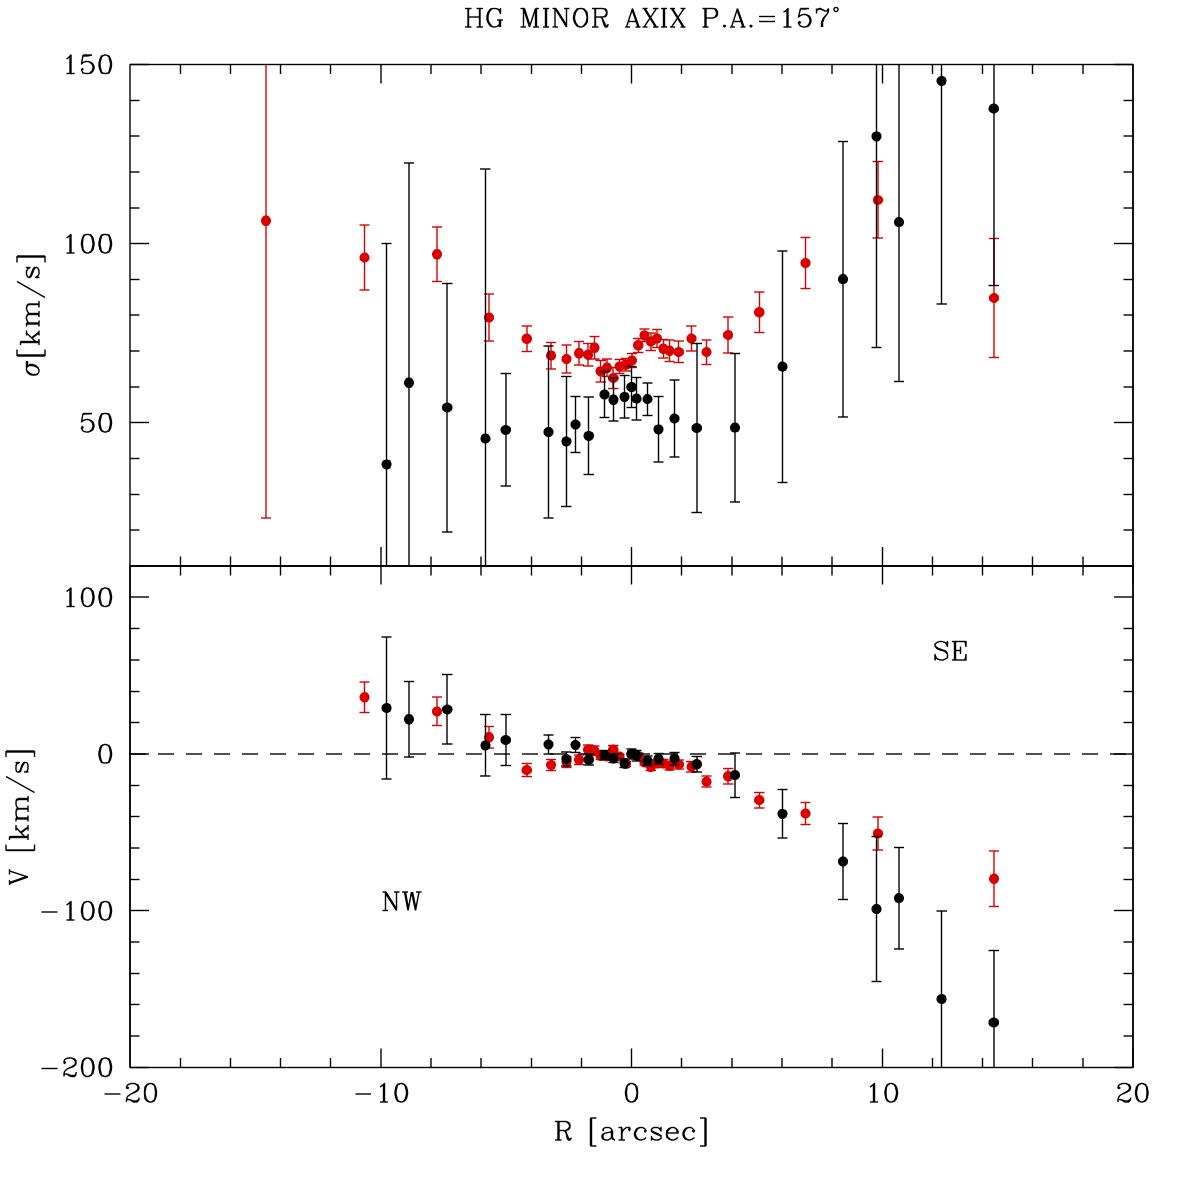
Fig. 6
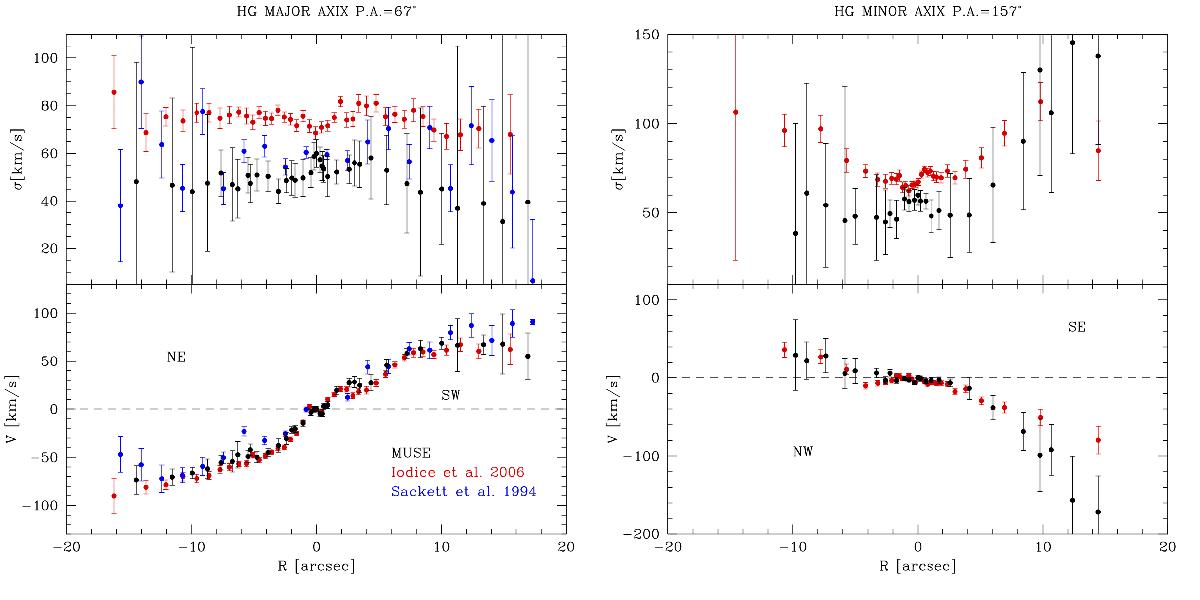
Stellar kinematics along the major axis (left panel) and minor axis (right panel) of the HG in NGC 4650A derived by MUSE data (black points) in the Mgb wavelength region compared with the profiles obtained by Sackett et al. (1994), blue points, in the same region, and longslit spectra by Iodice et al. (2006), red points, in the CaT wavelength region.
Current usage metrics show cumulative count of Article Views (full-text article views including HTML views, PDF and ePub downloads, according to the available data) and Abstracts Views on Vision4Press platform.
Data correspond to usage on the plateform after 2015. The current usage metrics is available 48-96 hours after online publication and is updated daily on week days.
Initial download of the metrics may take a while.