Fig. 1
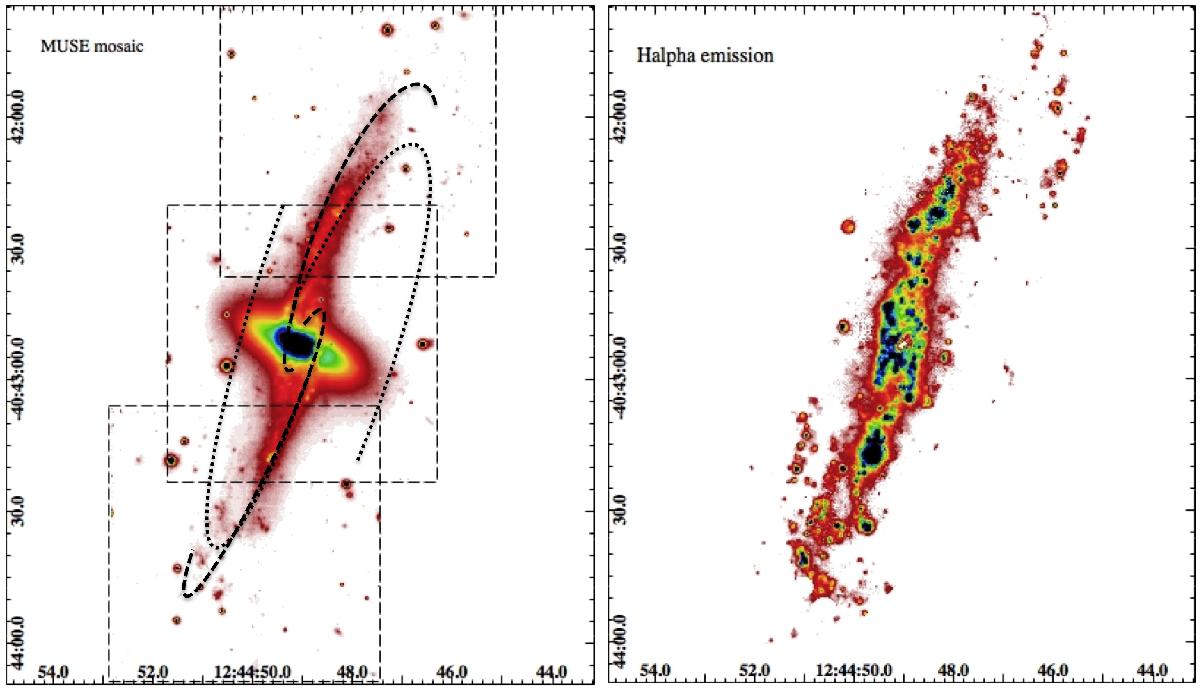
Left panel: MUSE mosaic of NGC 4650A in the SDSS r-band. The mosaic covers an area of 1.5′ × 2.5′. The X-axis is the right ascension (h min s) and the Y-axis is the declination (in degrees). Dashed boxes indicate the single MUSE pointings. Dashed and dotted arcs trace the structure of the spiral arms (see text). Right panel: Hα emission from MUSE data. North is up and east is on the left.
Current usage metrics show cumulative count of Article Views (full-text article views including HTML views, PDF and ePub downloads, according to the available data) and Abstracts Views on Vision4Press platform.
Data correspond to usage on the plateform after 2015. The current usage metrics is available 48-96 hours after online publication and is updated daily on week days.
Initial download of the metrics may take a while.