Fig. 10
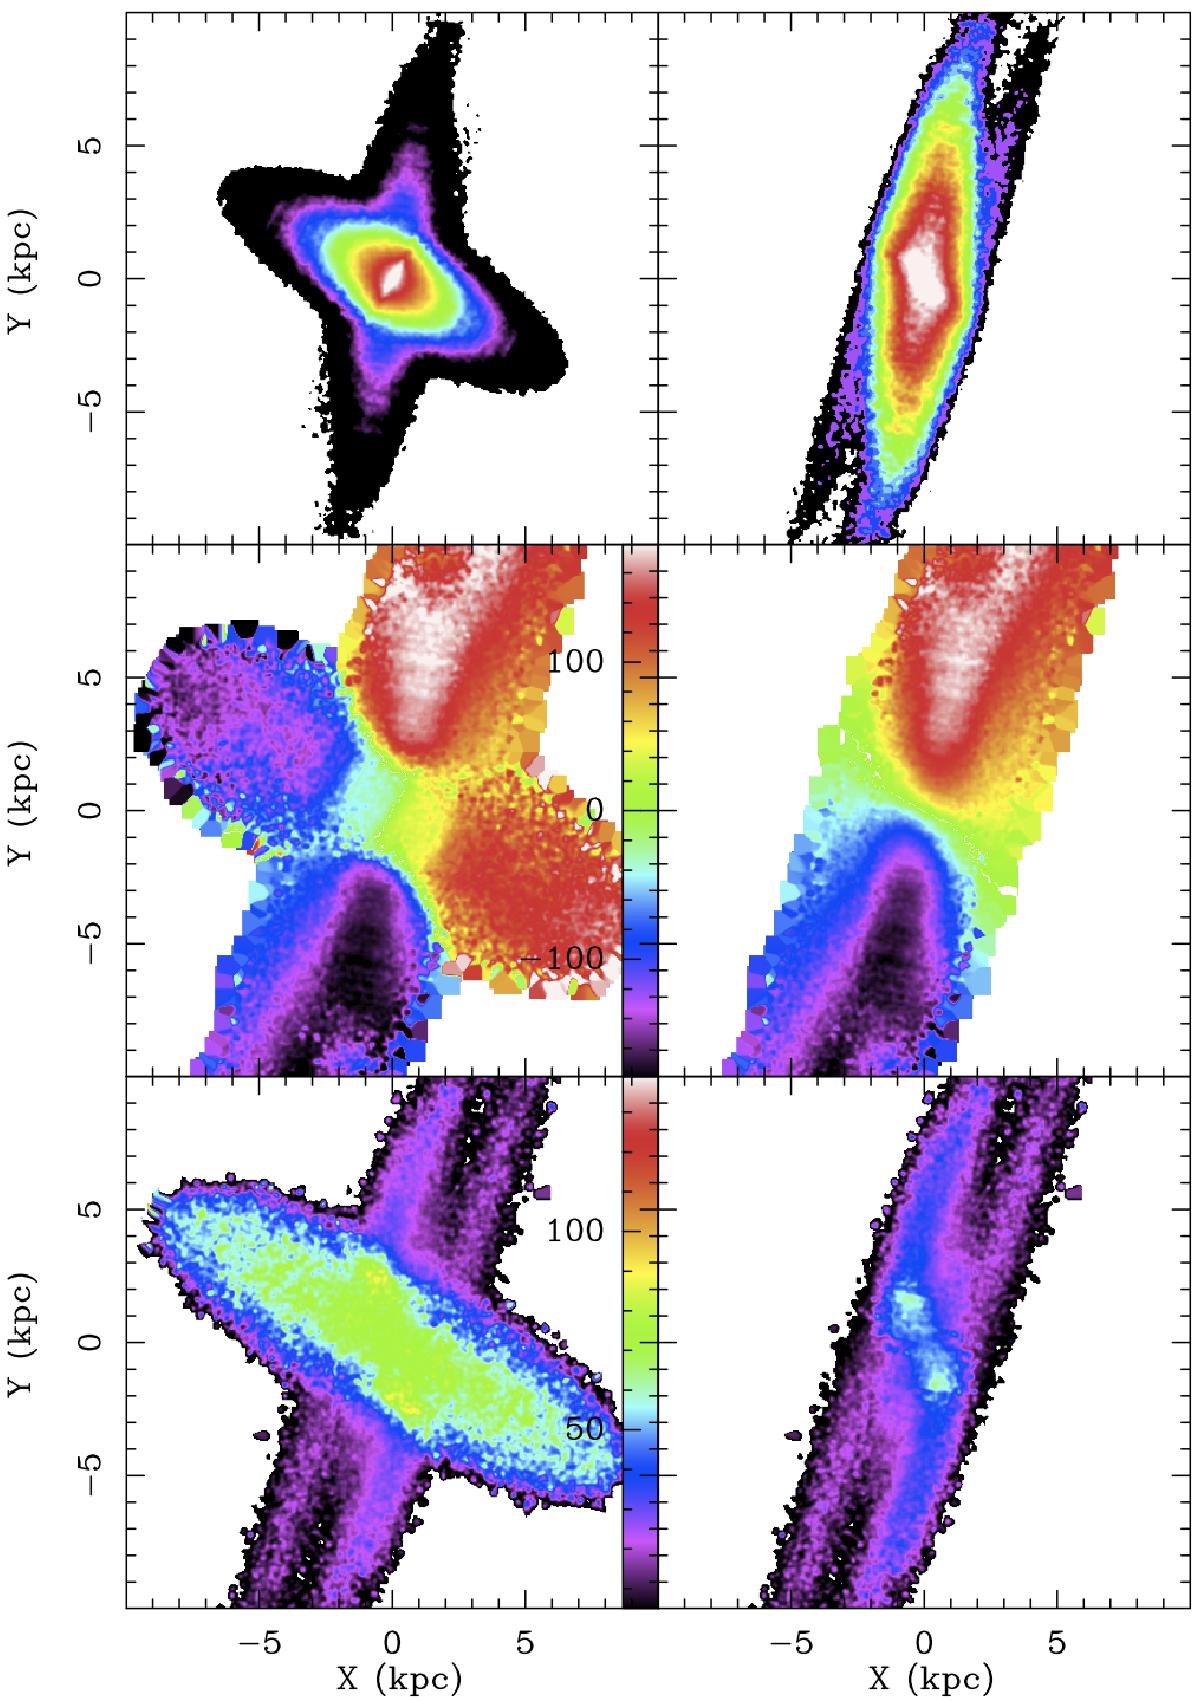
Projection of the model of the stellar (left panels) and ionized gas kinematics (right) for NGC 4650A. The surface density distribution of stars and gas are shown in the upper panels, the projected velocity in the middle panels, and the velocity dispersion in the bottom panels. The colour scales are indicated in km s-1. North is up, east is on the left.
Current usage metrics show cumulative count of Article Views (full-text article views including HTML views, PDF and ePub downloads, according to the available data) and Abstracts Views on Vision4Press platform.
Data correspond to usage on the plateform after 2015. The current usage metrics is available 48-96 hours after online publication and is updated daily on week days.
Initial download of the metrics may take a while.