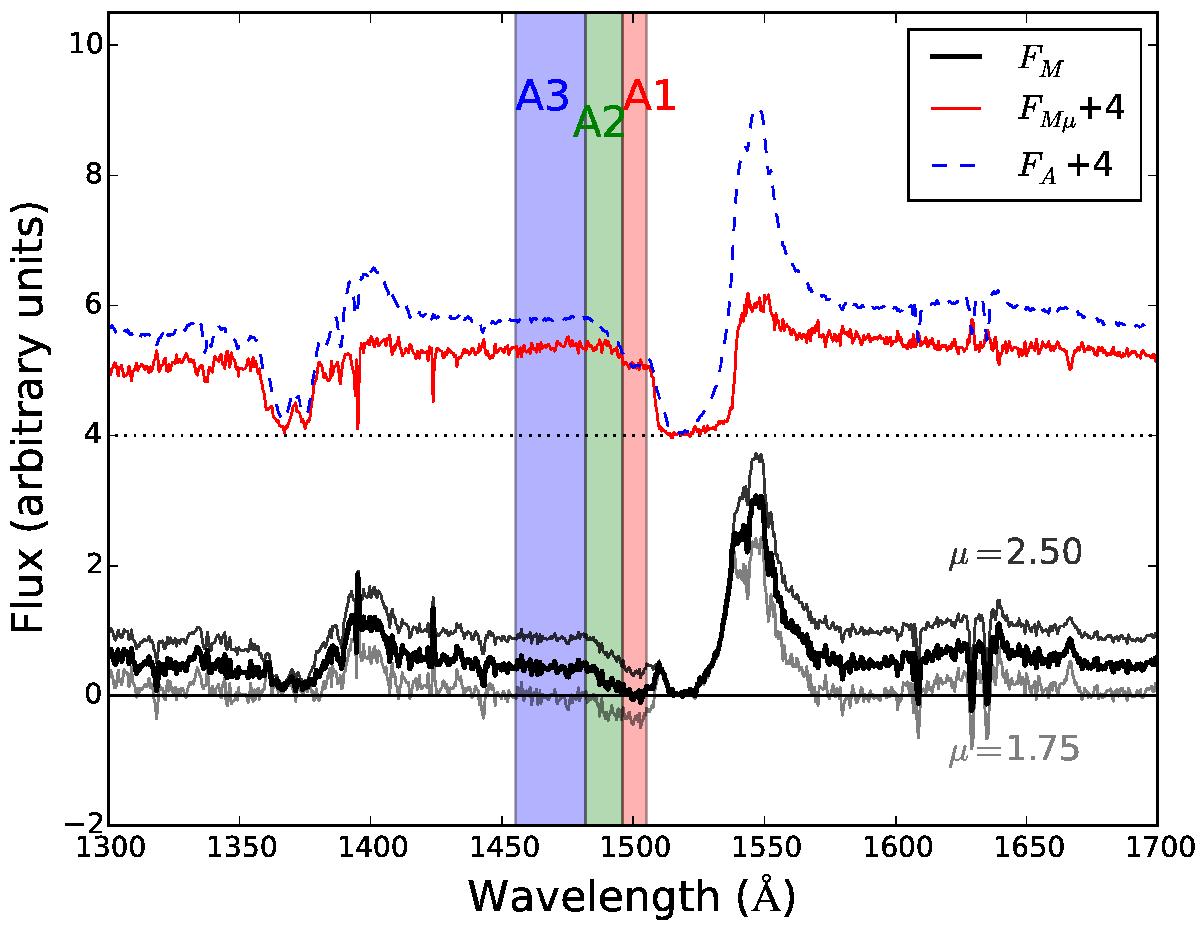
Fig. 2

MmD performed on images A and D of H1413+117 in 2011, using M = 0.4 (Sect. 3.3). The dashed blue line is the flux of image A. The thick black line is the fraction of the flux FM unaffected by microlensing for μ = 2.0. The red line is the corresponding microlensed fraction of the flux FMμ (shifted up to ease legibility), the dotted horizontal line is the line corresponding to FMμ = 0. The gray lines show the decomposition for two other values of μ (see Sect. 3.2). The three shaded areas correspond to the three regions A1 − A3 as discussed in the text.
Current usage metrics show cumulative count of Article Views (full-text article views including HTML views, PDF and ePub downloads, according to the available data) and Abstracts Views on Vision4Press platform.
Data correspond to usage on the plateform after 2015. The current usage metrics is available 48-96 hours after online publication and is updated daily on week days.
Initial download of the metrics may take a while.


