Fig. 1
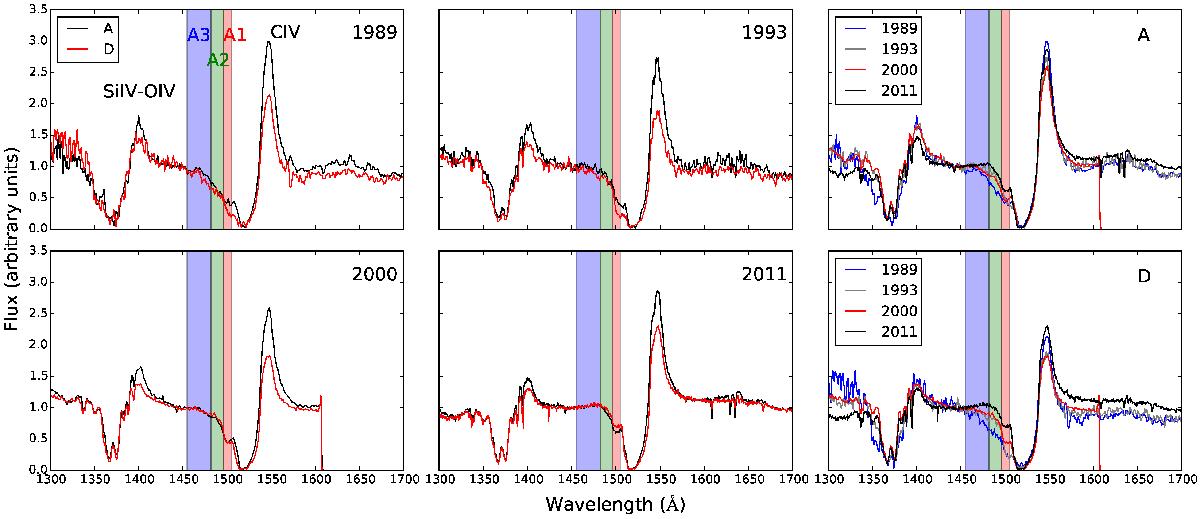
Spectra of images A (black) and D (red) in the spectral range 1300–1700 Å, covering the Si iv-C iv lines. The left and middle panels show the spectra as observed in 1989, 1993, 2000, and 2011, after normalization to unity in the continuum. The three shaded areas correspond to regions where the absorption changed significantly over the past 20 years, as discussed in Sect. 3.2. The top and bottom right panels show the change of intrinsic absorption over time for images A and D.
Current usage metrics show cumulative count of Article Views (full-text article views including HTML views, PDF and ePub downloads, according to the available data) and Abstracts Views on Vision4Press platform.
Data correspond to usage on the plateform after 2015. The current usage metrics is available 48-96 hours after online publication and is updated daily on week days.
Initial download of the metrics may take a while.