| Issue |
A&A
Volume 582, October 2015
|
|
|---|---|---|
| Article Number | A78 | |
| Number of page(s) | 14 | |
| Section | Extragalactic astronomy | |
| DOI | https://doi.org/10.1051/0004-6361/201526542 | |
| Published online | 12 October 2015 | |
Massive stars formed in atomic hydrogen reservoirs: H I observations of gamma-ray burst host galaxies
1 SUPA (Scottish Universities Physics Alliance), Institute for Astronomy, University of Edinburgh, Royal Observatory, Blackford Hill, Edinburgh, EH9 3HJ, UK
e-mail: This email address is being protected from spambots. You need JavaScript enabled to view it.
2 Sterrenkundig Observatorium, Universiteit Gent, Krijgslaan 281-S9, 9000 Gent, Belgium
3 Department of Physics and Astrophysics, Vrije Universiteit Brussel, Pleinlaan 2, 1050 Brussels, Belgium
4 Dark Cosmology Centre, Niels Bohr Institute, University of Copenhagen, Juliane Maries Vej 30, 2100 Copenhagen Ø, Denmark
5 Department of Astronomy and Astrophysics, University of California, Santa Cruz, CA 95064, USA
6 Department of Physics and Astronomy, University of Leicester, University Road, Leicester, LE1 7RH, UK
7 CSIRO Astronomy & Space Science, Australia Telescope National Facility, PO Box 76, Epping, NSW 1710, Australia
8 Sydney Institute for Astronomy, School of Physics, The University of Sydney, NSW 2006, Australia
9 Aix Marseille Université, CNRS, LAM (Laboratoire d’Astrophysique de Marseille) UMR 7326, 13388 Marseille, France
10 Max-Planck-Institut für Extraterrestrische Physik, Giessenbachstraße, 85748 Garching bei München, Germany
11 ISDEFE for the Herschel Science Centre (ESA-ESAC), 28692 Villanueva de la Cañada, Madrid, Spain
12 ASI-Science Data Center, via del Politecnico snc, 00133 Rome, Italy
13 INAF–Osservatorio Astronomico di Roma, via di Frascati, 33, 00040 Monteporzio Catone, Italy
14 INAF–Osservatorio Astrofisico di Arcetri, Largo E. Fermi 5, 50125 Firenze, Italy
15 Thüringer Landessternwarte Tautenburg, Sternwarte 5, 07778 Tautenburg, Germany
16 Laboratoire AIM-Paris-Saclay, CEA/DSM/Irfu − CNRS − Université Paris Diderot, CE-Saclay, pt courrier 131, 91191 Gif-sur-Yvette, France
17 INAF-IASF Bologna, via Gobetti 101, 40129 Bologna, Italy
18 Technical University of Denmark, Department of Physics, Fysikvej, Building 309, 2800 Kgs. Lyngby, Denmark
19 Physics Department, University of Calabria, via P. Bucci, 87036 Arcavacata di Rende, Italy
20 European Southern Observatory, Karl-Schwarzschild-Str. 2, 85748 Garching bei München, Germany
21 The Oskar Klein Centre, Department of Astronomy, AlbaNova, Stockholm University, 106 91 Stockholm, Sweden
22 Instituto de Astrofísica de Andalucía (IAA-CSIC), Glorieta de la Astronomía s/n, 18008 Granada, Spain
23 Leiden Observatory, Leiden University, PO Box 9513, 2300 RA Leiden, The Netherlands
24 GEPI-Observatoire de Paris Meudon. 5 place Jules Jannsen, 92195 Meudon, France
25 INAF/Osservatorio Astronomico di Brera, via Emilio Bianchi 46, 23807 Merate (LC), Italy
Received: 17 May 2015
Accepted: 7 August 2015
Abstract
Long gamma-ray bursts (GRBs), among the most energetic events in the Universe, are explosions of massive and short-lived stars, so they pinpoint locations of recent star formation. However, several GRB host galaxies have recently been found to be deficient in molecular gas (H2), believed to be the fuel of star formation. Moreover, optical spectroscopy of GRB afterglows implies that the molecular phase constitutes only a small fraction of the gas along the GRB line of sight. Here we report the first ever 21 cm line observations of GRB host galaxies, using the AustraliaTelescope Compact Array, implying high levels of atomic hydrogen (H i), which suggests that the connection between atomic gas and star formation is stronger than previously thought. In this case, it is possible that star formation is directly fuelled by atomic gas (or that the H i-to-H2 conversion is very efficient, which rapidly exhaust molecular gas), as has been theoretically shown to be possible. This can happen in low-metallicity gas near the onset of star formation because cooling of gas (necessary for star formation) is faster than the H i-to-H2 conversion. Indeed, large atomic gas reservoirs, together with low molecular gas masses, stellar, and dust masses are consistent with GRB hosts being preferentially galaxies which have very recently started a star formation episode after accreting metal-poor gas from the intergalactic medium. This provides a natural route for forming GRBs in low-metallicity environments. The gas inflow scenario is also consistent with the existence of the companion H I object with no optical counterpart ~19 kpc from the GRB 060505 host, and with the fact that the H I centroids of the GRB 980425 and 060505 hosts do not coincide with optical centres of these galaxies, but are located close to the GRB positions.
Key words: dust, extinction / galaxies: ISM / galaxies: star formation / gamma-ray burst: general / radio continuum: galaxies / radio lines: galaxies
© ESO, 2015
1. Introduction
Long (duration >2 s) gamma-ray bursts (GRBs) have been shown to be related to the collapse of massive stars (e.g. Hjorth et al. 2003; Stanek et al. 2003). Because of the very short main-sequence lifetime of such stars, GRBs are expected to trace galaxies with ongoing star formation. Whether GRBs and their hosts can be used as an unbiased tool to trace star formation in the Universe (Yüksel et al. 2008; Kistler et al. 2009; Butler et al. 2010; Elliott et al. 2012; Robertson & Ellis 2012) is still a subject of debate. Some results suggest that GRB hosts are consistent with the general population of galaxies (Michałowski et al. 2012b; Hunt et al. 2014a; Schady et al. 2014; Greiner et al. 2015; Kohn et al. 2015), but some biases, especially in stellar masses have been found at lower redshifts (Perley et al. 2013, 2015b,a,c; Boissier et al. 2013; Vergani et al. 2015; Schulze et al. 2015).
In order to establish the link between GRBs and star formation it is necessary to understand the properties of the gas content in the GRB hosts, which is the fuel of star formation. The neutral hydrogen in the interstellar gas of host galaxies has been routinely detected in absorption in the spectra of GRB afterglows. In this case, the detected column density probes the portion of the neutral gas in the host galaxy which is distributed in one sight line in front of the GRB. An H I column density larger than 1020 cm-2 (a damped Lyman α− DLA) is measured in more than 70 GRB spectra. It was clear early on (Berger et al. 2006; Fynbo et al. 2006; Savaglio 2006; Prochaska et al. 2007a,b; Watson et al. 2007) that these absorbers were on average stronger than what is typically seen in quasar spectra, also probing the neutral gas in high-z galaxies. It was suggested that this is because GRBs happen inside star-forming regions of their host galaxies, where the gas density is higher than in a galaxy halo (Fynbo et al. 2008; Pontzen et al. 2010). The halo contains most of the galaxies’ volume, so a sight line towards a distant quasar is likely to intercept it, rather than a dense star-forming region. The other important difference with high-z quasar-DLAs is a higher average metallicity (Prochaska & Wolfe 2009; Savaglio et al. 2012).
Molecular hydrogen was also detected in absorption in a few GRB afterglow spectra. These data suggest low molecular hydrogen content for GRB hosts, as the measured molecular gas column density fractions (2N(H2)/(2N(H2) + N(H i)) are lower than 10-4 (Vreeswijk et al. 2004; Fynbo et al. 2006; Tumlinson et al. 2007; D’Elia et al. 2010, 2014) and are at most a few percent (Prochaska et al. 2009; Krühler et al. 2013; Friis et al. 2015).
Properties of our sample of GRB hosts.
ATCA radio observation details.
However, in order to measure the total gas content of GRB host galaxies (as opposed to column densities along a single line of sight from GRB afterglow absorption spectroscopy), atomic and molecular lines need to be detected in emission. After numerous unsuccessful searches (Kohno et al. 2005; Endo et al. 2007; Hatsukade et al. 2007, 2011; Stanway et al. 2011), the carbon monoxide (CO) line emission from three z ~ 0.1–0.8 GRB host galaxies was detected and claimed to be weak compared with their star formation rates (SFRs) and dust masses (Hatsukade et al. 2014; Stanway et al. 2015b). This may be surprising because molecular gas is believed to be the fuel of star formation (Carilli & Walter 2013), and the short duration of the main-sequence phase of GRB progenitors implies that their hosts are currently star forming (e.g. Christensen et al. 2004; Castro Cerón et al. 2006, 2010; Le Floc’h et al. 2006; Savaglio et al. 2009; Levesque et al. 2010a; Svensson et al. 2010; Krühler et al. 2011, 2012b; Hjorth et al. 2012; Jakobsson et al. 2012; Milvang-Jensen et al. 2012; Perley et al. 2013, 2015b; Hunt et al. 2014a; Schady et al. 2014; but see Rossi et al. 2014), and this process should be fuelled by molecular gas.
However, a large fraction of the interstellar medium (ISM) is in the form of neutral hydrogen. This is especially true for dwarf galaxies (e.g. Hunt et al. 2014b), and to some extent for moderate-mass galaxies (M∗ ~ 1010–1011M⊙; Leroy et al. 2008; Lagos et al. 2011), which dominate the cosmic SFR density (Brinchmann et al. 2004), so we expect them to host a large fraction of GRBs. Up to date, there has been no systematic study of the molecular and neutral gas content of GRB hosts, and of its relation to their (usually) moderate SFRs and dust masses.
The objectives of this paper are to: i) present the first detection of the neutral hydrogen gas emission in a sample of GRB host galaxies; ii) test whether the amounts of gas are at odds with what is usually found in other star-forming galaxies; and iii) consider what the atomic gas masses of GRB hosts can tell us about the fuelling of star formation and the evolutionary stage of GRB hosts.
We use a cosmological model with H0 = 70 km s-1 Mpc-1, ΩΛ = 0.7, and Ωm = 0.3, and the Chabrier (2003) initial mass function (IMF), to which all SFR and stellar masses were converted (by dividing by 1.8) if given originally assuming the Salpeter (1955) IMF.
2. Samples and data
2.1. GRB hosts
Our H I target sample comprises all five z< 0.12 GRB hosts in the southern hemisphere. This ensures that they are visible by the Australia Telescope Compact Array (ATCA) and that the H i line is in the accessible frequency range. Table 1 shows the basic properties of these hosts, whereas Table 2 lists the details of the ATCA observations.
We performed radio observations with ATCA using the Compact Array Broad-band Backend (CABB; Wilson et al. 2011) on 12 Apr. 2012, 18−25 Jul. 2013, and 11−14 Apr. 2014 (project no. C2700, PI: M. Michałowski). The array was in the 1.5B configuration with baselines up to 1286 m for the GRB 980425 host and in the 6A configuration with baselines up to 5939 m for other hosts. The data reduction and analysis were done using the Miriad package (Sault & Killeen 2004; Sault et al. 1995).
One intermediate frequency (IF) was centred at 2.1 GHz with a 2 GHz bandwidth (2048 channels 1 MHz wide each). We analysed the data separately in four 0.5 GHz frequency ranges centred at 1324, 1836, 2348, and 2860 MHz. For the GRB 980425 host we used a 50′′ diameter aperture to measure the fluxes. Other hosts are not resolved, so we applied Gaussian fitting. The continuum data for the GRB 980425 host was presented in Michałowski et al. (2014b).
A second IF was centred at the H I line in the ATCA CABB “zoom” mode with 32 kHz resolution. We subtracted the continuum to obtain the continuum-free data, and made the Fourier inversion to get a data cube with a velocity resolution of 6.6 km s-1. We then made a CLEAN deconvolution down to ~3σ, after which we restored the channel maps with a Gaussian beam.
For the GRB 111005A host we used archival Nançay telescope H I data from Theureau et al. (1998) and Springob et al. (2005). This galaxy was not recognised as a GRB host at the time of these observations. The galaxy appears point-like in these data because of the beam size of 4′ × 20′ (Springob et al. 2005). The spectrum has a channel width of 25 kHz (~5 km s-1).
The potential association of GRB 111005A with the galaxy ESO 580-49 at z = 0.01326 was suggested by Levan et al. (2011), and confirmed by our multi-facility campaign (Xu et al. 2011b,a; Michałowski et al. 2011, in prep). We measured its UV emission on the maps from the GALEX (Martin et al. 2003, 2005)1 archive, obtaining fluxes of 524 ± 38μJy and 79 ± 20μJy at the near- and far-UV filters, respectively.
We calculated the stellar mass of the GRB 100316D host using the photometry from Starling et al. (2011), Cano et al. (2011) and the photometry from the data presented in Olivares E. et al. (2012). The latter measurements are presented in Table 3. We applied the SED fitting method detailed in Michałowski et al. (2008, 2009, 2010a,b, 2012a, 2014a, see therein a discussion of the derivation of galaxy properties and typical uncertainties) based on 35 000 templates in the library of Iglesias-Páramo et al. (2007), plus additional templates of Silva et al. (1998) and Michałowski et al. (2008), all developed in Grasil2 (Silva et al. 1998). They are based on numerical calculations of radiative transfer within a galaxy that is assumed to be a triaxial system with diffuse dust and dense molecular clouds, in which stars are born.
For the GRB 031203 host we calculated a dust mass upper limit from the 870 μm non-detection of Watson et al. (2011), and we did not use the value of 104.27M⊙ calculated by Symeonidis et al. (2014) based only on detections at wavelengths shorter than 100μm, as this reflects the amount of hot dust. Cold dust (dominating the total dust mass) does not emit significantly at these wavelengths. Using the relation between cold and warm dust masses derived by Izotov et al. (2014, their Fig. 12), the hot dust mass derived by Symeonidis et al. (2014) corresponds to the cold dust mass of 106.8M⊙, an order of magnitude lower than our upper limit.
Metallicities of our sample are shown in the second to last column of Table 1. They span the range 0.4−1.0 solar. They were derived from emission-line diagnostics, so they reflect gas-phase metallicities.
Unless otherwise stated, when we refer to the SFRs of GRB hosts we use the infrared or radio estimates from the forth column of Table 1.
2.2. Other galaxy samples
In order to place the GRB hosts in the context of general galaxy populations we compared their properties with those of the following galaxy samples, chosen based on the availability of the gas mass estimates: local spirals (Devereux & Young 1990), optical flux limited spirals and irregulars with IRAS data (Young et al. 1989), local luminous infrared galaxies (LIRGs; Sanders et al. 1991), local ultra luminous infrared galaxies (ULIRGs; Solomon et al. 1997), the Herschel Reference Survey (HRS; Boselli et al. 2010; Cortese et al. 2012, 2014; Boselli et al. 2014; Ciesla et al. 2014), H i-selected z< 0.02 galaxies (Doyle & Drinkwater 2006), H i-rich galaxies (Wang et al. 2013), the GALEX Arecibo SDSS Survey (GASS) 0.025 <z< 0.05 galaxies with log (M∗/M⊙) > 10 (Catinella et al. 2010), the COLD GASS survey supplementing CO data (Saintonge et al. 2011), The H I Nearby Galaxy Survey (THINGS; Walter et al. 2008), H i-dominated, low-mass galaxies and large spiral galaxies (Leroy et al. 2008), 0.01 <z< 0.03 mass-selected galaxies with 8.5 < log (M∗/M⊙) < 10 (Bothwell et al. 2014), dwarf Local Irregulars That Trace Luminosity Extremes (LITTLE) THINGS (Hunter et al. 2012), local dwarfs (Stilp et al. 2013), Herschel Virgo Cluster Survey (HeViCS; Davies et al. 2010), blue compact dwarfs (Grossi et al. 2010), H i-selected Arecibo Legacy Fast ALFA (ALFALFA; Giovanelli et al. 2005) dwarfs (Huang et al. 2012), a volume-limited sample of dwarfs at distances <4 Mpc (Ott et al. 2012), metal-poor dwarfs (Hunt et al. 2014b; Leroy et al. 2007), metal-poor dwarfs from the Herschel Dwarf Galaxy Survey (Cormier et al. 2014), z ~ 1.5 BzK galaxies (Daddi et al. 2010; Magdis et al. 2011; Magnelli et al. 2012), and 1.2 <z< 4.1 submillimetre galaxies (Bothwell et al. 2013; Michałowski et al. 2010a).
All dust mass estimates were converted to a common dust mass absorption coefficient κ850 μm = 0.35 cm2 g-1, all stellar masses and SFRs were converted to the Chabrier (2003) IMF, and all molecular masses were converted to αCO = 5M⊙ (K km s-1 pc . This Galactic value is appropriate for 0.4–1 solar metallicity galaxies discussed here (Bolatto et al. 2013; Hunt et al. 2014b).
SFR estimates of other galaxies are often derived from various diagnostics (UV, Hα, IR, radio), but they were shown to be broadly consistent (Salim et al. 2007; Wijesinghe et al. 2011), even in dwarf galaxies, except of very low SFR< 0.001 (Huang et al. 2012; Lee et al. 2009), not discussed here.
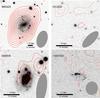 |
Fig. 1 Integrated H I line map of the GRB hosts (contours; positive/negative values are solid/dashed at −2, −1, 2, 3, 4σ, ...) on top of the optical images (Sollerman et al. 2005; Mazzali et al. 2006; Thöne et al. 2008; Starling et al. 2011). The spectrum was integrated in the frequency range shown as dotted lines in Fig. 2. North is up and east is to the left. The images are 30′′ × 30′′ except for GRB 980425, for which it is 100′′ × 100′′. The scale is indicated on each panel. The FWHM beam sizes of the H I data are shown as filled ellipses. The blue circles show the GRB positions. The map for the GRB 111005A host is not shown, as we use archival data with poor spatial resolution (Sect. 2.1). To estimate the H I properties for the GRB 060505 host only the central source was used. The north-western source is at the same redshift (Fig. 2) and is analysed separately (Table 4 and Sect. 4.3). |
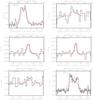 |
Fig. 2 H i spectra of the GRB hosts (histograms) with the Gaussian fit overplotted (red lines). These fits are presented only for illustration, as the total fluxes were determined from the direct integration of the spectra (Sect. 3.1). Vertical dotted lines show the frequency range used to measure the total H I emission and to produce the integrated H I maps (Fig. 1). The spectrum marked “060505comp” corresponds to the companion object north-west of the GRB 060505 position (Fig. 1). |
H i properties of GRB hosts.
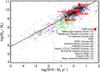 |
Fig. 3 H i mass as a function of infrared/radio-based star formation rate (SFR) of GRB hosts (red circles) and other galaxies, as indicated in the legend and described in Sect. 2.2. The solid black line is a linear fit to all the data (Eq. (1)). GRB hosts are consistent with the general star-forming galaxy population. |
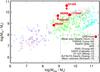 |
Fig. 4 H i mass as a function of stellar mass of GRB hosts (red circles) and other galaxies, as indicated in the legend and described in Sect. 2.2. GRB hosts are consistent with the general star-forming galaxy population. |
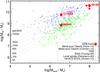 |
Fig. 5 H i mass as a function of dust mass of GRB hosts (red circles) and other galaxies, as indicated in the legend and described in Sect. 2.2. Dotted lines denote constant gas-to-dust mass ratios with values indicated on the left. GRB hosts are consistent with the general star-forming galaxy population, especially with the Herschel Reference Survey (HRS) galaxies with similarly measured dust masses. |
Radio continuum properties of GRB hosts.
3. Results
3.1. Neutral hydrogen H I line
The fluxes at each frequency element were determined by aperture photometry with the aperture radius of 75′′ for the GRB 980425 (to encompass the entire H I emission, see Fig. 1) and of 8′′ for the remaining targets. For the GRB 111005A the spectrum was directly available from Theureau et al. (1998) and Springob et al. (2005). Gaussian functions were fitted to the spectra (Fig. 2) and the parameters of the fit are reported in Cols. 2−4 of Table 4. The H I emission map derived from the collapsed cube within 2σ from this fit (dotted lines in Fig. 2) is shown in Fig. 1. This range was also used to obtain integrated H i emission (Fint in Jy km s-1) directly from the spectra (not from the Gaussian fit, which in some cases is not a perfect representation of the line shape). The line luminosity ( in K km s-1 pc2) was calculated using Eq. (3) in Solomon et al. (1997) and transformed to MHI using Eq. (2) in Devereux & Young (1990).
We detected the H i emission of the hosts of GRB 980425, 060505, and 111005A. This is the first time when atomic gas is detected in emission from a GRB host (see also Arabsalmani et al. 2015 on the GRB 980425 host, based partially on the same data). Moreover, for GRB 060505 we detected H I emission ~10″ (19 kpc at its redshift) north-west of the centre of the host H I emission (RA = 22:07:02.9, Dec = −27:48:46.4; source “060505comp” in Fig. 2 and in Table 4). The redshift of this object is consistent with that of the GRB 060505 host (velocity offset ~ 6 ± 18 ). This object is discussed in Sect. 4.3. Its flux was not included in the estimate for the GRB 060505 host.
The beam sizes of the radio continuum maps and H I maps are shown in Table 2. Only the GRB 980425 host is resolved, and its dynamical properties are presented in Arabsalmani et al. (2015). The lack of higher-resolution data does not affect our results, as we analyse the total H I content, not its distribution.
The atomic hydrogen masses of GRB hosts and other galaxies as a function of their SFR, stellar mass, and dust mass are shown in Figs. 3−5, respectively. We find that the GRB 980425 host has a molecular gas mass fraction of MH2/ (MH2 + MHI) < 14%, which is within the range for other star-forming galaxies (a percentage of a few to a few tens; Young et al. 1989; Devereux & Young 1990; Leroy et al. 2008; Saintonge et al. 2011; Cortese et al. 2014; Boselli et al. 2014).
The H I spectra of both GRB 980425 and 111005A exhibit a double-peaked profile characteristic for a rotating disk.
For ESO 580-49 (the GRB 111005A host) Theureau et al. (1998) provided total widths of the H I line at 20% and 50% of the peak flux of 284 ± 15 km s-1 and 272 ± 10 km s-1, respectively, slightly higher than the FWHM given in Table 4 because the Gaussian function does not represent the line profile accurately. Our estimate of the integrated flux (which does not involve assumptions on the line shape), agrees with 7.6 ± 0.9 Jy km s-1 given by Theureau et al. (1998).
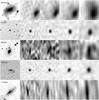 |
Fig. 6 Optical (first column; Sollerman et al. 2005; Mazzali et al. 2006; Thöne et al. 2008; Starling et al. 2011, and this work) and radio continuum images centred at 2800, 2340, 1860, and 1340 GHz. North is up and east is to the left. Each panel is 30′′ × 30′′ The FWHM beam size is shown on each radio panel as an ellipse. The blue circles show the GRB positions. |
3.2. Radio continuum
The radio images at all four frequencies are shown in Fig. 6. All hosts are detected, but the significance for the GRB 060505 host is only around 3σ. For each host we fitted a power law to these fluxes obtaining the radio slope α and the rest-frame 1.4 GHz flux, which was transformed to SFRradio using the conversion of Bell (2003). Finally, as in Michałowski et al. (2012b), we calculated an approximate measure of the ultraviolet (UV) dust attenuation AUV = 2.5log (SFRradio/SFRUV), which we converted to visual attenuation assuming an SMC extinction curve, which gives AV = AUV/ 2.2 (Gordon et al. 2003). All these estimates are reported in Table 5. Due to a similar shape of all standard extinction and attenuation curves between 0.275μm and V-band, our AV estimate would only be ~10% higher if we used the LMC or the Milky Way extinction curves (Gordon et al. 2003), and ~20% higher with the Calzetti et al. (2000) attenuation curve.
Up to date 89 long-GRB hosts have been targeted in the radio continuum (Berger et al. 2001, 2003; Vreeswijk et al. 2001; Fox et al. 2003; Frail et al. 2003; van der Horst et al. 2005; Wiersema et al. 2008; Michałowski et al. 2009, 2012b; Stanway et al. 2010, 2014; Watson et al. 2011; Perley & Perley 2013; Perley et al. 2015b), and only 15 (~17%) were detected: the hosts of GRB 980425 (Michałowski et al. 2009), 980703 (Berger et al. 2001), 000418, 010222, (Berger et al. 2003), 021211 (Michałowski et al. 2012b), 031203 (Stanway et al. 2010; Watson et al. 2011; Michałowski et al. 2012b), 051022, 080207, and 090404 (Perley & Perley 2013); 051006, 060814, 061121, 070306, (Perley et al. 2015b), 080517 (Stanway et al. 2015a), 100621A (Stanway et al. 2014); with the addition of the hosts of short (duration <2 s) GRBs 071227 (Nicuesa Guelbenzu et al. 2014), and 120804A (Berger et al. 2013).
We provide three more detections (060505, which has been targeted before but not detected, 100316D and 111005A) bringing the fraction of detected hosts to 18/91 (~20%).
4. Discussion
4.1. Large H I reservoirs in GRB hosts: early stages of star formation
It is still an unanswered question whether GRB hosts are consistent with the general population of star-forming galaxies. As shown in Figs. 3−5, GRB hosts at z< 0.12 contain large atomic gas reservoirs, within the ranges expected for galaxies with similar SFRs, stellar masses, and dust masses.
We performed a two-dimensional Kolmogorov-Smirnov test using the publicly available IDL procedures3 of Yoachim et al. (2009). We compared the GRB host sample to the HI-selected galaxies (Doyle & Drinkwater 2006) on the SFR-MHI plane, and the HRS (Boselli et al. 2010) galaxies on the M∗-MHI plane because GRB hosts span similar SFR and M∗ ranges to those of these galaxies, respectively. For GRB 031203 and 100316D with no H I detections, we assumed 20 different values of their MHI between M∗/ 100 (a conservative lower limit) and the derived MHI upper limits (Table 4). We obtained p-values of 11−79% for the SFR-MHI plane, and 0.2–24% for the M∗-MHI plane. This implies that GRB hosts have consistent (or somewhat higher) atomic gas masses when being compared with other samples. If the H I masses of non-detected hosts are close to the derived upper limits, then the probability for the M∗-MHI plane is 0.2%, corresponding to a ~4σ discrepancy between the GRB host and the HRS samples. In such a case, GRB hosts are all located in the high-MHI end of the distribution or have low M∗, which is also evident in Fig. 4. If these galaxies are well below the derived upper limits, then the GRB host population is consistent with the comparison sample.
The mass at which the contribution of local galaxies to the H I mass function is the highest is log (MHI/M⊙) ~ 9.6, as derived from the MHI function of Zwaan et al. (2005). This is similar to what we found for GRB hosts. This is consistent with numerical simulations, suggesting that galaxies with low SFRs (similar to low-z GRB hosts) dominate the H I mass density at all redshifts, including the local universe (Fig. 6 of Lagos et al. 2014). In particular, galaxies with SFR = 0.1−5 and 0.1−1 contribute ~45% and ~30% to the H I mass density at z< 1. (Lagos et al. 2012, 2014, priv. comm.) All our H i-detected GRB hosts are in this SFR range, so they can be considered typical galaxies at low-z with regards to their H i content.
These considerations indicate that, at least at z ≲ 0.1, GRB hosts can be regarded as normal star-forming galaxies. This is consistent with the conclusion presented in Michałowski et al. (2012b), Hunt et al. (2014a) and Kohn et al. (2015) based on radio and far-infrared continuum data.
To complete this picture we note that Perley et al. (2013, 2015b,c) and Vergani et al. (2015) found that GRB hosts at z< 1.5 have lower stellar masses than what would be expected from the assumption that GRBs trace the cosmic star formation activity in an unbiased way. Additionally, (Michałowski et al. 2014b, in prep.) found dust masses of two low-z GRB hosts to be close to the lower envelope of other galaxies.
Normal SFRs and atomic gas masses, together with low stellar and molecular gas masses are consistent with GRB hosts being preferentially galaxies which have very recently started a star formation episode. In this scenario, GRB hosts have not had enough time yet to use their atomic gas reservoir (which is then high) and to produce stars and dust (which catalyses the molecular gas formation).
All our targets are in the nearby Universe, so are likely different from the high-z counterparts. Only with the advent of the Square Kilometre Array (SKA) the H I emission of GRB hosts (and other galaxies) at higher redshifts can be detected.
4.2. H2 vs. H I: what is the fuel of star formation?
Large atomic gas content, as measured from our data, together with the molecular gas deficiency can in principle be explained in four different ways, which we discuss below, providing evidence that the first two contradict observations and that the last one (star formation directly fuelled by a recent accretion of atomic gas) is the most plausible (because of the metallicity considerations and the success to explain low stellar masses of GRB hosts).
First, it is possible that very strong UV radiation from the star-forming region in which a GRB progenitor is born dissipated the available molecular hydrogen (Hatsukade et al. 2014; Stanway et al. 2015b). However, this is unlikely to affect the entire galaxy, but just the vicinity of the GRB. Moreover, such process would also destroy dust, whereas the molecule-poor regions close to the GRB sites are dust-rich (Hatsukade et al. 2014), as is the region close to the GRB 980425 (Michałowski et al. 2014b). Finally, very intense UV radiation dissipating the remaining molecular gas would imply that the surrounding of a GRB is at the end of the intense star formation episode, which should result in an enhanced metallicity in that region, contrary to observations (Christensen et al. 2008; Modjaz et al. 2008; Thöne et al. 2008, 2014; Levesque et al. 2010a, 2011; Han et al. 2010).
Second, low molecular gas masses in GRB hosts were derived from the CO lines, which may not be a good tracer of molecular gas at low metallicities if dust shielding is weak (Bolatto et al. 2013), and if a significant amount of H2 gas is CO-dark, as is the case for metal-poor dwarfs. However, this is not the case for GRB hosts for which low molecular gas content was claimed because they have 0.5−1.0 solar metallicity (Castro-Tirado et al. 2007; Graham et al. 2009; Levesque et al. 2010b; Stanway et al. 2015a). Similarly, in our sample the metallicity is not very low either, around 0.4−1.0 solar (Sollerman et al. 2005; Levesque et al. 2010a, 2011; Thöne et al. 2008, see Table 1). Moreover, a low molecular gas content in GRB hosts has also been found independently of CO observations, using the optical afterglow spectroscopy, tracing molecular gas column density along the GRB line of sight (Fynbo et al. 2006; Tumlinson et al. 2007; Krühler et al. 2013; D’Elia et al. 2014). This is not due to molecule destruction by the GRB itself, as this can only be effective up to a few parsecs from the GRB (Draine & Hao 2002).
Third, atomic gas may be converted into the molecular phase and be immediately used for star formation (which explains the lack of molecular gas). However, the timescale of the H i-to-H2 conversion is usually longer than the cooling timescale (and the star formation timescale; Krumholz 2012), so this could happen only at approximately solar metallically, at which H i-to-H2 conversion is quicker than the star formation timescale. Metallicities of GRB hosts and GRB sites are usually much lower (see the discussion below), so this explanation is possible only if some properties of GRB hosts make the H i-to-H2 conversion unusually effective, which is not accounted for in the models of Krumholz (2012).
Finally, the fourth and our preferred option is that star formation is directly fuelled by atomic gas from the intergalactic medium. This was theoretically shown to be possible (Glover & Clark 2012; Krumholz 2012), and must have been the case for the very first stars in the Universe (in the absence of dust and molecular gas). This can also take place at any redshift, even in a galaxy not particularly metal-poor on average, as long as it happens at early stages of a star formation episode, when the first stars are born in a collapsing cloud formed out of newly accreted metal-poor gas.
Physically, this scenario rests on two points. First, observations indicate that star formation begins within roughly one free-fall time of the appearance of a cold, dense phase of the ISM (for example see the review by Dobbs et al. 2014). Only the duration of star formation is a matter of a debate, but this is not relevant here, as we concentrate on the beginning of a star formation episode. Indeed, some observations and theoretical models indicate that star formation finishes quickly after it starts, around 1−2 free-fall times (Elmegreen 2000; Hartmann et al. 2001; Jeffries et al. 2011; Reggiani et al. 2011; Dobbs & Pringle 2013), whereas other suggest that the duration of star formation can be significantly longer (several up to 10 free-fall times), though it still starts around one free-fall time (Tan et al. 2006; Krumholz et al. 2006; Kawamura et al. 2009; Fukui et al. 1999).
Second, the timescale for the appearance of a cold phase is determined by the gas cooling time, while the appearance of H2 is determined by the chemical equilibration time. At low metallicities the cooling time is longer, but still remains much shorter than the free-fall time, whereas the chemical equilibration time can be much longer (Krumholz 2012, Fig. 1), leading to the formation of a cold phase and the onset of star formation before gas is able to convert from H I to H2. Specifically, theoretical models (Krumholz 2012) predict that at the metallicities of ~0.3 solar typically found in GRB sites (including those analysed here; Christensen et al. 2008; Modjaz et al. 2008; Levesque et al. 2010a, 2011; Han et al. 2010; Thöne et al. 2014) gas can cool to low temperatures in less than a free-fall time, but that full conversion to molecular gas requires close to ten free-fall times, so the first stages of star formation are fuelled by atomic gas. Moreover, the observed GRB site metallicities could even overestimate the metallicity when the GRB progenitor formed, since the metallicity will have been increased during the progenitor’s lifetime by ongoing mixing with the more metal-rich gas existing in the hosts. If so, the discrepancy between molecule-formation and free-fall timescales would be even larger. Thus our preferred scenario is that GRB progenitors potentially form in the first burst of star formation that takes place in newly accreted low-metallicity intergalactic medium (IGM) gas. The progenitor then would end its life as a GRB before there is time for substantial H2 to form, explaining the paucity of H2 absorption features seen in GRB afterglows, and the paucity of CO emission from the host galaxy.
Indeed recent star formation and large H I content for other galaxies (as also observed for GRB hosts) are believed to be a result of recent inflow of metal-poor gas from the intergalactic medium (Davé et al. 2013). This creates metal-poor regions in a galaxy (as observed in other galaxies by Cresci et al. 2010; Sánchez Almeida et al. 2013, 2014), which mix with the surrounding metal-rich gas over a relatively long timescale (≲100 Myr; Yang & Krumholz 2012; Grand et al. 2015; Petit et al. 2015). Indeed, GRBs were shown to explode in the most metal-poor regions of their hosts (Christensen et al. 2008; Thöne et al. 2008, 2014; Levesque et al. 2011). The GRB site metallicities are ~0.3 solar, which would imply that less than half of the accreted gas converts to the molecular phase after one free-fall time (Krumholz 2012). This fraction can be lower if the accreted gas had in fact lower metallicity than the GRB site measurements, which have been increased by ongoing mixing with the more metal-rich gas existing in the hosts. We note that the bulk of the star formation in these regions (at later stages) will have to be fuelled by molecular gas, when the conversion from the atomic to molecular phase is complete.
The recent accretion of atomic gas also explains high specific SFRs of GRB hosts (e.g. Castro Cerón et al. 2010) because the enhanced SFR has not lasted very long, so the stellar mass of a galaxy is lower than what would be expected from its high SFR. Moreover, this mechanism directly predicts that the regions around GRBs (at which the gas is accreted) have enhanced SFRs and dust masses than other parts of the hosts, consistent with observations (Le Floc’h et al. 2006, 2012; Christensen et al. 2008; Thöne et al. 2008, 2014; Levesque et al. 2011; Hatsukade et al. 2014; Michałowski et al. 2014b).
Our data therefore is consistent with a scenario whereby GRBs are preferentially produced when low-metallicity gas accretes onto a galaxy and undergoes rapid cooling and star formation before it either forms H2 or mixes with the higher-metallicity gas in the remainder of the galaxy. This mechanism can be tested with positional and velocity information from high-resolution H I observations, which may reveal concentration of H I close to metal-poor regions.
If confirmed, this mechanism will provide a natural explanation of the low metallicity and low MH2 preference in the framework of the GRB collapsar model, which requires that GRB progenitors have low metallicity in order to reduce the loss of mass and angular momentum (required for launching the jet; Yoon & Langer 2005; Yoon et al. 2006; Woosley & Heger 2006). In contrast, at later stages of star formation molecular gas is the dominant phase in the interstellar medium, but the metals are well mixed, and gas has been further enriched, so massive stars do not end their lives as GRBs, and such metal- and molecular-rich galaxies do not become GRB hosts.
However, this picture is complicated by the fact that some GRBs have been found in galaxies with solar or supersolar metallicities (Prochaska et al. 2009; Levesque et al. 2010b; Krühler et al. 2012a; Savaglio et al. 2012; Elliott et al. 2013; Schulze et al. 2014; Stanway et al. 2015a; Hashimoto et al. 2015; Schady et al. 2015). This can be explained in two ways. First, these metallicity measurements were obtained for the entire galaxies, so do not rule out local metallicity decrements (as observed for other GRB hosts), predicted by the mechanism of recent metal-poor gas accretion.
Second, this high-metallicity problem is alleviated by some models, which predict the GRB preference for low metallicity, but do not exclude metal-rich examples, for example the model in which a GRB progenitor is a rapidly rotating Helium star created by a merger of post-main sequence stars (van den Heuvel & Portegies Zwart 2013). In both collapsar and binary scenarios the low metallicity preference (even if it is not strict) is consistent with our interpretation that GRB hosts have recently started a star formation episode.
We note that the IMF in metal-poor environments has been suggested to be top-heavy (Bate 2005; Zhang et al. 2007; Marks et al. 2012; but see Myers et al. 2011). Hence, the sites of GRB explosions are promising places to look for the top-heavy IMF. This IMF would imply higher massive star (and hence GRB) production per unit SFR in such environments.
Summarising, our results provide the first observational indication of star formation fuelled by atomic gas. The link between the star formation and the atomic gas for all galaxies is visible in Fig. 3 where the H I mass is strongly correlated with SFR. The linear fit to all datapoints gives 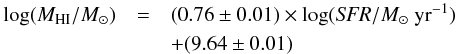 (1)The Spearman’s rank correlation coefficient for this relation is 0.77, indicating a significant (~30σ) correlation. The scatter around this correlation is ~0.38 dex, which is likely a consequence of galaxies with similar SFRs being at different evolutionary stages. The correlation with similar slope was also noted using the surface densities of SFR and MHI (Kennicutt 1998b; Bigiel et al. 2010; Roychowdhury et al. 2014).
The slope of ~0.76 (or ~1.3 with inverted axes) is shallower than the linear (slope of unity) Schmidt-Kennicutt relation between molecular gas and SFR densities (Bigiel et al. 2008). This indicates that overall molecular gas is better correlated with star formation, so is its major fuel. However, in outer parts of spiral galaxies, and in H i-dominated galaxies, the relation between SFR and H I column density is in fact linear (Bigiel et al. 2008, 2010) and the SFR-gas correlation improves when atomic gas is taken into account, not just the molecular gas (Fumagalli & Gavazzi 2008, their Fig. 2). This was interpreted as H I fuelling of low-levels of star formation in the outer parts of disks. A similar mechanism may also operate in some star-forming regions of GRB hosts because these galaxies have low molecular gas content, and are likely observed at the beginning of a star formation episode, just after accreting atomic gas from the IGM, unlike other galaxies.
4.3. Location of the H I emission
Despite the low resolution of our H I data we can infer useful information about the location of the H I emission, which supports our gas inflow scenario. First, the companion H I object (not a nearby galaxy, as we show below) is only ~19 kpc from the GRB 060505 host (Figs. 1 and 2), so they must be physically related (the optical radius of the GRB 060505 host is ~11 kpc; Thöne et al. 2008). With the current resolution we cannot definitely determine the nature of this relation, but its existence is consistent with H I gas inflowing from the north-western direction, either in a form of a star-free atomic gas cloud, or with extremely low stellar surface density (we discuss below that the astrometry of the radio and optical images are consistent). The radial velocities of the GRB 060505 host and this cloud are identical (offset of ~ 6 ± 18, Table 4), which is consistent with the scenario that the cloud is flowing directly toward the host, or that the orbit is perpendicular to the line of sight. The existence of this objects may indicate that the host of GRB 060505 is at the earliest stage of the inflow compared with other hosts, so the inflowing material is still visible outside the host, unlike for other members of our sample. The inflow scenario for this cloud needs to be tested by high-resolution H I observation, which can reveal its morphology and velocity structure.
There are two other explanations of this feature, but they are unlikely. First it could be a signature of a major merger4 with another galaxy, but the H I companion object does not have any optical counterpart (despite high log (MHI/M⊙) ~ 9.7; Table 4), so cannot be understood as a companion galaxy, but rather a large gas cloud. Namely, it is not detected with the HST B-band image down to a (point-source) limit of 27.1 mag AB (Ofek et al. 2007). This corresponds to an absolute magnitude of MB> −10.93 mag, and a luminosity LB< 2.9 × 10⁶L⊙. Hence it has log (MHI/LB) > 3.3, much higher than those of dwarf galaxies (from −1.5 to 0.75; Fig. 1 of Hunter et al. 2012). This limit assumes that this object is point-like in the HST resolution, but it would need to be larger than the HST resolution ~20 times (~ 2″, or ~3 kpc) to make its MHI/LB ratio consistent with those of dwarf galaxies. But then it would be an extremely low-surface brightness object. Moreover, no emission lines were found at this position in the IFU data of Thöne et al. (2014).
Second, the H I companion may be ejected from the GRB 060505 host via tidal interaction or ram pressure stripping. However, this explanation is unlikely given the lack of nearby companions and that it is not located in the high-density cluster environment (Sect. 4.4).
Another information supporting our gas inflow interpretation is that for both the GRB 980425 and 060505 hosts the centre of the H I emission is shifted away from the optical centre of the galaxy towards the GRB position (Fig. 1). If a galaxy has a steady H I disk, its center should coincide with the optical center of this galaxy. On the other hand, if a galaxy has received a significant gas inflow from one direction, then in low-resolution data the H I centroid will be offset from the optical center towards this direction. Hence, the offsets for GRB 980425 and 060505 host are consistent with an inflow of atomic gas on the regions around the GRB positions. This will be verified with future higher-resolution observations.
To test the ATCA astrometry we imaged the phase calibrator for the GRB 060505 observations (2149-287) obtaining the position 21:52:03.735, −28:28:28.256, which is only ~ 0.04″ away from the catalogue position 21:52:03.7352, −28:28:28.2185. We also searched for common objects in the radio and optical images. There is no other significant object in the integrated H I map (Fig. 1), which would be inside the optical map, but in the radio continuum image ~1′ south-west of the GRB position there is an ~0.4 mJy source at the position 22:07:00.093, −27:49:14.89 with an optical counterpart at the position 22:07:00.133, −27:49:15.32. Hence, the radio map is shifted only 0.7″ to the West with respect to the optical map.
The astrometry of the optical image (Thöne et al. 2008) was tied to the Two Micron All Sky Survey catalogue (Jarrett et al. 2000; Skrutskie et al. 2006), and is accurate to a fraction of arcsec (~0.1″). Moreover, it is consistent with more recent astrometry from Hjorth et al. (2012).
Hence we conclude that the astrometry of the optical and radio images are consistent, and therefore the H i-optical offsets for the GRB 980425 and 060505 hosts are real.
Finally, we note that the concentration of atomic gas in the south-eastern (blue-shifted; Michałowski et al. in prep.) part of the GRB 111005A host is also hinted by its asymmetric H I line profile (Fig. 2). The blue-shifted line part is more pronounced, so the south-eastern part contains more atomic gas. The line profile for the GRB 980425 is more symmetric, but this is expected because its metal poor region (close to the GRB site) has the velocity close to the systemic one (Christensen et al. 2008).
4.4. Large scale environments
If GRB hosts were located in dense large-scale regions (e. g. close to the cores of massive groups or clusters), then our interpretation of recent metal-poor gas inflow would be difficult to advocate because of scarcity of metal-poor gas in such environments. However, the GRB 980425 host has been shown to be isolated (Foley et al. 2006). While the GRB 060505 host lies in the foreground of a filamentary structure a few Mpc away from a galaxy cluster (Thöne et al. 2008), at such distances gas stripping or evaporation does not take place, and the SFR is actually enhanced (Porter et al. 2008).
In order to investigate the environments of other hosts in our sample we searched the NASA/IPAC Extragalactic Database (NED) for companion galaxies within 1 Mpc in projection and within ±1500 km s-1 in redshift. The GRB 031203 and 100316D hosts have no nearby galaxies within these search criteria. The GRB 111005A host is not in any NED group catalog either, and there are only 6 nearby galaxies nearby, all ≳500 kpc away.
Hence, the host galaxies are all relatively isolated in terms of large-scale environment, which makes it possible that they experienced inflows of metal-poor intergalactic gas.
4.5. Little dust-obscured star formation
Only for the GRB 100316D host the radio SFR exceeds significantly the UV-derived value, implying AV ~ 0.86 mag (Tables 1 and 5). For the remaining hosts the comparable SFRradio and SFRUV indicate that there is very little dust-obscured star formation in these hosts. This is consistent with our interpretation that GRB hosts are at the beginning of the star formation episode, when the dust content has not had time to accumulate to make star-forming regions optically thick.
4.6. Radio spectral slope
The radio spectral slopes (Table 5) of all but one hosts are consistent with those of star-forming galaxies both local and at high redshifts (~−0.75; Condon 1992; Dunne et al. 2009; Ibar et al. 2010).
As suggested in Michałowski et al. (2012b), the spectral slope of the GRB 031203 host is significantly flatter (~−0.19 ± 0.09), inconsistent with the normal value for star-forming galaxies. This implies a significant free-free emission (or synchrotron self-absorption; Condon 1992) and, hence, a younger stellar population (Bressan et al. 2002; Cannon & Skillman 2004; Hirashita & Hunt 2006; Clemens et al. 2008) because only massive stars emit Lyman continuum photons, which create H ii regions, responsible for free-free emission. The flat slope for the GRB 031203 host also rules out any significant AGN contribution to the radio flux. This is consistent with its location in the star-forming part of the Baldwin-Phillips-Terlevich (BPT; Baldwin et al. 1981) diagram (Watson et al. 2011).
5. Conclusions
We report the results of the first ever H I survey of GRB host galaxies, detecting three out of five targets. Large inferred atomic gas masses, together with low molecular gas, stellar, and dust masses are consistent with GRB hosts being at the beginning of a star formation episode, after accreting metal-poor gas from the intergalactic medium. This star formation may potentially be directly fuelled by atomic gas (or with very efficient H i-to-H2 conversion and rapid exhaustion of molecular gas), which can happen in low-metallicity gas near the onset of star formation because cooling of gas (necessary for star formation) is faster than the H i-to-H2 conversion. This provides a natural route for forming GRBs in low-metallicity environments. The gas inflow scenario is consistent with the existence of a companion H I object with no optical counterpart ~19 kpc from the GRB 060505 host, and with the offset towards the GRB positions of the H i centroids for the GRB 980425 and 060505 hosts away from the optical centres of these galaxies.
Galaxy Evolution Explorer; http://galex.stsci.edu/
This could not be a minor merger because these objects have similar H I masses.
Acknowledgments
We thank Joanna Baradziej, Stefano Covino, Paweł Michałowski, Tadeusz Michałowski, and our referee for help with improving this paper; Robert Braun, Sarah Maddison, Anita Titmarsh, Catarina Ubach, and Ivy Wong for help with the ATCA observations; Christina Thöne for analysing for us her IFU data for the GRB 060505 host; Marianne Doyle-Pegg for providing her data; Claudia Lagos for providing the predictions from her model. M.J.M. acknowledges the support of the UK Science and Technology Facilities Council, British Council Researcher Links Travel Grant, and the hospitality at the Instituto Nacional de Astrofísica, Óptica y Electrónica. The Dark Cosmology Centre is funded by the Danish National Research Foundation. L.K.H. is supported by the INAF PRIN 2012 grant. S.K. and A.N.G. acknowledge support by grant DFG Kl 766/16-1. T.M. and D.B. acknowledge the support of the Australian Research Council through grant DP110102034. A.d.U.P. acknowledges support from the European Commission (FP7-PEOPLE-2012-CIG 322307) and from the Spanish project AYA2012-39362-C02-02. The Australia Telescope Compact Array is part of the Australia Telescope National Facility which is funded by the Commonwealth of Australia for operation as a National Facility managed by CSIRO. Galaxy Evolution Explorer (GALEX) is a NASA Small Explorer, launched in 2003 April. We gratefully acknowledge NASA’s support for construction, operation, and science analysis for the GALEX mission, developed in cooperation with the Centre National d’Etudes Spatiales of France and the Korean Ministry of Science and Technology. This research has made use of data from HRS project. HRS is a Herschel Key Programme utilising Guaranteed Time from the SPIRE instrument team, ESAC scientists and a mission scientist. The HRS data was accessed through the Herschel Database in Marseille (HeDaM; http://hedam.lam.fr) operated by CeSAM and hosted by the Laboratoire d’Astrophysique de Marseille. This research has made use of the GHostS database (http://www.grbhosts.org), which is partly funded by Spitzer/NASA grant RSA Agreement No. 1287913; the NASA/IPAC Extragalactic Database (NED) which is operated by the Jet Propulsion Laboratory, California Institute of Technology, under contract with the National Aeronautics and Space Administration; SAOImage DS9, developed by Smithsonian Astrophysical Observatory (Joye & Mandel 2003); the NASA’s Astrophysics Data System Bibliographic Services; and the Edward Wright Cosmology Calculator www.astro.ucla.edu/~wright/CosmoCalc.html (Wright 2006).
References
- Arabsalmani, M., Roychowdhury, S., Zwaan, M., Kanekar, N., Michałowski, M. J. 2015, MNRAS, accepted ArXiv, eprints [arXiv:1508.03342] [Google Scholar]
- Asplund, M., Grevesse, N., Sauval, A. J., Allen de Prieto, C., & Kiselman, D. 2004, A&A, 417, 751 [NASA ADS] [CrossRef] [EDP Sciences] [Google Scholar]
- Baldwin, J. A., Phillips, M. M., & Terlevich, R. 1981, PASP, 93, 5 [NASA ADS] [CrossRef] [EDP Sciences] [Google Scholar]
- Bate, M. R. 2005, MNRAS, 363, 363 [NASA ADS] [Google Scholar]
- Bell, E. F. 2003, ApJ, 586, 794 [Google Scholar]
- Berger, E., Kulkarni, S. R., & Frail, D. A. 2001, ApJ, 560, 652 [NASA ADS] [CrossRef] [Google Scholar]
- Berger, E., Cowie, L. L., Kulkarni, S. R., et al. 2003, ApJ, 588, 99 [NASA ADS] [CrossRef] [Google Scholar]
- Berger, E., Penprase, B. E., Cenko, S. B., et al. 2006, ApJ, 642, 979 [NASA ADS] [CrossRef] [Google Scholar]
- Berger, E., Zauderer, B. A., Levan, A., et al. 2013, ApJ, 765, 121 [NASA ADS] [CrossRef] [Google Scholar]
- Bigiel, F., Leroy, A., Walter, F., et al. 2008, AJ, 136, 2846 [NASA ADS] [CrossRef] [Google Scholar]
- Bigiel, F., Leroy, A., Walter, F., et al. 2010, AJ, 140, 1194 [NASA ADS] [CrossRef] [Google Scholar]
- Boissier, S., Salvaterra, R., Le Floc’h, E., et al. 2013, A&A, 557, A34 [NASA ADS] [CrossRef] [EDP Sciences] [Google Scholar]
- Bolatto, A. D., Wolfire, M., & Leroy, A. K. 2013, ARA&A, 51, 207 [Google Scholar]
- Boselli, A., Eales, S., Cortese, L., et al. 2010, PASP, 122, 261 [NASA ADS] [CrossRef] [Google Scholar]
- Boselli, A., Cortese, L., & Boquien, M. 2014, A&A, 564, A65 [NASA ADS] [CrossRef] [EDP Sciences] [Google Scholar]
- Bothwell, M. S., Smail, I., Chapman, S. C., et al. 2013, MNRAS, 429, 3047 [NASA ADS] [CrossRef] [Google Scholar]
- Bothwell, M. S., Wagg, J., Cicone, C., et al. 2014, MNRAS, 445, 2599 [NASA ADS] [CrossRef] [Google Scholar]
- Bressan, A., Silva, L., & Granato, G. L. 2002, A&A, 392, 377 [NASA ADS] [CrossRef] [EDP Sciences] [Google Scholar]
- Brinchmann, J., Charlot, S., White, S. D. M., et al. 2004, MNRAS, 351, 1151 [NASA ADS] [CrossRef] [Google Scholar]
- Butler, N. R., Bloom, J. S., & Poznanski, D. 2010, ApJ, 711, 495 [NASA ADS] [CrossRef] [Google Scholar]
- Calzetti, D., Armus, L., Bohlin, R. C., et al. 2000, ApJ, 533, 682 [NASA ADS] [CrossRef] [Google Scholar]
- Cannon, J. M., & Skillman, E. D. 2004, ApJ, 610, 772 [NASA ADS] [CrossRef] [Google Scholar]
- Cano, Z., Bersier, D., Guidorzi, C., et al. 2011, ApJ, 740, 41 [NASA ADS] [CrossRef] [Google Scholar]
- Carilli, C. L., & Walter, F. 2013, ARA&A, 51, 105 [NASA ADS] [CrossRef] [EDP Sciences] [Google Scholar]
- Castro Cerón, J. M., Michałowski, M. J., Hjorth, J., et al. 2006, ApJ, 653, L85 [NASA ADS] [CrossRef] [Google Scholar]
- Castro Cerón, J. M., Michałowski, M. J., Hjorth, J., et al. 2010, ApJ, 721, 1919 [NASA ADS] [CrossRef] [Google Scholar]
- Castro-Tirado, A. J., Bremer, M., McBreen, S., et al. 2007, A&A, 475, 101 [NASA ADS] [CrossRef] [EDP Sciences] [Google Scholar]
- Catinella, B., Schiminovich, D., Kauffmann, G., et al. 2010, MNRAS, 403, 683 [NASA ADS] [CrossRef] [Google Scholar]
- Chabrier, G. 2003, ApJ, 586, L133 [NASA ADS] [CrossRef] [Google Scholar]
- Christensen, L., Hjorth, J., & Gorosabel, J. 2004, A&A, 425, 913 [NASA ADS] [CrossRef] [EDP Sciences] [Google Scholar]
- Christensen, L., Vreeswijk, P. M., Sollerman, J., et al. 2008, A&A, 490, 45 [NASA ADS] [CrossRef] [EDP Sciences] [Google Scholar]
- Ciesla, L., Boquien, M., Boselli, A., et al. 2014, A&A, 565, A128 [Google Scholar]
- Clemens, M. S., Vega, O., Bressan, A., et al. 2008, A&A, 477, 95 [NASA ADS] [CrossRef] [EDP Sciences] [Google Scholar]
- Condon, J. J. 1992, ARA&A, 30, 575 [NASA ADS] [CrossRef] [MathSciNet] [Google Scholar]
- Cormier, D., Madden, S. C., Lebouteiller, V., et al. 2014, A&A, 564, A121 [NASA ADS] [CrossRef] [EDP Sciences] [Google Scholar]
- Cortese, L., Boissier, S., Boselli, A., et al. 2012, A&A, 544, A101 [NASA ADS] [CrossRef] [EDP Sciences] [Google Scholar]
- Cortese, L., Fritz, J., Bianchi, S., et al. 2014, MNRAS, 440, 942 [NASA ADS] [CrossRef] [Google Scholar]
- Cresci, G., Mannucci, F., Maiolino, R., et al. 2010, Nature, 467, 811 [NASA ADS] [CrossRef] [PubMed] [Google Scholar]
- Daddi, E., Bournaud, F., Walter, F., et al. 2010, ApJ, 713, 686 [NASA ADS] [CrossRef] [Google Scholar]
- Davé, R., Katz, N., Oppenheimer, B. D., Kollmeier, J. A., & Weinberg, D. H. 2013, MNRAS, 434, 2645 [NASA ADS] [CrossRef] [Google Scholar]
- Davies, J. I., Baes, M., Bendo, G. J., et al. 2010, A&A, 518, L48 [NASA ADS] [CrossRef] [EDP Sciences] [Google Scholar]
- D’Elia, V., Fynbo, J. P. U., Covino, S., et al. 2010, A&A, 523, A36 [NASA ADS] [CrossRef] [EDP Sciences] [Google Scholar]
- D’Elia, V., Fynbo, J. P. U., Goldoni, P., et al. 2014, A&A, 564, A38 [NASA ADS] [CrossRef] [EDP Sciences] [Google Scholar]
- Devereux, N. A., & Young, J. S. 1990, ApJ, 359, 42 [NASA ADS] [CrossRef] [Google Scholar]
- Dobbs, C. L., & Pringle, J. E. 2013, MNRAS, 432, 653 [NASA ADS] [CrossRef] [Google Scholar]
- Dobbs, C. L., Krumholz, M. R., Ballesteros-Paredes, J., et al. 2014, Protostars and Planets VI, 3–26 [Google Scholar]
- Doyle, M. T., & Drinkwater, M. J. 2006, MNRAS, 372, 977 [NASA ADS] [CrossRef] [Google Scholar]
- Draine, B. T., & Hao, L. 2002, ApJ, 569, 780 [NASA ADS] [CrossRef] [Google Scholar]
- Dunne, L., Ivison, R. J., Maddox, S., et al. 2009, MNRAS, 394, 3 [NASA ADS] [CrossRef] [Google Scholar]
- Elliott, J., Greiner, J., Khochfar, S., et al. 2012, A&A, 539, A113 [NASA ADS] [CrossRef] [EDP Sciences] [Google Scholar]
- Elliott, J., Krühler, T., Greiner, J., et al. 2013, A&A, 556, A23 [NASA ADS] [CrossRef] [EDP Sciences] [Google Scholar]
- Elmegreen, B. G. 2000, ApJ, 530, 277 [NASA ADS] [CrossRef] [Google Scholar]
- Endo, A., Kohno, K., Hatsukade, B., et al. 2007, ApJ, 659, 1431 [NASA ADS] [CrossRef] [Google Scholar]
- Foley, S., Watson, D., Gorosabel, J., et al. 2006, A&A, 447, 891 [NASA ADS] [CrossRef] [EDP Sciences] [Google Scholar]
- Fox, D. W., Price, P. A., Soderberg, A. M., et al. 2003, ApJ, 586, L5 [NASA ADS] [CrossRef] [Google Scholar]
- Frail, D. A., Kulkarni, S. R., Berger, E., & Wieringa, M. H. 2003, AJ, 125, 2299 [NASA ADS] [CrossRef] [Google Scholar]
- Friis, M., De Cia, A., Krühler, T., et al. 2015, MNRAS, 451, 4686 [Google Scholar]
- Fukui, Y., Mizuno, N., Yamaguchi, R., et al. 1999, PASJ, 51, 745 [NASA ADS] [CrossRef] [Google Scholar]
- Fumagalli, M., & Gavazzi, G. 2008, A&A, 490, 571 [NASA ADS] [CrossRef] [EDP Sciences] [Google Scholar]
- Fynbo, J. P. U., Starling, R. L. C., Ledoux, C., et al. 2006, A&A, 451, L47 [NASA ADS] [CrossRef] [EDP Sciences] [Google Scholar]
- Fynbo, J. P. U., Prochaska, J. X., Sommer-Larsen, J., Dessauges-Zavadsky, M., & Møller, P. 2008, ApJ, 683, 321 [NASA ADS] [CrossRef] [Google Scholar]
- Giovanelli, R., Haynes, M. P., Kent, B. R., et al. 2005, AJ, 130, 2598 [NASA ADS] [CrossRef] [Google Scholar]
- Glover, S. C. O., & Clark, P. C. 2012, MNRAS, 421, 9 [NASA ADS] [Google Scholar]
- Gordon, K. D., Clayton, G. C., Misselt, K. A., Landolt, A. U., & Wolff, M. J. 2003, ApJ, 594, 279 [NASA ADS] [CrossRef] [EDP Sciences] [Google Scholar]
- Graham, J. F., Fruchter, A. S., Kewley, L. J., et al. 2009, in AIP Conf. Ser. 1133, eds. C. Meegan, C. Kouveliotou, & N. Gehrels, 269 [Google Scholar]
- Grand, R. J. J., Kawata, D., & Cropper, M. 2015, MNRAS, 447, 4018 [NASA ADS] [CrossRef] [Google Scholar]
- Greiner, J., Fox, D. B., Schady, P., et al. 2015, ApJ, 809, 76 [NASA ADS] [CrossRef] [Google Scholar]
- Grossi, M., Hunt, L. K., Madden, S., et al. 2010, A&A, 518, L52 [NASA ADS] [CrossRef] [EDP Sciences] [Google Scholar]
- Han, X. H., Hammer, F., Liang, Y. C., et al. 2010, A&A, 514, A24 [NASA ADS] [CrossRef] [EDP Sciences] [Google Scholar]
- Hartmann, L., Ballesteros-Paredes, J., & Bergin, E. A. 2001, ApJ, 562, 852 [NASA ADS] [CrossRef] [Google Scholar]
- Hashimoto, T., Perley, D. A., Ohta, K., et al. 2015, ApJ, 806, 250 [NASA ADS] [CrossRef] [Google Scholar]
- Hatsukade, B., Kohno, K., Endo, A., et al. 2007, PASJ, 59, 67 [NASA ADS] [CrossRef] [Google Scholar]
- Hatsukade, B., Kohno, K., Endo, A., Nakanishi, K., & Ohta, K. 2011, ApJ, 738, 33 [NASA ADS] [CrossRef] [Google Scholar]
- Hatsukade, B., Ohta, K., Endo, A., et al. 2014, Nature, 510, 247 [NASA ADS] [CrossRef] [Google Scholar]
- Hirashita, H., & Hunt, L. K. 2006, A&A, 460, 67 [NASA ADS] [CrossRef] [EDP Sciences] [Google Scholar]
- Hjorth, J., Sollerman, J., Møller, P., et al. 2003, Nature, 423, 847 [NASA ADS] [CrossRef] [PubMed] [Google Scholar]
- Hjorth, J., Malesani, D., Jakobsson, P., et al. 2012, ApJ, 756, 187 [NASA ADS] [CrossRef] [Google Scholar]
- Huang, S., Haynes, M. P., Giovanelli, R., et al. 2012, AJ, 143, 133 [NASA ADS] [CrossRef] [Google Scholar]
- Hunt, L. K., Palazzi, E., Michałowski, M. J., et al. 2014a, A&A, 565, A112 [NASA ADS] [CrossRef] [EDP Sciences] [Google Scholar]
- Hunt, L. K., Testi, L., Casasola, V., et al. 2014b, A&A, 561, A49 [NASA ADS] [CrossRef] [EDP Sciences] [Google Scholar]
- Hunter, D. A., Ficut-Vicas, D., Ashley, T., et al. 2012, AJ, 144, 134 [NASA ADS] [CrossRef] [Google Scholar]
- Ibar, E., Ivison, R. J., Best, P. N., et al. 2010, MNRAS, 401, L53 [NASA ADS] [CrossRef] [Google Scholar]
- Iglesias-Páramo, J., Buat, V., Hernández-Fernández, J., et al. 2007, ApJ, 670, 279 [NASA ADS] [CrossRef] [Google Scholar]
- Izotov, Y. I., Guseva, N. G., Fricke, K. J., Krügel, E., & Henkel, C. 2014, A&A, 570, A97 [NASA ADS] [CrossRef] [EDP Sciences] [Google Scholar]
- Jakobsson, P., Hjorth, J., Malesani, D., et al. 2012, ApJ, 752, 62 [NASA ADS] [CrossRef] [Google Scholar]
- Jarrett, T. H., Chester, T., Cutri, R., et al. 2000, AJ, 119, 2498 [NASA ADS] [CrossRef] [Google Scholar]
- Jeffries, R. D., Littlefair, S. P., Naylor, T., & Mayne, N. J. 2011, MNRAS, 418, 1948 [NASA ADS] [CrossRef] [Google Scholar]
- Joye, W. A., Mandel, E. 2003, in Astronomical Data Analysis Software and Systems XII, eds H. E. Payne, R. I. Jedrzejewski, & R. N. Hook, ASP Conf. Ser., 489, 295 [Google Scholar]
- Kawamura, A., Mizuno, Y., Minamidani, T., et al. 2009, ApJS, 184, 1 [NASA ADS] [CrossRef] [Google Scholar]
- Kennicutt, R. C. 1998a, ARA&A, 36, 189 [Google Scholar]
- Kennicutt, R. C. Jr. 1998b, ApJ, 498, 541 [NASA ADS] [CrossRef] [Google Scholar]
- Kistler, M. D., Yüksel, H., Beacom, J. F., Hopkins, A. M., & Wyithe, J. S. B. 2009, ApJ, 705, L104 [NASA ADS] [CrossRef] [Google Scholar]
- Kohn, S. A., Michałowski, M. J., Bourne, N., et al. 2015, MNRAS, 448, 1494 [NASA ADS] [CrossRef] [Google Scholar]
- Kohno, K., Tosaki, T., Okuda, T., et al. 2005, PASJ, 57, 147 [NASA ADS] [CrossRef] [Google Scholar]
- Krühler, T., Greiner, J., Schady, P., et al. 2011, A&A, 534, A108 [NASA ADS] [CrossRef] [EDP Sciences] [Google Scholar]
- Krühler, T., Fynbo, J. P. U., Geier, S., et al. 2012a, A&A, 546, A8 [NASA ADS] [CrossRef] [EDP Sciences] [Google Scholar]
- Krühler, T., Malesani, D., Milvang-Jensen, B., et al., 2012b, ApJ, 758, 46 [NASA ADS] [CrossRef] [Google Scholar]
- Krühler, T., Ledoux, C., Fynbo, J. P. U., et al. 2013, A&A, 557, A18 [NASA ADS] [CrossRef] [EDP Sciences] [Google Scholar]
- Krumholz, M. R. 2012, ApJ, 759, 9 [NASA ADS] [CrossRef] [Google Scholar]
- Krumholz, M. R., Matzner, C. D., & McKee, C. F. 2006, ApJ, 653, 361 [NASA ADS] [CrossRef] [Google Scholar]
- Lagos, C. D. P., Baugh, C. M., Lacey, C. G., et al. 2011, MNRAS, 418, 1649 [NASA ADS] [CrossRef] [Google Scholar]
- Lagos, C.d.P., Bayet, E., Baugh, C. M., et al. 2012, MNRAS, 426, 2142 [NASA ADS] [CrossRef] [Google Scholar]
- Lagos, C. D. P., Baugh, C. M., Zwaan, M. A., et al. 2014, MNRAS, 440, 920 [NASA ADS] [CrossRef] [Google Scholar]
- Le Floc’h, E., Charmandaris, V., Forrest, W. J., et al. 2006, ApJ, 642, 636 [NASA ADS] [CrossRef] [Google Scholar]
- Le Floc’h, E., Charmandaris, V., Gordon, K., et al. 2012, ApJ, 746, 7 [NASA ADS] [CrossRef] [Google Scholar]
- Lee, J. C., Gil de Paz, A., Tremonti, C., et al. 2009, ApJ, 706, 599 [NASA ADS] [CrossRef] [Google Scholar]
- Leroy, A., Cannon, J., Walter, F., Bolatto, A., & Weiss, A. 2007, ApJ, 663, 990 [NASA ADS] [CrossRef] [MathSciNet] [Google Scholar]
- Leroy, A. K., Walter, F., Brinks, E., et al. 2008, AJ, 136, 2782 [NASA ADS] [CrossRef] [Google Scholar]
- Levan, A. J., Tanvir, N. R., Wiersema, K., & O’Brien, P. T. 2011, GRB Coordinates Network, Circular Service, 12414, 1 [Google Scholar]
- Levesque, E. M., Berger, E., Kewley, L. J., & Bagley, M. M. 2010a, AJ, 139, 694 [NASA ADS] [CrossRef] [Google Scholar]
- Levesque, E. M., Kewley, L. J., Graham, J. F., & Fruchter, A. S., 2010b, ApJ, 712, L26 [NASA ADS] [CrossRef] [Google Scholar]
- Levesque, E. M., Berger, E., Soderberg, A. M., & Chornock, R. 2011, ApJ, 739, 23 [NASA ADS] [CrossRef] [Google Scholar]
- Magdis, G. E., Daddi, E., Elbaz, D., et al. 2011, ApJ, 740, L15 [Google Scholar]
- Magnelli, B., Saintonge, A., Lutz, D., et al. 2012, A&A, 548, A22 [NASA ADS] [CrossRef] [EDP Sciences] [Google Scholar]
- Marks, M., Kroupa, P., Dabringhausen, J., & Pawlowski, M. S. 2012, MNRAS, 422, 2246 [NASA ADS] [CrossRef] [Google Scholar]
- Martin, C., Barlow, T., Barnhart, W., et al. 2003, in Future EUV/UV and Visible Space Astrophysics Missions and Instrumentation, eds. J. Chris Blades, & Oswald H. W. Siegmund, SPIE Conf., 4854, 336 [Google Scholar]
- Martin, D. C., Fanson, J., Schiminovich, D., et al. 2005, ApJ, 619, L1 [Google Scholar]
- Mazzali, P. A., Deng, J., Pian, E., et al. 2006, ApJ, 645, 1323 [NASA ADS] [CrossRef] [Google Scholar]
- Michałowski, M. J., Hjorth, J., Castro Cerón, J. M., & Watson, D. 2008, ApJ, 672, 817 [NASA ADS] [CrossRef] [Google Scholar]
- Michałowski, M. J., Hjorth, J., Malesani, D., et al. 2009, ApJ, 693, 347 [NASA ADS] [CrossRef] [Google Scholar]
- Michałowski, M. J., Hjorth, J., & Watson, D. 2010a, A&A, 514, A67 [NASA ADS] [CrossRef] [EDP Sciences] [Google Scholar]
- Michałowski, M. J., Watson, D., & Hjorth, J. 2010b, ApJ, 712, 942 [NASA ADS] [CrossRef] [Google Scholar]
- Michałowski, M., Xu, D., Stevens, J., et al. 2011, GRB Coordinates Network, Circular Service, 12422, 1 [Google Scholar]
- Michałowski, M. J., Dunlop, J. S., Cirasuolo, M., et al., 2012a, A&A, 541, A85 [NASA ADS] [CrossRef] [EDP Sciences] [Google Scholar]
- Michałowski, M. J., Kamble, A., Hjorth, J., et al. 2012b, ApJ, 755, 85 [NASA ADS] [CrossRef] [Google Scholar]
- Michałowski, M. J., Hayward, C. C., Dunlop, J. S., et al., 2014a, A&A, 571, A75 [NASA ADS] [CrossRef] [EDP Sciences] [Google Scholar]
- Michałowski, M. J., Hunt, L. K., Palazzi, E., et al. 2014b, A&A, 562, A70 [NASA ADS] [CrossRef] [EDP Sciences] [Google Scholar]
- Milvang-Jensen, B., Fynbo, J. P. U., Malesani, D., et al. 2012, ApJ, 756, 25 [NASA ADS] [CrossRef] [Google Scholar]
- Modjaz, M., Kewley, L., Kirshner, R. P., et al. 2008, AJ, 135, 1136 [NASA ADS] [CrossRef] [Google Scholar]
- Myers, A. T., Krumholz, M. R., Klein, R. I., & McKee, C. F. 2011, ApJ, 735, 49 [NASA ADS] [CrossRef] [Google Scholar]
- Nicuesa Guelbenzu, A., Klose, S., Michałowski, M. J., et al. 2014, ApJ, 789, 45 [NASA ADS] [CrossRef] [Google Scholar]
- Ofek, E. O., Cenko, S. B., Gal-Yam, A., et al. 2006, GRB Coordinates Network, Circular Service, 5123, 1 [NASA ADS] [Google Scholar]
- Ofek, E. O., Cenko, S. B., Gal-Yam, A., et al. 2007, ApJ, 662, 1129 [NASA ADS] [CrossRef] [Google Scholar]
- Olivares, E. F., Greiner, J., Schady, P., et al. 2012, A&A, 539, A76 [NASA ADS] [CrossRef] [EDP Sciences] [Google Scholar]
- Ott, J., Stilp, A. M., Warren, S. R., et al. 2012, AJ, 144, 123 [NASA ADS] [CrossRef] [Google Scholar]
- Perley, D. A., & Perley, R. A. 2013, ApJ, 778, 172 [NASA ADS] [CrossRef] [Google Scholar]
- Perley, D. A., Levan, A. J., Tanvir, N. R., et al. 2013, ApJ, 778, 128 [NASA ADS] [CrossRef] [Google Scholar]
- Perley, D. A., Krühler, T., Schulze, S., et al. 2015a, ApJ, submitted ArXiv eprints [arXiv:1504.02482] [Google Scholar]
- Perley, D. A., Perley, R. A., Hjorth, J., et al. 2015b, ApJ, 801, 102 [NASA ADS] [CrossRef] [Google Scholar]
- Perley, D. A., Tanvir, N. R., Hjorth, J., et al. 2015c, ApJ, submitted ArXiv eprints [arXiv:1504.02479] [Google Scholar]
- Petit, A. C., Krumholz, M. R., Goldbaum, N. J., & Forbes, J. C. 2015, MNRAS, 449, 2588 [NASA ADS] [CrossRef] [Google Scholar]
- Pontzen, A., Deason, A., Governato, F., et al. 2010, MNRAS, 402, 1523 [NASA ADS] [CrossRef] [Google Scholar]
- Porter, S. C., Raychaudhury, S., Pimbblet, K. A., & Drinkwater, M. J. 2008, MNRAS, 388, 1152 [NASA ADS] [Google Scholar]
- Prochaska, J. X., & Wolfe, A. M. 2009, ApJ, 696, 1543 [NASA ADS] [CrossRef] [Google Scholar]
- Prochaska, J. X., Bloom, J. S., Chen, H. W., et al. 2004, ApJ, 611, 200 [NASA ADS] [CrossRef] [Google Scholar]
- Prochaska, J. X., Chen, H. W., Bloom, J. S., et al. 2007a, ApJS, 168, 231 [NASA ADS] [CrossRef] [Google Scholar]
- Prochaska, J. X., Chen, H. W., Dessauges-Zavadsky, M., & Bloom, J. S., 2007b, ApJ, 666, 267 [NASA ADS] [CrossRef] [Google Scholar]
- Prochaska, J. X., Sheffer, Y., Perley, D. A., et al. 2009, ApJ, 691, L27 [NASA ADS] [CrossRef] [Google Scholar]
- Reggiani, M., Robberto, M., Da Rio, N., et al. 2011, A&A, 534, A83 [NASA ADS] [CrossRef] [EDP Sciences] [Google Scholar]
- Robertson, B. E., & Ellis, R. S. 2012, ApJ, 744, 95 [NASA ADS] [CrossRef] [Google Scholar]
- Rossi, A., Piranomonte, S., Savaglio, S., et al. 2014, A&A, 572, A47 [NASA ADS] [CrossRef] [EDP Sciences] [Google Scholar]
- Roychowdhury, S., Chengalur, J. N., Kaisin, S. S., & Karachentsev, I. D. 2014, MNRAS, 445, 1392 [NASA ADS] [CrossRef] [Google Scholar]
- Saintonge, A., Kauffmann, G., Kramer, C., et al. 2011, MNRAS, 415, 32 [NASA ADS] [CrossRef] [Google Scholar]
- Salim, S., Rich, R. M., Charlot, S., et al. 2007, ApJS, 173, 267 [NASA ADS] [CrossRef] [Google Scholar]
- Salpeter, E. E. 1955, ApJ, 121, 161 [Google Scholar]
- Sánchez Almeida, J., Muñoz-Tuñón, C., Elmegreen, D. M., Elmegreen, B. G., & Méndez-Abreu, J. 2013, ApJ, 767, 74 [NASA ADS] [CrossRef] [Google Scholar]
- Sánchez Almeida, J., Morales-Luis, A. B., Muñoz-Tuñón, C., et al. 2014, ApJ, 783, 45 [NASA ADS] [CrossRef] [Google Scholar]
- Sanders, D. B., Scoville, N. Z., & Soifer, B. T. 1991, ApJ, 370, 158 [NASA ADS] [CrossRef] [Google Scholar]
- Sault, R. J., Teuben, P. J., Wright, M. C. H. 1995, in Astronomical Data Analysis Software and Systems IV, eds. R. A. Shaw, H. E. Payne, J. J. E. Hayes, ASP Conf. Ser., 433 [Google Scholar]
- Sault, R. J., Killeen, N. E. B. 2004, The Miriad User’s Guide. Australia Telescope National Facility, Sydney, (www.atnf.csiro.au/computing/software/miriad/) [Google Scholar]
- Savaglio, S. 2006, New J. Phys., 8, 195 [NASA ADS] [CrossRef] [Google Scholar]
- Savaglio, S., Glazebrook, K., & LeBorgne, D. 2009, ApJ, 691, 182 [NASA ADS] [CrossRef] [MathSciNet] [Google Scholar]
- Savaglio, S., Rau, A., Greiner, J., et al. 2012, MNRAS, 420, 627 [NASA ADS] [CrossRef] [Google Scholar]
- Schady, P., Savaglio, S., Müller, T., et al. 2014, A&A, 570, A52 [NASA ADS] [CrossRef] [EDP Sciences] [Google Scholar]
- Schady, P., Krühler, T., Greiner, J., et al. 2015, A&A, 579, A126 [NASA ADS] [CrossRef] [EDP Sciences] [Google Scholar]
- Schulze, S., Malesani, D., Cucchiara, A., et al. 2014, A&A, 566, A102 [NASA ADS] [CrossRef] [EDP Sciences] [Google Scholar]
- Schulze, S., Chapman, R., Hjorth, J., et al. 2015, ApJ, 808, 73 [NASA ADS] [CrossRef] [Google Scholar]
- Silva, L., Granato, G. L., Bressan, A., & Danese, L. 1998, ApJ, 509, 103 [NASA ADS] [CrossRef] [Google Scholar]
- Skrutskie, M. F., Cutri, R. M., Stiening, R., et al. 2006, AJ, 131, 1163 [NASA ADS] [CrossRef] [Google Scholar]
- Sollerman, J., Östlin, G., Fynbo, J. P. U., et al. 2005, New Astron., 11, 103 [NASA ADS] [CrossRef] [Google Scholar]
- Solomon, P. M., Downes, D., Radford, S. J. E., & Barrett, J. W. 1997, ApJ, 478, 144 [NASA ADS] [CrossRef] [Google Scholar]
- Springob, C. M., Haynes, M. P., Giovanelli, R., & Kent, B. R. 2005, ApJS, 160, 149 [Google Scholar]
- Stanek, K. Z., Matheson, T., Garnavich, P. M., et al. 2003, ApJ, 591, L17 [NASA ADS] [CrossRef] [Google Scholar]
- Stanway, E. R., Davies, L. J. M., & Levan, A. J. 2010, MNRAS, 409, L74 [NASA ADS] [CrossRef] [Google Scholar]
- Stanway, E. R., Bremer, M. N., Tanvir, N. R., Levan, A. J., & Davies, L. J. M. 2011, MNRAS, 410 1496 [Google Scholar]
- Stanway, E. R., Levan, A. J., & Davies, L. J. M. 2014, MNRAS, 444, 2133 [NASA ADS] [CrossRef] [Google Scholar]
- Stanway, E. R., Levan, A. J., Tanvir, N., et al. 2015a, MNRAS, 446, 3911 [NASA ADS] [CrossRef] [Google Scholar]
- Stanway, E. R., Levan, A. J., Tanvir, N. R., Wiersema, K., & van der Laan, T. P. R. 2015b, ApJ, 798, L7 [NASA ADS] [CrossRef] [Google Scholar]
- Starling, R. L. C., Wiersema, K., Levan, A. J., et al. 2011, MNRAS, 411, 2792 [NASA ADS] [CrossRef] [Google Scholar]
- Stilp, A. M., Dalcanton, J. J., Warren, S. R., et al. 2013, ApJ, 765, 136 [NASA ADS] [CrossRef] [Google Scholar]
- Svensson, K. M., Levan, A. J., Tanvir, N. R., Fruchter, A. S., & Strolger, L. 2010, MNRAS, 405, 57 [NASA ADS] [Google Scholar]
- Symeonidis, M., Oates, S. R., de Pasquale, M., et al. 2014, MNRAS, 443, L124 [NASA ADS] [CrossRef] [Google Scholar]
- Tan, J. C., Krumholz, M. R., & McKee, C. F. 2006, ApJ, 641, L121 [NASA ADS] [CrossRef] [Google Scholar]
- Theureau, G., Bottinelli, L., Coudreau-Durand, N., et al. 1998, A&AS, 130, 333 [Google Scholar]
- Thöne, C. C., Fynbo, J. P. U., Östlin, G., et al. 2008, ApJ, 676, 1151 [NASA ADS] [CrossRef] [Google Scholar]
- Thöne, C. C., Christensen, L., Prochaska, J. X., et al. 2014, MNRAS, 441, 2034 [NASA ADS] [CrossRef] [Google Scholar]
- Tinney, C., Stathakis, R., Cannon, R., et al. 1998, IAU Circ. 6896 [Google Scholar]
- Tumlinson, J., Prochaska, J. X., Chen, H. W., Dessauges-Zavadsky, M., & Bloom, J. S. 2007, ApJ, 668, 667 [NASA ADS] [CrossRef] [Google Scholar]
- van den Heuvel, E. P. J., & Portegies Zwart, S. F. 2013, ApJ, 779, 114 [NASA ADS] [CrossRef] [EDP Sciences] [Google Scholar]
- van der Horst, A. J., Rol, E., Wijers, R. A. M. J., et al. 2005, ApJ, 634, 1166 [NASA ADS] [CrossRef] [Google Scholar]
- Vergani, S. D., D’Avanzo, P., Levan, A. J., et al. 2010, GRB Coordinates Network, Circular Service, 10512, 1 [Google Scholar]
- Vergani, S. D., Salvaterra, R., Japelj, J., et al. 2015, A&A, 581, A102 [NASA ADS] [CrossRef] [EDP Sciences] [Google Scholar]
- Vreeswijk, P. M., Fender, R. P., Garrett, M. A., et al. 2001, A&A, 380, L21 [NASA ADS] [CrossRef] [EDP Sciences] [Google Scholar]
- Vreeswijk, P. M., Ellison, S. L., Ledoux, C., et al. 2004, A&A, 419, 927 [NASA ADS] [CrossRef] [EDP Sciences] [Google Scholar]
- Walter, F., Brinks, E., de Blok, W. J. G., et al. 2008, AJ, 136, 2563 [NASA ADS] [CrossRef] [Google Scholar]
- Wang, J., Kauffmann, G., Józsa, G. I. G., et al. 2013, MNRAS, 433, 270 [NASA ADS] [CrossRef] [Google Scholar]
- Watson, D., Hjorth, J., Fynbo, J. P. U., et al. 2007, ApJ, 660, L101 [NASA ADS] [CrossRef] [Google Scholar]
- Watson, D., French, J., Christensen, L., et al. 2011, ApJ, 741, 58 [NASA ADS] [CrossRef] [Google Scholar]
- Wiersema, K., van der Horst, A. J., Kann, D. A., et al. 2008, A&A, 481, 319 [NASA ADS] [CrossRef] [EDP Sciences] [Google Scholar]
- Wijesinghe, D. B., da Cunha, E., Hopkins, A. M., et al. 2011, MNRAS, 415, 1002 [NASA ADS] [CrossRef] [Google Scholar]
- Wilson, W. E., Ferris, R. H., Axtens, P., et al. 2011, MNRAS, 416, 832 [NASA ADS] [CrossRef] [Google Scholar]
- Woosley, S. E., & Heger, A. 2006, ApJ, 637, 914 [NASA ADS] [CrossRef] [Google Scholar]
- Wright, E. L. 2006, PASP, 118, 1711 [NASA ADS] [CrossRef] [Google Scholar]
- Xu, D., Michałowski, M., Stevens, J., & Edwards, P. 2011a, GRB Coordinates Network, 12435 [Google Scholar]
- Xu, D., Michałowski, M., Stevens, J., et al. 2011b, GRB Coordinates Network, 12421 [Google Scholar]
- Yang, C. C., Krumholz, M. 2012, ApJ, 758, 48 [NASA ADS] [CrossRef] [Google Scholar]
- Yoachim, P., McCommas, L. P., Dalcanton, J. J., & Williams, B. F. 2009, AJ, 137, 4697 [NASA ADS] [CrossRef] [Google Scholar]
- Yoon, S. C., & Langer, N. 2005, A&A, 443, 643 [NASA ADS] [CrossRef] [EDP Sciences] [Google Scholar]
- Yoon, S. C., Langer, N., & Norman, C. 2006, A&A, 460, 199 [NASA ADS] [CrossRef] [EDP Sciences] [Google Scholar]
- Young, J. S., Xie, S., Kenney, J. D. P., & Rice, W. L. 1989, ApJS, 70, 699 [NASA ADS] [CrossRef] [Google Scholar]
- Yüksel, H., Kistler, M. D., Beacom, J. F., & Hopkins, A. M. 2008, ApJ, 683, L5 [NASA ADS] [CrossRef] [Google Scholar]
- Zhang, W., Kong, X., Li, C., Zhou, H. Y., & Cheng, F. Z. 2007, ApJ, 655, 851 [NASA ADS] [CrossRef] [Google Scholar]
- Zwaan, M. A., Meyer, M. J., Staveley-Smith, L., & Webster, R. L. 2005, MNRAS, 359, L30 [NASA ADS] [CrossRef] [Google Scholar]
All Tables
All Figures
|
Fig. 1 Integrated H I line map of the GRB hosts (contours; positive/negative values are solid/dashed at −2, −1, 2, 3, 4σ, ...) on top of the optical images (Sollerman et al. 2005; Mazzali et al. 2006; Thöne et al. 2008; Starling et al. 2011). The spectrum was integrated in the frequency range shown as dotted lines in Fig. 2. North is up and east is to the left. The images are 30′′ × 30′′ except for GRB 980425, for which it is 100′′ × 100′′. The scale is indicated on each panel. The FWHM beam sizes of the H I data are shown as filled ellipses. The blue circles show the GRB positions. The map for the GRB 111005A host is not shown, as we use archival data with poor spatial resolution (Sect. 2.1). To estimate the H I properties for the GRB 060505 host only the central source was used. The north-western source is at the same redshift (Fig. 2) and is analysed separately (Table 4 and Sect. 4.3). |
| In the text | |
|
Fig. 2 H i spectra of the GRB hosts (histograms) with the Gaussian fit overplotted (red lines). These fits are presented only for illustration, as the total fluxes were determined from the direct integration of the spectra (Sect. 3.1). Vertical dotted lines show the frequency range used to measure the total H I emission and to produce the integrated H I maps (Fig. 1). The spectrum marked “060505comp” corresponds to the companion object north-west of the GRB 060505 position (Fig. 1). |
| In the text | |
|
Fig. 3 H i mass as a function of infrared/radio-based star formation rate (SFR) of GRB hosts (red circles) and other galaxies, as indicated in the legend and described in Sect. 2.2. The solid black line is a linear fit to all the data (Eq. (1)). GRB hosts are consistent with the general star-forming galaxy population. |
| In the text | |
|
Fig. 4 H i mass as a function of stellar mass of GRB hosts (red circles) and other galaxies, as indicated in the legend and described in Sect. 2.2. GRB hosts are consistent with the general star-forming galaxy population. |
| In the text | |
|
Fig. 5 H i mass as a function of dust mass of GRB hosts (red circles) and other galaxies, as indicated in the legend and described in Sect. 2.2. Dotted lines denote constant gas-to-dust mass ratios with values indicated on the left. GRB hosts are consistent with the general star-forming galaxy population, especially with the Herschel Reference Survey (HRS) galaxies with similarly measured dust masses. |
| In the text | |
|
Fig. 6 Optical (first column; Sollerman et al. 2005; Mazzali et al. 2006; Thöne et al. 2008; Starling et al. 2011, and this work) and radio continuum images centred at 2800, 2340, 1860, and 1340 GHz. North is up and east is to the left. Each panel is 30′′ × 30′′ The FWHM beam size is shown on each radio panel as an ellipse. The blue circles show the GRB positions. |
| In the text | |
Current usage metrics show cumulative count of Article Views (full-text article views including HTML views, PDF and ePub downloads, according to the available data) and Abstracts Views on Vision4Press platform.
Data correspond to usage on the plateform after 2015. The current usage metrics is available 48-96 hours after online publication and is updated daily on week days.
Initial download of the metrics may take a while.