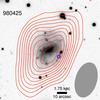
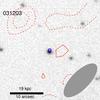
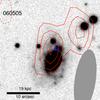
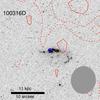
Fig. 1
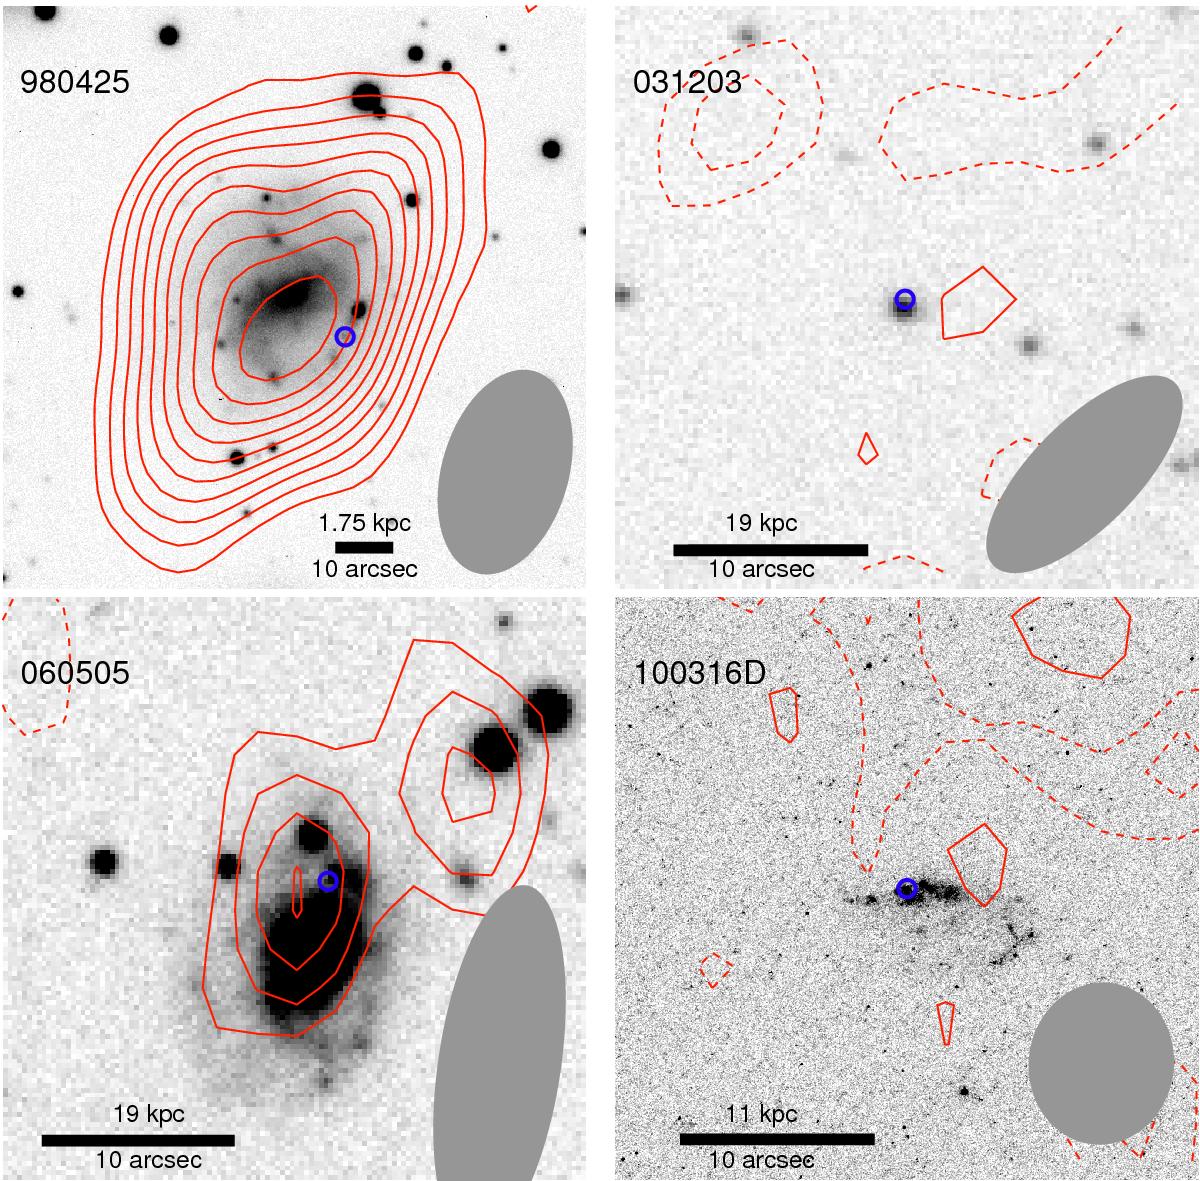
Integrated H I line map of the GRB hosts (contours; positive/negative values are solid/dashed at −2, −1, 2, 3, 4σ, ...) on top of the optical images (Sollerman et al. 2005; Mazzali et al. 2006; Thöne et al. 2008; Starling et al. 2011). The spectrum was integrated in the frequency range shown as dotted lines in Fig. 2. North is up and east is to the left. The images are 30′′ × 30′′ except for GRB 980425, for which it is 100′′ × 100′′. The scale is indicated on each panel. The FWHM beam sizes of the H I data are shown as filled ellipses. The blue circles show the GRB positions. The map for the GRB 111005A host is not shown, as we use archival data with poor spatial resolution (Sect. 2.1). To estimate the H I properties for the GRB 060505 host only the central source was used. The north-western source is at the same redshift (Fig. 2) and is analysed separately (Table 4 and Sect. 4.3).
Current usage metrics show cumulative count of Article Views (full-text article views including HTML views, PDF and ePub downloads, according to the available data) and Abstracts Views on Vision4Press platform.
Data correspond to usage on the plateform after 2015. The current usage metrics is available 48-96 hours after online publication and is updated daily on week days.
Initial download of the metrics may take a while.