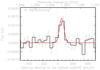
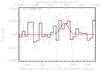
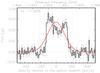
Fig. 2
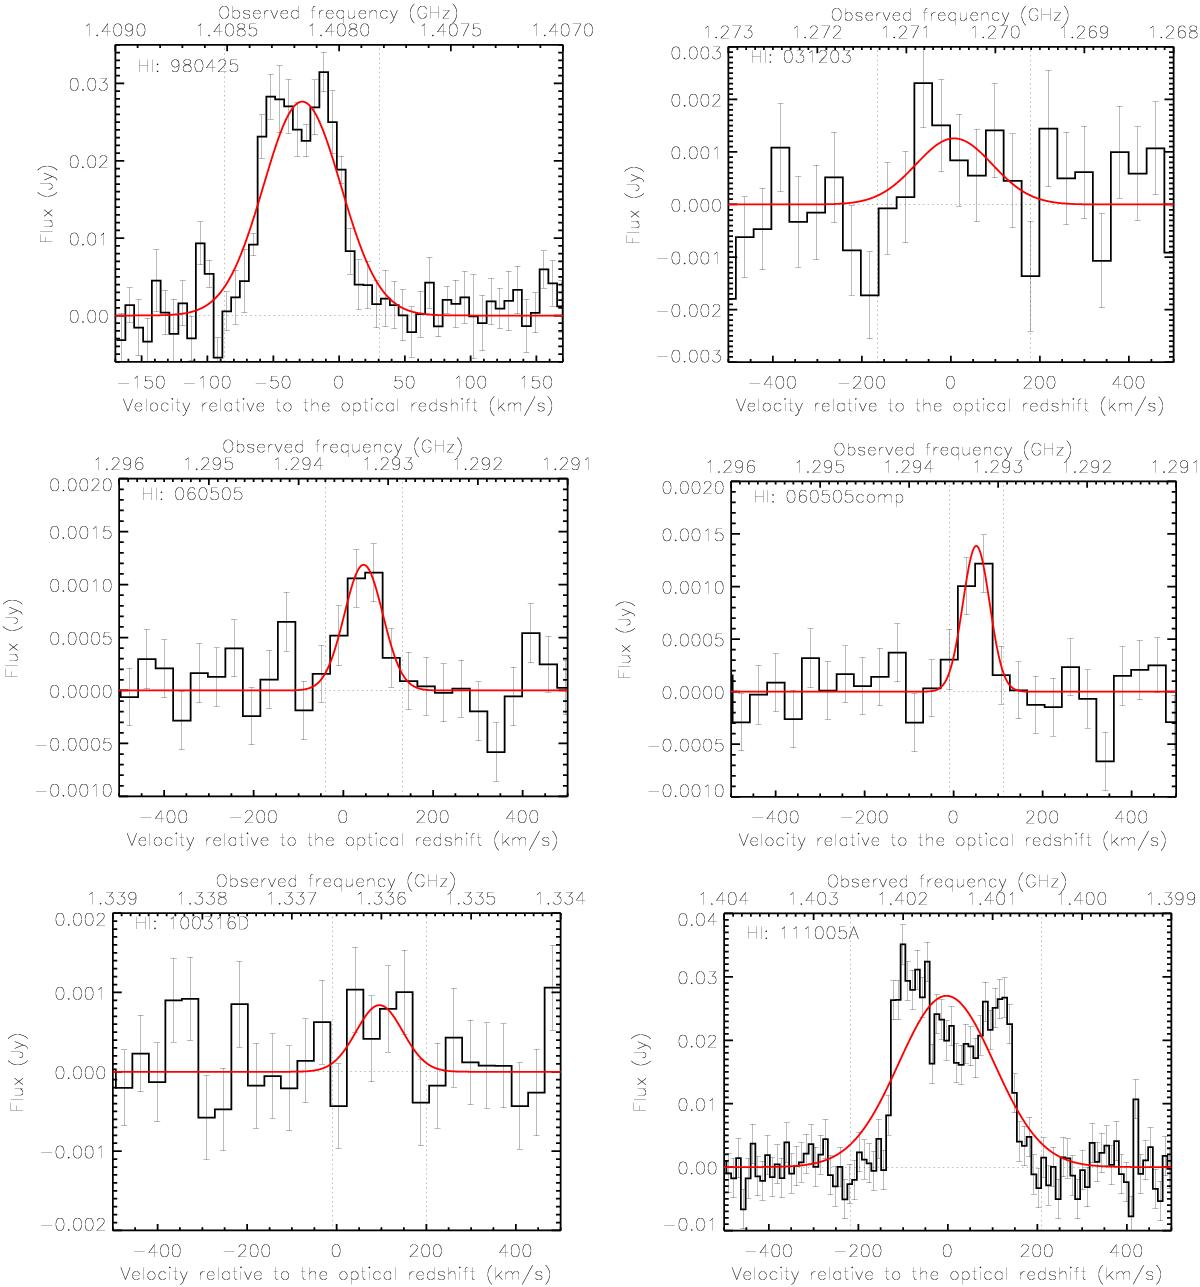
H i spectra of the GRB hosts (histograms) with the Gaussian fit overplotted (red lines). These fits are presented only for illustration, as the total fluxes were determined from the direct integration of the spectra (Sect. 3.1). Vertical dotted lines show the frequency range used to measure the total H I emission and to produce the integrated H I maps (Fig. 1). The spectrum marked “060505comp” corresponds to the companion object north-west of the GRB 060505 position (Fig. 1).
Current usage metrics show cumulative count of Article Views (full-text article views including HTML views, PDF and ePub downloads, according to the available data) and Abstracts Views on Vision4Press platform.
Data correspond to usage on the plateform after 2015. The current usage metrics is available 48-96 hours after online publication and is updated daily on week days.
Initial download of the metrics may take a while.