| Issue |
A&A
Volume 582, October 2015
|
|
|---|---|---|
| Article Number | A67 | |
| Number of page(s) | 7 | |
| Section | Astrophysical processes | |
| DOI | https://doi.org/10.1051/0004-6361/201526478 | |
| Published online | 08 October 2015 | |
Very high-energy γ-ray observations of novae and dwarf novae with the MAGIC telescopes⋆
1
ETH Zurich,
8093
Zurich,
Switzerland
2
Università di Udine, and INFN Trieste, 33100
Udine,
Italy
3
INAF National Institute for Astrophysics,
00136
Rome,
Italy
4
Università di Siena, and INFN Pisa, 53100
Siena,
Italy
5
Croatian MAGIC Consortium, Rudjer Boskovic Institute, University
of Rijeka and University of Split, 10000
Zagreb,
Croatia
6
Saha Institute of Nuclear Physics, 1\AF Bidhannagar, Salt Lake, Sector-1,
700064
Kolkata,
India
7
Max-Planck-Institut für Physik, 80805
München,
Germany
8
Universidad Complutense, 28040
Madrid,
Spain
9
Inst. de Astrofísica de Canarias,
38200, La Laguna, Tenerife
Spain
10
University of Łódź, 90236
Lodz,
Poland
11
Deutsches Elektronen-Synchrotron (DESY),
15738
Zeuthen,
Germany
12
IFAE, Campus UAB, 08193
Bellaterra,
Spain
13
Universität Würzburg, 97074
Würzburg,
Germany
14
Centro de Investigaciones Energéticas, Medioambientales y
Tecnológicas, 28040
Madrid,
Spain
15
Università di Padova and INFN, 35131
Padova,
Italy
16
Institute of Space Sciences, 08193
Barcelona,
Spain
17
Technische Universität Dortmund, 44221
Dortmund,
Germany
18
Unitat de Física de les Radiacions, Departament de Física, and
CERES-IEEC, Universitat Autònoma de Barcelona, 08193
Bellaterra,
Spain
19
Universitat de Barcelona, ICC, IEEC-UB, 08028
Barcelona,
Spain
20
Japanese MAGIC Consortium, ICRR, The University of Tokyo,
Department of Physics and Hakubi Center, Kyoto University, Tokai University, The
University of Tokushima, KEK, 770-0855
Tokushima,
Japan
21
Finnish MAGIC Consortium, Tuorla Observatory, University of Turku
and Department of Physics, University of Oulu, 90014
Oulu,
Finland
22
Inst. for Nucl. Research and Nucl. Energy,
1784
Sofia,
Bulgaria
23
Università di Pisa, and INFN Pisa, 56126
Pisa,
Italy
24
ICREA and Institute of Space Sciences,
08193
Barcelona,
Spain
25
Università dell’Insubria and INFN Milano Bicocca,
Como, 22100
Como,
Italy
26
Now at Centro Brasileiro de Pesquisas Físicas
(CBPF\MCTI), R. Dr. Xavier Sigaud,
150 – Urca, Rio de Janeiro –
RJ, 22290-180, Brazil
27
Now at NASA Goddard Space Flight Center, Greenbelt, MD 20771, USA
and Department of Physics and Department of Astronomy, University of
Maryland, College
Park, MD
20742,
USA
28
Humboldt University of Berlin, Institut für Physik Newtonstr.
15, 12489
Berlin,
Germany
29
Now at École polytechnique fédérale de Lausanne
(EPFL), Lausanne,
Switzerland
30
Now at Finnish Centre for Astronomy with ESO
(FINCA), Turku,
Finland
31 Also at INAF – Trieste, Italy
32 Also at ISDC – Science Data Center for Astrophysics, 1290
Versoix (Geneva), Switzerland
33
NASA Goddard Space Flight Center, Greenbelt, MD
20771,
USA
Received: 6 May 2015
Accepted: 17 August 2015
Abstract
Context. In the last five years the Fermi Large Area Telescope (LAT) instrument detected GeV γ-ray emission from five novae. The GeV emission can be interpreted in terms of an inverse Compton process of electrons accelerated in a shock. In this case it is expected that protons in the same conditions can be accelerated to much higher energies. Consequently they may produce a second component in the γ-ray spectrum at TeV energies.
Aims. We aim to explore the very high-energy domain to search for γ-ray emission above 50 GeV and to shed light on the acceleration process of leptons and hadrons in nova explosions.
Methods. We have performed observations, with the MAGIC telescopes of the classical nova V339 Del shortly after the 2013 outburst; optical and subsequent GeV γ-ray detections triggered the MAGIC observations. We also briefly report on VHE observations of the symbiotic nova YY Her and the dwarf nova ASASSN-13ax. We complement the TeV MAGIC observations with the analysis of contemporaneous Fermi-LAT data of the sources. The TeV and GeV observations are compared in order to evaluate the acceleration parameters for leptons and hadrons.
Results. No significant TeV emission was found from the studied sources. We computed upper limits on the spectrum and night-by-night flux. The combined GeV and TeV observations of V339 Del limit the ratio of proton to electron luminosities to Lp ≲ 0.15 Le.
Key words: novae, cataclysmic variables / gamma rays: stars / binaries: general / stars: activity
Appendix A is available in electronic form at http://www.aanda.org
Corresponding authors: J. Sitarek, This email address is being protected from spambots. You need JavaScript enabled to view it. ; W. Bednarek, This email address is being protected from spambots. You need JavaScript enabled to view it. ; R. López-Coto, This email address is being protected from spambots. You need JavaScript enabled to view it.
© ESO, 2015
1. Introduction
A classical nova is a thermonuclear runaway leading to the explosive ejection of the envelope accreted onto a white dwarf (WD) in a binary system in which the companion is either filling or nearly filling its Roche surface (Bode & Evans 2008; Starrfield et al. 2012; Woudt & Ribeiro 2014). Novae are a type of cataclysmic variable, i.e. optically variable binary systems with a mass transfer from a companion star to WD. Novae are typically detected first in optical observations when the brightness of the object increases by 7–16 mag. A thermal X-ray continuum is often seen in the energy spectra of novae. Symbiotic novae, like classical novae, are initiated by a thermonuclear explosion on the surface of the WD. In the case of symbiotic novae, however, the WD is deeply immersed in the wind of a late-type companion star (see e.g. Shore et al. 2011, 2012).
The diffusive shock acceleration at the blast wave of symbiotic novae was expected to accelerate particles up to energies of a few TeV (Tatischeff & Hernanz 2007). In 2010 the first GeV γ-ray emission was detected by the Fermi Large Area Telescope (LAT) from the symbiotic nova V407 Cyg (Abdo et al. 2010). The γ-ray emission can be explained in terms of leptonic or hadronic models (Abdo et al. 2010; Ackermann et al. 2014). The local radiation fields create a target for the inverse Compton (IC) scattering of the electrons. Protons accelerated in the same conditions can interact with the matter producing γ-rays via proton-proton interactions. Several models have been put forward to explain the GeV radiation. For instance, Sitarek & Bednarek (2012) attribute the GeV γ-ray emission to the IC process on the strong radiation field of the red giant. The same model predicts a second component in the TeV range due to proton-proton interactions with the wind of the red giant. Alternatively, Martin & Dubus (2013) consider acceleration of leptons and hadrons in the nova shock. In that model the magnetic field, which determines the acceleration efficiency, is obtained assuming an equipartition with the thermal energy density upstream of the shock resulting in the maximum energy of protons estimated to be ~300 GeV. The GeV γ-ray emission is then mostly expected from leptonic processes, namely the IC scattering of the nova light by the electrons accelerated in the shock.
In the last three years, Fermi-LAT has discovered GeV γ-ray emission from four additional novae, V1324 Sco, V959 Mon, V339 Del, and V1369 Cen (Cheung et al. 2013b; Ackermann et al. 2014). In addition Fermi-LAT has reported V745 Sco and Nova Sgr 2015 No. 2 as lower significance candidates (Cheung et al. 2014a, 2015). Most of these sources are classical novae. Contrary to the symbiotic novae, those do not exhibit the strong wind of the companion star, but still they all show similar spectral properties. In classical novae, particle acceleration can occur, for example, in a bow shock between the nova ejecta and the interstellar medium or in weaker internal shocks due to inhomogeneity of the nova ejecta (Ackermann et al. 2014). In particular, the orbital motion of the system can shape the nova ejecta into a faster polar wind and a slower region of denser material along the equatorial plane (Chomiuk et al. 2014). Metzger et al. (2015) suggest that the γ-ray emission might come from hadronic interactions of a faster outflow with an ejected shell.
So far, no very high-energy (VHE; E> 100 GeV) γ-ray emission has been detected from any nova event. VERITAS observations of the symbiotic nova V407 Cyg beginning 10 days after the nova explosion yielded a differential upper limit on the flux at 1.6 TeV of 2.3 × 10⁻¹² erg cm-2 s-1 (Aliu et al. 2012).
Since late 2012 the MAGIC collaboration has been conducting a nova follow-up program to detect a possible VHE γ-ray component. At first the program focused on symbiotic novae. After the reports of the detection of GeV emission from classical novae by the Fermi-LAT, the program was also extended to bright classical novae and opened up to additional outbursts from other cataclysmic variables.
In this paper we report on the observations performed with the MAGIC telescopes of V339 Del and present an updated analysis of Fermi-LAT data contemporaneous with those observations. In Sect. 2 we describe the MAGIC telescopes and the Fermi-LAT instrument. The observations of V339 Del are presented in Sect. 3. In Sect. 4 we discuss the results of the GeV–TeV observations of V339 Del in terms of a hadronic-leptonic model. In addition to the classical nova V339 Del, MAGIC also observed dwarf nova ASASSN-13ax and symbiotic nova YY Her. Neither GeV nor TeV γ-ray emission was detected from those two sources. The upper limits on these two objects are summarized in Appendix A while the main text of the paper focuses on V339 Del.
2. Instruments
V339 Del and the other outbursts observed by MAGIC were first detected and observed with optical instruments. The analysis of quasi-simultaneous Fermi-LAT observations provides additional context for the MAGIC results.
2.1. MAGIC telescopes
The VHE γ-ray observations were obtained using the MAGIC telescopes. MAGIC is a system of two 17 m Cherenkov telescopes located on the Canary Island of La Palma at a height of 2200 m a.s.l. (Aleksić et al. 2016a). The telescopes record γ-rays with energies above ~50 GeV. The sensitivity of the MAGIC telescopes in the best energy range (≳300 GeV) is ~0.6% of Crab Nebula flux in 50 h of observations (Aleksić et al. 2016b). The data were analysed using the standard analysis chain (Zanin et al. 2013; Aleksić et al. 2016b). The significance of γ-ray excess was computed according to Eq. (17) from Li & Ma (1983). The upper limits on the flux were calculated following the approach of Rolke et al. (2005) using a 95% confidence level (C.L.) and accounting for a possible 30% systematic uncertainty on the effective area of the instrument (Aleksić et al. 2016b).
2.2. Fermi-LAT
The Fermi-LAT, a space-based, pair-conversion telescope, detects photons with energies from 20 MeV to >300 GeV (Atwood et al. 2009). We analysed the LAT data in the energy range 100 MeV−300 GeV, using an unbinned maximum likelihood method (Mattox et al. 1996), as implemented in the Fermi science tools v9r32p5. We applied the P7REP_SOURCE_V15 LAT instrument response functions (IRFs) and used the associated standard Galactic and isotropic diffuse emission models matched to the Pass 7 reprocessed Source class event selection1. We selected events within a region of interest (ROI) of 15° in radius centred on the LAT best-fit position reported by Ackermann et al. (2014) for V339 Del and required a maximum zenith angle of 100° to avoid contamination by Earth limb photons. Because some of the LAT data were acquired during pointed mode observations, we applied an appropriate filter2, selecting good quality data at times when either the rocking angle was less than 52° or the edge of the analysis region did not exceed the maximum zenith angle at 100°. Sources from the 2FGL catalogue (Nolan et al. 2012) located within the ROI were included in the model used to perform the fitting procedure.
3. Observations of V339 Del and results
V339 Del was a fast, classical CO nova detected by optical observations on 2013 August 16 (CBET #3628), MJD 56 520. The nova was exceptionally bright, reaching a magnitude of V ~ 5 mag (see top panel of Fig. 1), and it triggered follow-up observations at frequencies ranging from radio to VHE γ-rays. Photometric measurements suggest a distance for V339 Del of 4.5 ± 0.6 kpc (Schaefer et al. 2014). Nearly a month after the optical detection, X-ray emission was detected in the 1–10 keV energy band by Swift/XRT (Page et al. 2013). Afterward, the object became a low-energy X-ray source with most of the photons detected in the 0.3–1 keV energy range (Osborne et al. 2013). The object shows large amplitude variations and a 54 s quasi-periodic oscillation in the soft X-ray energy band. These could be explained by the spin of the white dwarf or by an oscillation in the nuclear burning rate (Beardmore et al 2013; Ness et al. 2013). The spectroscopic observations performed on 2013 August 18 revealed emission wings extending to about ±2000 km s-1 and a Balmer absorption component at a velocity of (600 ± 50) km s-1 (Shore et al. 2013b). The preoutburst optical images revealed the progenitor of nova V339 Del to be a blue star (Denisenko et al. 2013).
Originally, MAGIC observations of V339 Del were motivated by its extreme optical outburst. The subsequent detection of GeV emission by the Fermi-LAT from the direction of V339 Del added incentive for VHE observations. MAGIC acquired data starting on the night of 2013 August 16, but these were marred by poor weather. The good quality data used for most of the analysis spans eight nights between 2013 August 25 and September 4. The total effective time was 11.6 h. In addition to the nightly upper limits we performed a dedicated analysis of the poor-quality (affected by Calima, a dust layer originating from Sahara) night of 2013 August 16. We applied an estimated energy and collection area correction based on LIDAR measurements (Fruck et al. 2014). No VHE γ-ray signal was found from the direction of V339 Del. We computed night-by-night integral upper limits above 300 GeV (see bottom panel of Fig. 1) and differential upper limits for the whole good quality data set in bins of energy (see Sect. 4).
Nova V339 Del was the subject of a Fermi Target of Opportunity (ToO) observation (Hays et al. 2013) triggered by the optical discovery (CBET #3628); a pointed observation favouring the nova started on 2013 August 16 and lasting for six days. The γ-ray emission from V339 Del was first detected by Fermi-LAT in a one-day bin on 2013 August 18 (Ackermann et al. 2014). The emission peaked on 2013 August 22 and afterward entered a slow decay phase (Fig. 1). We fitted the flux for the light curves shown in the middle panel of Fig. 1 by assuming a power-law spectral model with the normalization left free to vary and the photon index fixed to a single value. We selected a fixed value for the photon index of 2.3 by calculating the average of the most significant one-day bins (test statistic values TS > 9)3.
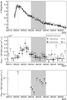 |
Fig. 1 Multiwavelength light curve of V339 Del during the outburst in August 2013. Top panel: optical observations in the V band obtained from the AAVSO-LCG4 service. Middle panel: the Fermi-LAT flux (filled symbols) and upper limits (empty symbols) above 100 MeV in one-day (circles, thin lines) or three-day (squares, thick lines) bins. A 95% C.L. flux upper limit is shown for time bins with TS < 4. Bottom panel: upper limit on the flux above 300 GeV observed with MAGIC telescopes. The grey band shows the observation nights with MAGIC. The dashed grey line shows a MAGIC observation night affected by bad weather. |
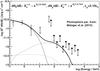 |
Fig. 2 Differential upper limits on the flux from V339 Del as measured by MAGIC (filled squares) and the flux measured by Fermi-LAT (empty crosses) in the same time period, 2013 August 25 to September 4. The thin solid line shows the IC scattering of thermal photons in the nova’s photosphere. The dashed line shows the γ-rays coming from the decay of π0 from hadronic interactions of the relativistic protons with the nova ejecta. The dotted line shows the contribution of γ-rays coming from IC of e+e− originating from π+π− decays. Thick solid lines show the total predicted spectrum. The total energy of electrons is 6 × 1041 erg and the assumed proton to electron luminosity ratio is Lp/Le = 0.1. Electrons and protons are injected with a power law with a spectral index of 1.5 and the cut-offs reported in the figures. Photosphere parameters (see Table 1) obtained from Metzger et al. (2015). |
The spectral energy distribution (SED) for V339 Del shown in Fig. 2 was extracted in 5 logarithmically spaced energy bins from 100 MeV to 100 GeV. Similar to the light curves, energy-binned data shown in Fig. 2 were fitted using a power law and calculating a 95% C.L. upper limit for bins with TS < 9. In the period coincident with the MAGIC observations (2013 August 25 to September 4), the Fermi-LAT spectrum can be described by a power law with an index of 2.4 ± 0.2 and flux above 100 MeV of (0.15 ± 0.04) × 10-6 ph cm-2 s-1. We only include statistical errors because they dominated over systematic errors in these data. The spectral fit for this period had a TS of 49 and did not permit a constraint on an exponential cut-off in energy. The Fermi-LAT analysis for the full decay phase, 2013 August 22 to September 12 (MJD 56 526–56 547), provided a more significant signal with a TS of 121 and a similar value of flux above 100 MeV, (0.13 ± 0.03) × 10-6 ph cm-2 s-1. The spectrum for the longer time period was fitted by an exponentially cut-off power law with an index of 1.4 ± 0.3 and a cut-off energy of 1.6 ± 0.8 GeV. The fit improved in significance by 3.3σ with respect to a power-law model. The most energetic photon associated with V339 Del (89% probability for the best-fit model) had an energy E = 5.9 GeV and was recorded on 2013 August 30, i.e., within the time period covered by the MAGIC observations.
4. Modeling of γ-rays from nova V339 Del
Of the three objects observed by the MAGIC telescopes and discussed in this paper, V339 Del is the only one detected at GeV energies by the Fermi-LAT. Extensive optical observations provided constraints on the companion star and the photosphere of the nova. Therefore V339 Del has the highest potential for constraining the leptonic and hadronic processes in novae, and we concentrate the modelling efforts on this source. We follow the modified model of Sitarek & Bednarek (2012). The original scenario was applied to the symbiotic nova V407 Cyg. In that case the GeV γ-ray emission was attributed to IC of the electrons on the strong radiation field in the vicinity of the red giant companion star. For V339 Del, however, the radiation field of the companion star is not as strong. The photosphere of the nova provides a dominant target for the IC process. Moreover, the wind of the companion star is not as dense as in the V407 Cyg symbiotic system. Nevertheless, if protons of sufficient energy are accelerated in the nova shock, they can interact with the ejecta of the nova producing pions that decay to γ-rays. As in Sitarek & Bednarek (2012) the GeV γ-ray emission can be used to constrain the parameters describing the acceleration of the electrons, which are otherwise poorly known. Protons are then accelerated in the same conditions, but up to much higher energies due to lower energy losses.
We need to evaluate the radiation field encountered by electrons at the time of the observations by MAGIC and Fermi-LAT to apply the above model. First, we need to estimate the parameters of the nova photosphere about ten days after the optical detection. The spectral evolution of the V339 Del was studied by Metzger et al. (2015). During the time of the observations by the MAGIC telescope, the reported temperature of the photosphere was ~7000 K. In the early phases of the nova (fireball stage), the optical observations were consistent with a pseudophotosphere with a temperature of about 10 000 K. With a reported optical luminosity of ~6 × 10⁴L⊙ this corresponds to a radius of the photosphere of 1.2 × 1013 cm (see Table 1). Following the approach of Shore et al. (2013a), we also used a second set of photosphere parameters in which UV emission, unavailable at this late stage of V339 outburst, is estimated using measurements of a similar source, namely OS And.
We now consider a photosphere of a radius Rph = 1013Rph,13cm and a temperature Tph = 104T4 K. The leptons and hadrons are accelerated at a distance of Rsh = 1013Rsh,13 cm from the photosphere. Assuming that the velocity of the shock is ~1000 km s-1, similar to that observed in another GeV-emitting nova (Chomiuk et al. 2014), we estimate that during the MAGIC observations the distance from the WD to the shock was Rsh ~ 1014 cm. The γ-rays with energy Eγ = 10E10 GeV can be produced via IC scattering in the Thomson regime of thermal photons by electrons with energy of ![Mathematical equation: \begin{eqnarray} E_{\rm e} = 22\times E_{10}^{1/2} / \left( T_4 (1+\cos\beta)\right)^{1/2} \, \mathrm{[GeV]}, \end{eqnarray}](/articles/aa/full_html/2015/10/aa26478-15/aa26478-15-eq39.png) (1)where β is the angle between the electron and the direction to the point on the photosphere where the thermal photon was emitted. On the other hand, by comparing the energy losses from the IC scattering with the acceleration rate, we obtain a maximum energy for electrons of (see e.g. Sitarek & Bednarek 2012)
(1)where β is the angle between the electron and the direction to the point on the photosphere where the thermal photon was emitted. On the other hand, by comparing the energy losses from the IC scattering with the acceleration rate, we obtain a maximum energy for electrons of (see e.g. Sitarek & Bednarek 2012) ![Mathematical equation: \begin{eqnarray} \label{eq:ee} E_{\rm e,\max} = 13 (\xi_{-4} B)^{1/2} R_{\rm sh} / (T_4^2 R_{\rm ph}) \, \mathrm{[GeV]}, \end{eqnarray}](/articles/aa/full_html/2015/10/aa26478-15/aa26478-15-eq41.png) (2)where B is the magnetic field at the shock (measured in Gauss), and ξ = 10-4ξ-4 is the acceleration coefficient. The acceleration coefficient is defined by the acceleration time τacc = 1 E/ξ-4B. By comparing the above two formulae, we obtain
(2)where B is the magnetic field at the shock (measured in Gauss), and ξ = 10-4ξ-4 is the acceleration coefficient. The acceleration coefficient is defined by the acceleration time τacc = 1 E/ξ-4B. By comparing the above two formulae, we obtain  (3)In the same conditions protons with energy Ep (measured in units of GeV) can be accelerated with a timescale of
 ![Mathematical equation: \begin{eqnarray} \tau_{\rm acc,p}=1 E_{\rm p} /(\xi_{-4} B) = 0.34 \frac{E_{\rm p} R_{\rm sh}^2 (1+\cos\beta)}{E_{10} T_4^3 R_{\rm ph}^2}\,\mathrm{[s]}. \end{eqnarray}](/articles/aa/full_html/2015/10/aa26478-15/aa26478-15-eq47.png) (4)The acceleration can be limited by the dynamic timescale of td ~ 10 days (after which time most of the MAGIC observations were performed) or by the energy losses of protons from the pp collisions. The timescale of the latter can be computed as
(4)The acceleration can be limited by the dynamic timescale of td ~ 10 days (after which time most of the MAGIC observations were performed) or by the energy losses of protons from the pp collisions. The timescale of the latter can be computed as 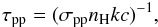 (5)where σpp ≈ 3 × 10-26 cm2 is the interaction cross section, nH is the density of the nova ejecta, the inelasticity coefficient, k ≈ 0.5, is the fraction of energy lost in each interaction, and c is the speed of light. The density of the ejecta decreases as the nova shock progresses with the speed of v = 103v3 km s-1, following
 ![Mathematical equation: \begin{eqnarray} n_{\rm H} = 4.4\times 10^{12} M_{-5} / \left(v_3^3 t_{\rm d}^3\right)~\mathrm{[cm^{-3}]}, \end{eqnarray}](/articles/aa/full_html/2015/10/aa26478-15/aa26478-15-eq55.png) (6)where 10-5M-5M⊙ is the total mass ejected during the outburst. Thus,
(6)where 10-5M-5M⊙ is the total mass ejected during the outburst. Thus, ![Mathematical equation: \begin{eqnarray} \tau_{\rm pp} = 500 \left(v_3^3 t_{\rm d}^3\right)/M_{-5} = 780~R_{\rm sh,13}^3/M_{-5}~\mathrm{[s]}, \end{eqnarray}](/articles/aa/full_html/2015/10/aa26478-15/aa26478-15-eq57.png) (7)where we used that Rsh = v(86400 td)≈ 8.6 × 1013 cm.
(7)where we used that Rsh = v(86400 td)≈ 8.6 × 1013 cm.
By comparing the acceleration and cooling timescales we obtain ![Mathematical equation: \begin{eqnarray} \label{eq:ep} E_{\rm p} = 2300 \frac{E_{10} T_4^3~R_{\rm ph,13}^2 R_{\rm sh,13}}{\left(1+\cos\beta\right)M_{-5}}~\mathrm{[GeV]}. \end{eqnarray}](/articles/aa/full_html/2015/10/aa26478-15/aa26478-15-eq60.png) (8)Using the parameters of the photosphere obtained by Metzger et al. (2015; see Table 1) a fortnight after the peak and taking the break in the GeV spectrum at ~1.6 GeV into account, it is plausible to expect protons to be accelerated at least up to energies of ~1.6 TeV. The maximum energy of the protons is expected to be lower, 1.1 TeV, in the case of the second set of photosphere parameters computed from the combined optical and UV fit.
(8)Using the parameters of the photosphere obtained by Metzger et al. (2015; see Table 1) a fortnight after the peak and taking the break in the GeV spectrum at ~1.6 GeV into account, it is plausible to expect protons to be accelerated at least up to energies of ~1.6 TeV. The maximum energy of the protons is expected to be lower, 1.1 TeV, in the case of the second set of photosphere parameters computed from the combined optical and UV fit.
Parameters characterizing the optical emission of V339 Del (photosphere temperature T4 × 104K, radius Rph,13 × 1013cm and luminosity L) according to the two scenarios assumed in the modelling of the GeV and TeV emission.
The acceleration can also be limited by the dynamic timescale instead of the hadronic interaction losses. By comparing the dynamic timescale with the proton cooling timescale, we find that the former only starts to dominate after  days. Therefore, the accelerated protons mostly cool down on the timescale of the MAGIC observations because of energy losses in hadronic interactions. The normalization of both components is determined by Lp/Le, i.e. the ratio of the total power of accelerated protons to that of electrons.
We used the numerical code of Sitarek & Bednarek (2012) to model the Fermi-LAT GeV spectrum and to compare the sub-TeV predictions with the MAGIC observations. We consider that the electrons and protons accelerated in Fermi-like acceleration obtain a power-law energy spectrum with a spectral index of 1.5. The spectra of electrons and protons cut off at energies determined by Eqs. (2) and (8), respectively. In Fig. 2 we show the predictions for leptonic or hadronic spectra compared with the Fermi-LAT and MAGIC measurements.
The Fermi-LAT spectrum can be described mostly by IC scattering of the thermal photons in the nova’s photosphere by electrons. The expected hadronic component overpredicts the MAGIC observations at ~100 GeV by a factor of a few for the case of equal power of accelerated protons and electrons (i.e. Lp = Le). Using the upper limits from the MAGIC observations, we can place a limit on Lp ≲ 0.15 Le. We checked that our results are unchanged when using radiation field parameters resulting in a significantly different emission in the UV range, which is not constrained by the observations of the V339 nova at the time of the MAGIC observations.
The increased power in electrons compared to protons may be related to how particles with different mass are injected in the acceleration process. Interestingly, the appearance of energetic e+e− pairs from nuclear decays produced in the nova explosion could help to inject them preferentially into the shock acceleration process. On the other hand, Schlickeiser (2003) suggests that in a low-beta plasma, acceleration of electrons is preferred over protons if the particles are accelerated out of a thermal population. Both effects could lower the Lp/Le ratio.
5. Conclusions
No VHE γ-ray emission was found from the direction of V339 Del. The contemporaneous Fermi-LAT observations revealed GeV emission from V339 Del. We modelled this GeV emission as the IC of thermal photons from the photosphere by the GeV electrons accelerated in the nova shock. We used the Fermi-LAT and MAGIC observations of V339 Del to constrain the number of protons accelerated in the same conditions as the electrons in the nova shock. The modelling shows that the total power of accelerated protons must be ≲15% of the total power of accelerated electrons. MAGIC will continue to observe promising γ-ray nova candidates in the coming years.
Online material
Appendix A: YY Her and ASASSN-13ax
Two additional objects, the symbiotic nova YY Her and dwarf nova ASASSN-13ax, were observed as part of the broader campaign, but neither was detected to have GeV or TeV emission. In this appendix we report the values of the differential upper limits from those two sources. The Fermi-LAT analysis was configured as described for V339 Del with the ROIs centred on the optical positions for YY Her and ASASSN-13ax. Data were selected within the time windows reported, preceding the optical peak and containing approximately the following two weeks of observations. The region model was derived from the 2FGL catalogue and contains all sources within 20° of the ROI centre. The spectra for YY Her and ASASSN-13ax were described using a power law with the photon index fixed to 2.2. The flux normalization for the source of interest and the normalization for the isotropic template were left free to vary, while the other source parameters were fixed either to catalogue values or refitted values if the source flux was detected in the analysis window and deviated by more than 1σ from the catalogue value. The upper limits were calculated at 95% C.L. using the Bayesian method provided with the Fermi Science Tools5.
The upper limits from MAGIC observations were computed in 5 bins per decade in energy. The photon spectral index assumed for both sources was 2.6.
YY Her is a symbiotic nova system that undergoes a recurrent pattern of outbursts. MAGIC observations of YY Her occurred on the night of April 22, seven days after the optical maximum. The observations were motivated by the symbiotic nature of the source. In the absence of detectable emission, flux upper limits at 95% C.L. were calculated to be 5.0 × 10⁻¹² ph cm-2 s-1 above 300 GeV. Emission was not detected in the LAT over the interval 2013 April 10 to April 30 (MJD 56 392.5 to 56 412.5). Upper limits at 95% C.L. were calculated to be 2.8 × 10⁻⁸ ph cm-2 s-1 above 100 MeV. Differential upper limits obtained from the Fermi-LAT and MAGIC observations of YY Her are summarized in Table A.1.
ASASSN-13ax is a member of a different class of cataclysmic variables, the dwarf novae, which are known for significantly weaker optical outbursts (typically 2–8 mag) than classical novae. The source was observed by MAGIC because of its very strong optical outburst of 7.7 mag (Stanek et al. 2013). Instead of undergoing a thermonuclear explosion on the surface of the WD, these outbursts are caused by the gravitational energy release from an instability in the accretion disk surrounding the WD. The MAGIC observations were performed on two consecutive nights starting on 2013 July 4, soon after the optical outburst seen on 2013 July 1. In the absence of detectable VHE emission, upper limits at 95% C.L. were calculated to be 1.5 × 10⁻¹² ph cm-2 s-1 above 300 GeV. Emission was not detected in the LAT over the interval 2013 June 25 to July 15
(MJD 56 468.5 to 56 488.5). Upper limits at 95% C.L. were calculated to be 1.6 × 10⁻⁸ ph cm-2 s-1 above 100 MeV. Differential upper limits obtained from the Fermi-LAT and MAGIC observations of ASASSN-13ax are summarized in Table A.2
Differential upper limits on the flux from YY Her as measured by the Fermi-LAT and MAGIC.
Differential upper limits on the flux from ASASSN-13ax as measured by the Fermi-LAT and MAGIC (see text for details).
The P7REP data, IRFs, and diffuse models (gll_iem_v05_rev1.fit and iso_source_v05.txt) are available at http://fermi.gsfc.nasa.gov/ssc
The source significance (in sigmas) is  assuming one degree of freedom.
Acknowledgments
The MAGIC Collaboration would like to thank the Instituto de Astrofísica de Canarias for the excellent working conditions at the Observatorio del Roque de los Muchachos in La Palma. The financial support of the German BMBF and MPG, the Italian INFN and INAF, the Swiss National Fund SNF, the ERDF under the Spanish MINECO, and the Japanese JSPS and MEXT is gratefully acknowledged. This work was also supported by the Centro de Excelencia Severo Ochoa SEV-2012-0234, CPAN CSD2007-00042, and MultiDark CSD2009-00064 projects of the Spanish Consolider-Ingenio 2010 programme, by grant 268740 of the Academy of Finland, by the Croatian Science Foundation (HrZZ) Project 09/176 and the University of Rijeka Project 13.12.1.3.02, by the DFG Collaborative Research Centers SFB823/C4 and SFB876/C3, and by the Polish MNiSzW grant 745/N-HESS-MAGIC/2010/0 and NCN 2011/01/B/ST9/00411. J.S. is supported by Fundacja UŁ. We thank M.A. Pérez-Torres for the information about nova ASASSN-13ax. The Fermi-LAT Collaboration acknowledges generous ongoing support from a number of agencies and institutes that have supported both the development and the operation of the LAT as well as scientific data analysis. These include the National Aeronautics and Space Administration and the Department of Energy in the United States, the Commissariat à l’Énergie Atomique and the Centre National de la Recherche Scientifique/Institut National de Physique Nucléaire et de Physique des Particules in France, the Agenzia Spaziale Italiana and the Istituto Nazionale di Fisica Nucleare in Italy, the Ministry of Education, Culture, Sports, Science and Technology (MEXT), High Energy Accelerator Research Organization (KEK) and Japan Aerospace Exploration Agency (JAXA) in Japan, and the K. A. Wallenberg Foundation, the Swedish Research Council and the Swedish National Space Board in Sweden. Additional support for science analysis during the operations phase is gratefully acknowledged from the Istituto Nazionale di Astrofisica in Italy and the Centre National d’Études Spatiales in France. Authors would like to thank S. N. Shore for scientific discussions and providing an optical spectrum of V339 Del and UV spectrum of OS And. We would also like to thank the anonymous referee for comments that helped to improve the paper.
References
- Abdo, A. A., Ackermann, M., Ajello, M., et al. 2010, Science, 329, 817 [NASA ADS] [CrossRef] [PubMed] [Google Scholar]
- Ackermann, M., Ajello, M., Albert, A., et al. 2014, Science, 345, 554 [NASA ADS] [CrossRef] [Google Scholar]
- Aleksić, J., Ansoldi, S., Antonelli, L. A., et al. 2016a, Astropart. Phys., 72, 61 [NASA ADS] [CrossRef] [Google Scholar]
- Aleksić, J., Ansoldi, S., Antonelli, L. A., et al. 2016b, Astropart. Phys., 72, 76 [NASA ADS] [CrossRef] [Google Scholar]
- Aliu, E., Archambault, S., Arlen, T., et al. 2012, ApJ, 754, 77 [NASA ADS] [CrossRef] [Google Scholar]
- Atwood, W. B., Abdo, A. A., Ackermann, M., et al. 2009, ApJ, 697, 1071 [NASA ADS] [CrossRef] [Google Scholar]
- Beardmore, A. P., Osborne, J. P., & Page, K. L. 2013, ATel, 5573 [Google Scholar]
- Bode, M. F., & Evans, A. 2008, Classical Novae, eds. M. F. Bode, & A. Evans, (Cambridge: Cambridge University Press), 2nd edn., Cambridge Astrophys. Ser., 43 [Google Scholar]
- Cheung, C. C., Jean, P., & Shore, S. N. 2013, ATel, 5653 [Google Scholar]
- Cheung, C. C., Jean, P., & Shore, S. N. 2014, ATel, 5879 [Google Scholar]
- Cheung, C. C., Jean, P., & Shore, S. N., 2015, ATel, 7283 [Google Scholar]
- Chomiuk, L., Linford, J. D., Yang, J., et al. 2014, Nature, 514, 339 [NASA ADS] [CrossRef] [PubMed] [Google Scholar]
- Denisenko, D., Jacques, C., Pimentel, E., et al. 2013, IAU Circ., 9258, 2 [NASA ADS] [Google Scholar]
- Fruck, C., Gaug, M., Zanin, R., et al. 2014, Proc. 33rd ICRC, Rio de Janeiro, Brazil [arXiv:1403.3591] [Google Scholar]
- Hays, E., Cheung, T., Ciprini, S., The Fermi LAT Collaboration 2013, ATel, 5302 [Google Scholar]
- Li, T.-P., & Ma, Y.-Q. 1983, ApJ, 272, 317 [NASA ADS] [CrossRef] [Google Scholar]
- Martin, P., & Dubus, G. 2013, A&A, 551, A37 [NASA ADS] [CrossRef] [EDP Sciences] [Google Scholar]
- Metzger, B. D., Finzell, T., Vurm, I., et al. 2015, MNRAS, 450, 2739 [NASA ADS] [CrossRef] [Google Scholar]
- Mattox, J. R., Bertsch, D. L., Chiang, J., et al. 1996, ApJ, 461, 396 [NASA ADS] [CrossRef] [Google Scholar]
- Ness, J. U., Schwarz, G. J., Page, K. L., et al. 2013, ATel, 5626 [Google Scholar]
- Nolan, P. L., Abdo, A. A., Ackermann, M., et al. 2012, ApJS, 199, 31 [NASA ADS] [CrossRef] [Google Scholar]
- Osborne, J. P., Page, K., Beardmore, A., et al. 2013, ATel, 5505 [Google Scholar]
- Page, K. L., & Beardmore, A. P. 2013, ATel, 5429 [Google Scholar]
- Rolke, W. A., López, A. M., & Conrad, J. 2005, Nucl. Instr. Meth. Phys. Res. A, 551, 493 [CrossRef] [Google Scholar]
- Schaefer, G. H., Brummelaar, T. T., Gies, D. R., et al. 2014, Nature, 515, 234 [NASA ADS] [CrossRef] [PubMed] [Google Scholar]
- Schlickeiser, R. 2003, Energy Conversion and Particle Acceleration in the Solar Corona, 612, 230 [Google Scholar]
- Shore, S. N., Wahlgren, G. M., Augusteijn, T., et al. 2011, A&A, 527, A98 [NASA ADS] [CrossRef] [EDP Sciences] [Google Scholar]
- Shore, S. N., Wahlgren, G. M., Augusteijn, T., et al. 2012, A&A, 540, A55 [NASA ADS] [CrossRef] [EDP Sciences] [Google Scholar]
- Shore, S. N., Schwarz, G. J., Alton, K., et al. 2013a, ATel, 5409 [Google Scholar]
- Shore, S. N., Skoda, P., Korcakova, D., et al. 2013b, ATel, 5312 [Google Scholar]
- Sitarek, J., & Bednarek, W. 2012, Phys. Rev. D, 86, 063011 [NASA ADS] [CrossRef] [Google Scholar]
- Stanek, K. Z., Shappee, B. J., Kochanek, C. S., et al. 2013, ATel, 5186 [Google Scholar]
- Starrfield, S., Iliadis, C., Timmes, F. X., et al. 2012, BASI, 40, 419 [NASA ADS] [Google Scholar]
- Tatischeff, V., & Hernanz, M. 2007, ApJ, 663, L101 [NASA ADS] [CrossRef] [Google Scholar]
- Woudt, P. A., & Ribiero, V. A. R. M. 2014, Stella Novae: Past and Future Decades, ASP Conf. Ser., 490 [Google Scholar]
- Zanin, R., Carmona, E., Sitarek, J., et al. 2013, Proc. 33rd ICRC, Rio de Janeiro, Brazil, 773 [Google Scholar]
All Tables
Parameters characterizing the optical emission of V339 Del (photosphere temperature T4 × 104K, radius Rph,13 × 1013cm and luminosity L) according to the two scenarios assumed in the modelling of the GeV and TeV emission.
Differential upper limits on the flux from YY Her as measured by the Fermi-LAT and MAGIC.
Differential upper limits on the flux from ASASSN-13ax as measured by the Fermi-LAT and MAGIC (see text for details).
All Figures
|
Fig. 1 Multiwavelength light curve of V339 Del during the outburst in August 2013. Top panel: optical observations in the V band obtained from the AAVSO-LCG4 service. Middle panel: the Fermi-LAT flux (filled symbols) and upper limits (empty symbols) above 100 MeV in one-day (circles, thin lines) or three-day (squares, thick lines) bins. A 95% C.L. flux upper limit is shown for time bins with TS < 4. Bottom panel: upper limit on the flux above 300 GeV observed with MAGIC telescopes. The grey band shows the observation nights with MAGIC. The dashed grey line shows a MAGIC observation night affected by bad weather. |
| In the text | |
|
Fig. 2 Differential upper limits on the flux from V339 Del as measured by MAGIC (filled squares) and the flux measured by Fermi-LAT (empty crosses) in the same time period, 2013 August 25 to September 4. The thin solid line shows the IC scattering of thermal photons in the nova’s photosphere. The dashed line shows the γ-rays coming from the decay of π0 from hadronic interactions of the relativistic protons with the nova ejecta. The dotted line shows the contribution of γ-rays coming from IC of e+e− originating from π+π− decays. Thick solid lines show the total predicted spectrum. The total energy of electrons is 6 × 1041 erg and the assumed proton to electron luminosity ratio is Lp/Le = 0.1. Electrons and protons are injected with a power law with a spectral index of 1.5 and the cut-offs reported in the figures. Photosphere parameters (see Table 1) obtained from Metzger et al. (2015). |
| In the text | |
Current usage metrics show cumulative count of Article Views (full-text article views including HTML views, PDF and ePub downloads, according to the available data) and Abstracts Views on Vision4Press platform.
Data correspond to usage on the plateform after 2015. The current usage metrics is available 48-96 hours after online publication and is updated daily on week days.
Initial download of the metrics may take a while.