Fig. 2
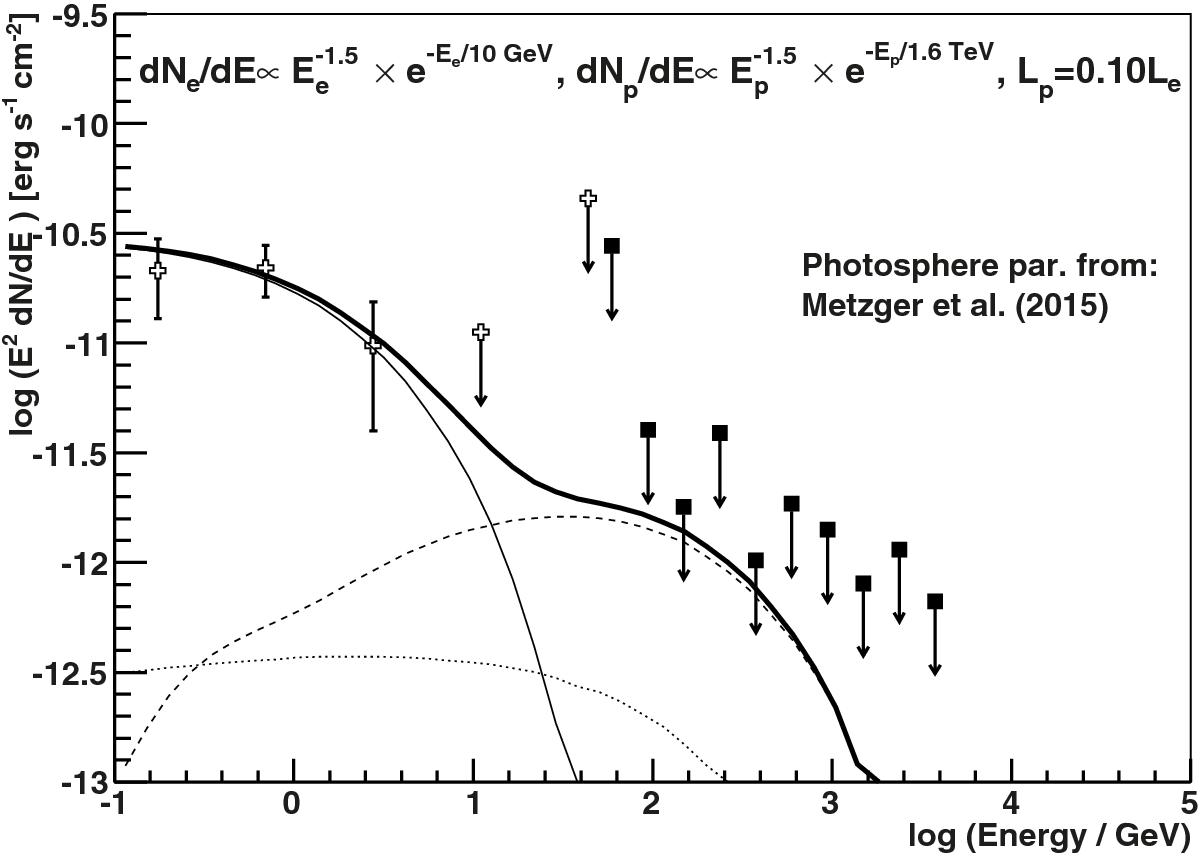
Differential upper limits on the flux from V339 Del as measured by MAGIC (filled squares) and the flux measured by Fermi-LAT (empty crosses) in the same time period, 2013 August 25 to September 4. The thin solid line shows the IC scattering of thermal photons in the nova’s photosphere. The dashed line shows the γ-rays coming from the decay of π0 from hadronic interactions of the relativistic protons with the nova ejecta. The dotted line shows the contribution of γ-rays coming from IC of e+e− originating from π+π− decays. Thick solid lines show the total predicted spectrum. The total energy of electrons is 6 × 1041 erg and the assumed proton to electron luminosity ratio is Lp/Le = 0.1. Electrons and protons are injected with a power law with a spectral index of 1.5 and the cut-offs reported in the figures. Photosphere parameters (see Table 1) obtained from Metzger et al. (2015).
Current usage metrics show cumulative count of Article Views (full-text article views including HTML views, PDF and ePub downloads, according to the available data) and Abstracts Views on Vision4Press platform.
Data correspond to usage on the plateform after 2015. The current usage metrics is available 48-96 hours after online publication and is updated daily on week days.
Initial download of the metrics may take a while.