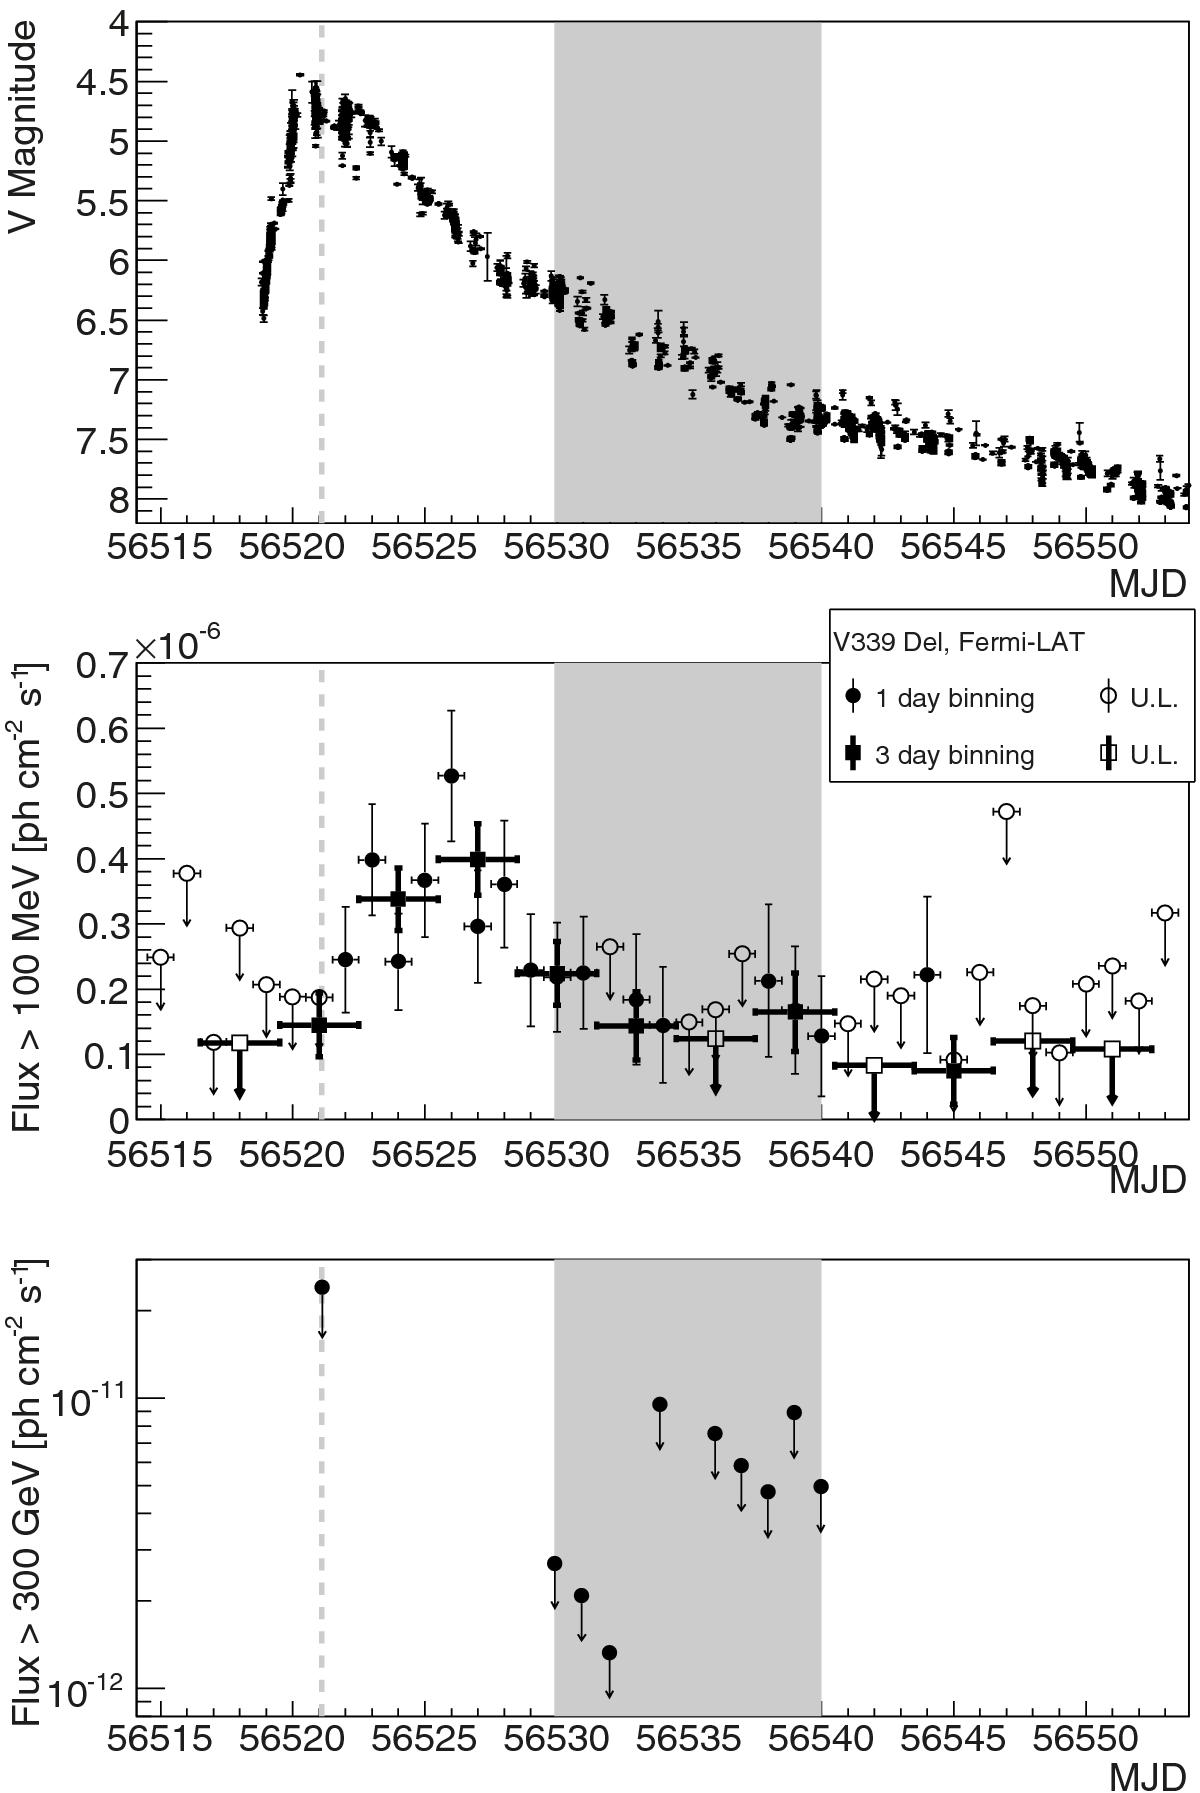
Fig. 1

Multiwavelength light curve of V339 Del during the outburst in August 2013. Top panel: optical observations in the V band obtained from the AAVSO-LCG4 service. Middle panel: the Fermi-LAT flux (filled symbols) and upper limits (empty symbols) above 100 MeV in one-day (circles, thin lines) or three-day (squares, thick lines) bins. A 95% C.L. flux upper limit is shown for time bins with TS < 4. Bottom panel: upper limit on the flux above 300 GeV observed with MAGIC telescopes. The grey band shows the observation nights with MAGIC. The dashed grey line shows a MAGIC observation night affected by bad weather.
Current usage metrics show cumulative count of Article Views (full-text article views including HTML views, PDF and ePub downloads, according to the available data) and Abstracts Views on Vision4Press platform.
Data correspond to usage on the plateform after 2015. The current usage metrics is available 48-96 hours after online publication and is updated daily on week days.
Initial download of the metrics may take a while.


