Fig. A.1
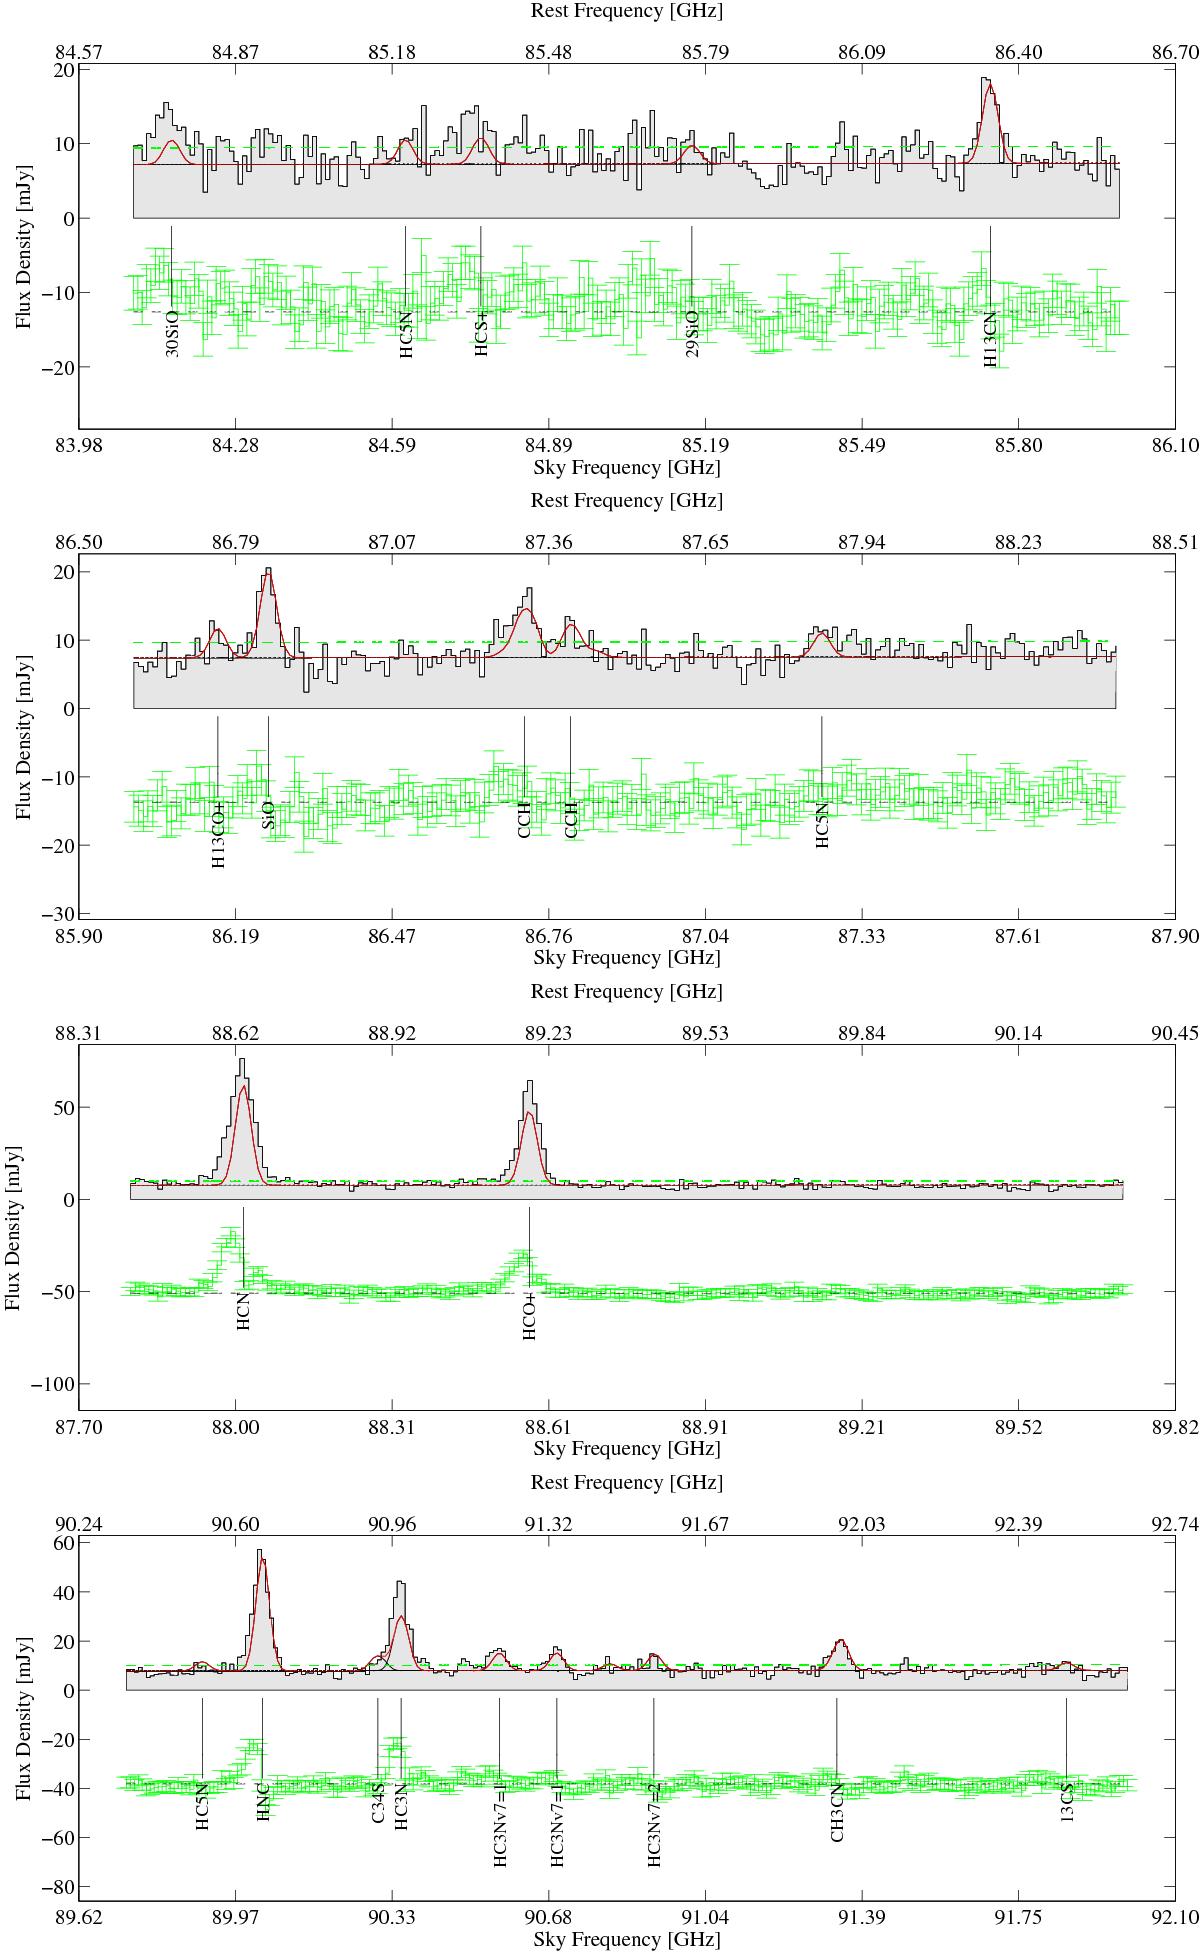
The ALMA spectral scan of NGC 4418. The data are shown as a shaded histogram plot, the best fit for each molecule is shown as solid black lines. The total fit to the data is shown as a red solid line. The 1σ level is shown as a dashed green line. The residuals, together with the data rms, are shown below the spectrum as a green histogram plot with error bars. Emission lines above 3σ are labeled.
Current usage metrics show cumulative count of Article Views (full-text article views including HTML views, PDF and ePub downloads, according to the available data) and Abstracts Views on Vision4Press platform.
Data correspond to usage on the plateform after 2015. The current usage metrics is available 48-96 hours after online publication and is updated daily on week days.
Initial download of the metrics may take a while.