| Issue |
A&A
Volume 582, October 2015
|
|
|---|---|---|
| Article Number | A91 | |
| Number of page(s) | 33 | |
| Section | Extragalactic astronomy | |
| DOI | https://doi.org/10.1051/0004-6361/201526256 | |
| Published online | 15 October 2015 | |
Online material
Appendix A: Fit details for individual molecules
13CO, C18O: carbon monoxide was detected in the J = 1−0 transitions of the two isotopic variants 13CO and C18O. The latter is only a tentative detection, the peak flux being only at the two-sigma level. Since we only detected one line per species, we could not fit an excitation temperature to the emission. By fixing the excitation temperature to 70 K, which is the lower limit to the CO J = 2−1 brightness temperature detected by Costagliola et al. (2013), a column density on the order of 1018 and 1017 cm-2 is found for 13CO and C18O, respectively.
CS,13CS, C33S, C34S: we detect the J = 2−1 and J = 6−5 rotational transitions of carbon monosulfide and its 13C, 33S, and 34S isotopic variants. For CS, the population diagram analysis and the LTE fit both find an excitation temperature of ~20 K, and a column density of 6 ± 0.6 × 1016 cm-2. In order to calculate isotopic ratios, we fix the excitation temperature of the isotopic variants at 20 K. This implies the emission to be co-spatial and the excitation to be similar for all isotopic variants. Under this assumption, the LTE fit gives column densities on the order of 1015 cm-2 for 13CS and C33S, and on the order of 1016 cm-2 for C34S. An NLTE fit of CS emission was also performed. We find that the emission is best fit by a model with hydrogen density n(H2) = 105 cm-3, kinetic temperature Tkin = 50 K, and column density N = 4 × 1017 cm-2. The NLTE values for Tkin and N are significantly higher than the LTE results. This may be due to the high critical density of the J = 6−5 line, which would require n(H2)> 107 cm-3 to be efficiently excited by collisions.
CN: we detect the CN multiplet at 3 mm, including nine merged lines spanning from 113.12 to 113.52 GHz in rest frequency. The lines have very similar upper-state energies (~5 K) and do not permit a reliable fit. In order to obtain a lower limit to the molecule’s column density, we performed an LTE fit with a fixed temperature of Tex = 70 K. The resulting column is N ~ 5×1017 cm-2. As discussed for 13CO and C18O, the Tex value was chosen as the lower limit to the observed CO brightness temperature.
NS: we detect the strongest lines of the J = 11/2–9/2 multiplet of nitric sulfide at rest frequencies 253.57−255.6 GHz. Even if so close in frequency, the detected lines span a wide interval in upper state energies (Eu = 40−360 K). We derive an excitation temperature of Tex = 350 ± 150 and a column density of N = 8 ± 4×1016 cm-2. The large uncertainties on the derived quantities are due to the line blending in band 6.
SO,34SO: emission from sulfur monoxide is heavily blended, the only sure detections being the lines 32–21 (99.3 GHz), 23–12 (109.25 GHz), and 66–55 (258.255). Because of the strong blending, the χ2 surface of our LTE fit is not well defined, giving only a lower limit for the excitation temperature of Tex> 20 K. The fitted value for the column density is relatively well defined, N = 4 ± 3×1015 cm-2. We also performed a NLTE fit of the isolated lines, resulting in hydrogen densities between 106 and 107 cm-3, kinetic temperatures of 50−200 K, and column densities from 2×10¹⁵ to 2×1016 cm-2. The isotopic variant 34SO is only tentatively detected as two highly blended lines at 251.4 and 255.1 GHz. The LTE fit with a fixed excitation temperature of 20 K results in a poorly constrained column density of 1015–1016 cm-2.
SiO,29SiO, 30SiO: strong silicon monoxide emission is detected in band 3 (J = 2−1) and band 6 (J = 5−4). The two rotational lines are free of blending and well identified. Our LTE fit gives an excitation temperature of 10 ± 5 K and a column density of 3 ± 1×1015 cm-2, comparable with those found with the population diagram analysis. The NLTE fit results in an hydrogen density lower than 106 cm-3, a kinetic temperature greater than 20 K, and a column density greater than 1016 cm-2. We also detect the isotopic variants 29SiO and 30SiO. The emission lines from these two species are strongly blended, but still clearly identified. In our LTE fit we fix their excitation temperature to that of SiO, i.e., Tex = 10 K. The resulting column density estimation is on the order of 1015 cm-2, with large uncertainties (>50%) due to the line blending.
HCN, H13CN: hydrogen cyanide is detected in its J = 1−0 and J = 3−2 transitions. The J = 3−2 line is the strongest molecular line detected in our scan, with an integrated flux density of 50 ± 5 Jy km s-1, and a peak brightness temperature of 35 K. Both emission lines have FWHM> 140 km s-1, broader than than the average 120 km s-1 assumed in our fit. The derived properties are thus representative only of the line core. The LTE fit gives Tex = 7 ± 1 K and N = 2 ± 1×1016 cm-2, while the NLTE analysis results in a hydrogen density lower than 106 cm-3, Tkin> 100, and N> 1016 cm-2. The large discrepancy in excitation temperature between the two fitting methods is most likely due to a limitation of the LTE fit, which gives unreliable results for high opacities. An excitation temperature of 8 K seems too low when compared with the CO brightness temperature of >70 K reported by Sakamoto et al. (2013) and Costagliola et al. (2013), and may be an indication of sub-thermal excitation of HCN. The brightness temperature for a source size of 0.̋4 is ~35 K and ~65 K for the two lines respectively (see Table 2). This sets a lower limit for the excitation temperature of the molecule, and thus to the kinetic temperature of the gas, of at least 65 K. For these reasons, we will assume the NLTE fit to best represent the HCN emission in NGC 4418.
The H13CN J = 1−0 line was also detected. A column density estimate of 2 ± 1×1015 cm-2 was obtained by fixing the excitation temperature at 7 K. If we assume an extragalactic 12C/13C ratio between 40 and 100 (Henkel et al. 2014), this correspond to a column densities of HCN of (0.8–2) × 1017 cm-2.
HNC, HN13C: we detect the J = 1−0 and J = 3−2 rotational transitions of hydrogen isocyanide. Both the population diagram analysis and the LTE fit of the total spectrum result in an excitation temperature of 8−9 K, and column densities in the range 3−8×1015 cm-2. An NLTE fit of the emission was also performed, resulting in an hydrogen density <106 cm-3, a kinetic temperature greater than 100 K, and a column density >1016 cm-2. The results of the LTE and NLTE fitting of HCN and HNC are very similar, including the discrepancy of the fitted excitation temperatures for the two methods. The LTE fit results in very low Tex , lower than the brightness temperature of the two detected lines of HNC (Tb = 45 K and 30 K for the J = 1−0 and J = 3−2 transitions, respectively). The NLTE fit results in Tex≃ 40 K, which is consistent with the brightness temperature of the lines for the assumed source size of 0.̋4. The J = 1−0 transition of HN13C is also detected. The LTE fit with a fixed excitation temperature of 8 K results in a column density of 1.5 ± 0.5×1015 cm-2.
HCN, v2 = 1, HNC, v2 = 1: vibrationally excited HCN and HNC are tentatively detected in our scan. For each molecule we only detect the J = 3−2, v2 = 1f transitions, therefore we cannot produce a reliable fit to the rotational temperature. However, we can derive the vibrational temperature by comparing the intensity of the J = 3−2 transitions of both the v2 = 1 and v = 0 states. We find that the relative population of the v2 = 1 and v = 0 states is well described by a vibrational temperature of ~350 K for HCN and 450 K for HNC. When assuming these temperatures to be also the rotational excitation temperatures of the v2 = 1 emission, we obtain line intensities which are consistent with the observed spectrum.
HCO+, H13CO+, HC18O+: the J = 1−0 and J = 3−2 transitions of HCO+ (formylium) are detected in band 3 and band 6, respectively. The population diagram analysis and the LTE model fit result in an excitation temperature of 6−8 K and a column density of 1−6×1015 cm-2. The RADEX models that best fits the emission have n(H2)<6 × 105 cm-3, Tkin> 100 K, and N> 1016 cm-2. For HCO+ we find the same discrepancy between the LTE and NLTE fitted excitation temperatures that we discuss in the HCN and HNC case. The NLTE fit provides more physically reasonable results, consistent with an observed brightness temperature of the lines of >20 K (see Table 2).
We also detect the J = 1−0 emission line of H13CO+. By fixing the excitation temperature of the molecule at 6 K, we obtain an LTE estimate of the column density of N(H13CO+) = 7 ± 4×1014 cm-2. If we assume an extragalactic 12C/13C ratio between 40 and 100 (Henkel et al. 2014), this corresponds to a column density of HCO+ of (0.8–2) × 1017 cm-2.
The HC18O+, J = 3−2 transition is tentatively detected in band 6, with heavy blending. The LTE fit is highly degenerate, and only results in an upper limit of 20 K for the excitation temperature and a lower limit to the column density of 1014 cm-2.
H2S: at least 6 transitions of hydrogen sulfide are included in the scan, but only one transition (2(2,0)–2(1,1) at 216.71 GHz) is free of blending and clearly identified. By fixing the excitation temperature of H2S at 70 K, the LTE fit results in a column density of 1 ± 0.5×1017 cm-2.
CCH: we detect the N = 1−0 multiplet of ethynyl at rest frequencies between 87.28 and 87.45 GHz (sky frequency ~86.76 GHz). The 6 lines have very similar upper state energies (~4 K) and thus do not allow an accurate fit of the excitation temperature. By fixing Tex = 70 K we obtain an LTE estimate of the column density of 2 ± 1×1017 cm-2.
HCS+: the J = 2−1 and J = 6−5 rotational transitions of HCS+ (thioformylium) are detected in band 3 and band 6, respectively. The 1 mm line is heavily blended with emission from vibrationally excited HC3N, while the 3 mm line is free of blending. The emission can be reproduced by our LTE model with Tex = 20 ± 10 K and N = 8 ± 4×10¹⁵.
CCS: we detect 6 emission lines of thioxoethenylidene, with upper energy levels ranging from 20 to 110 K. The emission is free of blending and is well fit by our LTE model. The best fit values are Tex = 20 ± 10 K and N = 1.5 ± 0.5×1016 cm-2.
N2H+: we detect the J = 1−0 triplet at 93.17 GHz and the J = 3−2 line of N2H+ (diazenylium). The triplet emission is totally blended, but free of contamination from other species. The LTE and NLTE fit procedures give very similar results (see Table 4) with Tex~ 30 K and N ~ 5×1015 cm-2. The best fit hydrogen density in our NLTE analysis is 107 cm-3, which is higher than the critical density of the detected transitions (nc ~ 105–106 cm-3), and the Tkin and Tex coincide for both lines. We conclude that the RADEX best fit represents an LTE excitation of the molecule.
H2CO: we detect eight transitions of formaldehyde, four from para-H2CO and four from ortho-H2CO. The LTE fit for both species results in an excitation temperature of 350 ± 100 K and column a column density of 5−8×1016 cm-2. The NLTE analysis results in an hydrogen density of 105 cm-3, a kinetic temperature greater than 300 K and a column density of 7×10¹⁵–1016 cm-2. In our NLTE fit we only obtain a lower limit to the kinetic temperature because the LAMBDA database does not contain collision coefficients for temperatures greater than 300 K.
c-HCCCH: we detect 15 emission lines of cyclopropenylidene at the 3σ level across ALMA bands 3 and 6. The detected lines have upper state energies ranging from 40 to 500 K. The LTE model well fits the emission, resulting in an excitation temperature of 180 ± 100 K and a column density of 1 ± 0.5×1017 cm-2. The large uncertainties are mostly due to the blending in band 6.
H2CS, H![]() CS: three isolated emission lines of thioformaldehyde are detected at sky frequencies 103.89, 268.66, and 276.95 GHz. Three more lines from H
CS: three isolated emission lines of thioformaldehyde are detected at sky frequencies 103.89, 268.66, and 276.95 GHz. Three more lines from H![]() CS are tentatively detected (~ 2σ) in band 3. The detected transitions of H2CS have upper state energies ranging from 20 to 70 K. The LTE fit results in an excitation temperature of 35 ± 10 K and a column density of 1 ± 0.5×1016 cm-2. By fixing the excitation temperature at 35 K we derive an upper limit for the column density of H
CS are tentatively detected (~ 2σ) in band 3. The detected transitions of H2CS have upper state energies ranging from 20 to 70 K. The LTE fit results in an excitation temperature of 35 ± 10 K and a column density of 1 ± 0.5×1016 cm-2. By fixing the excitation temperature at 35 K we derive an upper limit for the column density of H![]() CS of 5 ± 2×1015 cm-2.
CS of 5 ± 2×1015 cm-2.
HC3N, H13CCCN, HCC13CN: we detect bright cyanoacetylene emission in all three ALMA bands. Nine isolated lines are detected, with upper state angular momentum ranging from 10 to 32, and upper state energies from 24 to 230 K (see Table 2). The population diagram analysis and the LTE fit of the whole spectrum give an excitation temperature of ~70 K and column densities in the range 2−9×1016 cm-2 (see Tables 2, 4). The H13CCCN and HCC13CN isotopomers are also detected in all three bands, for a total of nine isolated emission lines with upper state energies ranging from 20 to 240 K. We performed an LTE fit of both species, assuming the same excitation temperature of 70 K as HC3N. The fitted column densities are very similar, in the range of 1−2×1015 cm-2, with uncertainties on the order of 50%.
Vibrationally excited HC3N: emission from vibrationally excited HC3N dominates the mm-wave spectrum of NGC 4418. We detect rotational transitions from the four vibrationally excited states HC3N, v6 = 1, HC3N, v7 = 1, HC3N, v6 = 1, v7 = 1, and HC3N, v7 = 2, for a total of 25 transitions. The upper state energies of such vibrationally excited lines are very high, ranging from 300 to 900 K. The emission from all four species is well fitted by our LTE model and by the rotational diagram analysis. We find similar excitation temperatures, in the range 70−100 K, and column densities ranging from 1015−1016 cm-2. From the relative population of the vibrational levels it is possible to derive the vibrational temperature of the molecule via a population diagram analysis. The results are reported in Fig. 4. We are able to derive the vibrational temperature of three different angular momentum states (J = 10, 11, 12) for which emission of more than two vibrational states was detected. The three fits give remarkably similar results, with vibrational temperatures ranging from 330 to 400 K.
CH2NH: we identify three spectral features as emission from methanimine at rest frequencies 105.79, 257.11, and 266.27 GHz, with upper state energies ranging from 30 to 60 K. The LTE fit of the spectrum results in an excitation temperature of 45 ± 30 K and a column density of 1.5 ± 0.5×1017 cm-2.
NH2CN: emission from cyanamide is tentatively detected in NGC 4418. Only one isolated line at sky frequency 98.62 GHz is unambiguously identified as the NH2CN J = 5−4 transition, while most emission across the observed ALMA bands is heavily blended. Our LTE fit results in an excitation temperature of 30 ± 20 K and a column density of 5 ± 2×1015 cm-2. However, the derived parameters are highly uncertain because of the blending of the lines at 1 mm.
CH3CN: bright emission from methyl cyanide is detected as four line forests at sky frequencies 91.3−91.35, 109.56−109.62, 254.87−255.78, 292.11−292.28 GHz. The detected lines have upper state energies ranging from 13 to 500 K, with bright emission from lines with Eup> 200 K. The LTE fit results in a very high excitation temperature of 1000 K, but does not reproduce the intensity of the lines at 3 mm. The NLTE procedure provides a better fit of the emission across all three ALMA bands, resulting in a low hydrogen density of 104 cm-3, and a high kinetic temperature >500 K, required in order to fit the high energy lines. The critical density of the observed transitions varies between 105 cm-3 for the lines at 3 mm, and 107 cm-3 for the lines at 1 mm. It appears that the only way to fit both the 3 mm and the high-energy 1 mm lines is to lower the hydrogen density until the 3 mm lines are not efficiently excited by collisions (n(H2) <nc, i.e., they are not at LTE). This could imply that CH3CN emission is originating from a gas phase that is significantly more diffuse than for the other molecular tracers, or that the low- and high-excitation lines are emerging from different environments.
CH3CCH: methyl acetylene is tentatively detected in NGC 4418. The emission is heavily bended and no isolated line can be identified. Emission from the molecule is required in order to fit the line forests at sky frequencies 254−254.6, 271.2−271.6, and 288−288.6 GHz. The LTE fit results in an excitation temperature of 350 ± 100 K, and a column density
of 1 ± 0.5×10¹⁶. We advise extreme caution when interpreting these results, since the strong blending makes the fit highly degenerate.
HC5N: emission from cyanobutadiyne is required in order to explain 11 spectral features across all three ALMA bands, which could not be associated with any other molecule. Nine of the detected lines are isolated lines free of blending with other species. The upper state angular momentum of the detected transitions ranges from 32 to 42, corresponding to energies above ground of 65 to 85 K. The population analysis and the LTE fit of the whole spectrum result in an excitation temperature of 60−70 K, and column densities in the range 0.5−2 × 1016 cm-2.
CH3OH: methanol emission is needed in order to fit the highly blended region between sky frequencies 287.8 and 288.3 GHz. No other transition from the molecule is detected above the 3σ level across the whole observed frequency range. The NLTE fit results in a kinetic temperature of 100 ± 60 K and a column density of 2 ± 1×1016 cm-2, for an hydrogen density of 107 cm-3. The fit is poorly constrained because of line confusion. Non-LTE excitation of methyl acetylene could give a significant contribution to the emission in this region, thus the derived column density of CH3OH should be considered as an upper limit.
 |
Fig. A.1
The ALMA spectral scan of NGC 4418. The data are shown as a shaded histogram plot, the best fit for each molecule is shown as solid black lines. The total fit to the data is shown as a red solid line. The 1σ level is shown as a dashed green line. The residuals, together with the data rms, are shown below the spectrum as a green histogram plot with error bars. Emission lines above 3σ are labeled. |
| Open with DEXTER | |
 |
Fig. A.1
continued. |
| Open with DEXTER | |
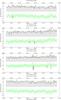 |
Fig. A.1
continued. |
| Open with DEXTER | |
 |
Fig. A.1
continued. |
| Open with DEXTER | |
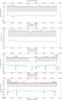 |
Fig. A.1
continued. |
| Open with DEXTER | |
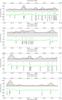 |
Fig. A.1
continued. |
| Open with DEXTER | |
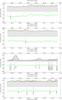 |
Fig. A.1
continued. |
| Open with DEXTER | |
 |
Fig. A.1
continued. |
| Open with DEXTER | |
|
Fig. A.1
continued. |
|
| Open with DEXTER | |
Molecular lines detected above the three-sigma level.
Base-ten logarithm of molecular abundances in Galactic and extragalactic sources.
|
Fig. A.2
Comparison of our ALMA data with single-dish spectra of the brightest lines in the scan. The blue line shows the spectrum extracted from the ALMA visibilities by fitting a point source with the CASA routine uvmultifit. The black line shows single dish spectra observed by the authors with the IRAM 30 m telescope. The error bars show the squared sum of the rms of the two datasets. The spectra were interpolated to a common resolution of 28 and 19.5 MHz at 3 and 1 mm, respectively. |
|
| Open with DEXTER | |
|
Fig. A.3
Comparison of our ALMA data with SMA observations by Costagliola et al. (2013). The blue line shows the spectrum extracted from the ALMA visibilities by fitting a point source with the CASA routine uvmultifit. The black line shows the flux density measured by the extended configuration of the SMA, with a beam size of 0.̋4 and a maximum recoverable scale of 2′′. The error bars show the squared sum of the rms of the two datasets. The spectra were interpolated to the resolution of the ALMA spectral scan. |
|
| Open with DEXTER | |
Integrated flux densities from pre-ALMA observations.
© ESO, 2015
Current usage metrics show cumulative count of Article Views (full-text article views including HTML views, PDF and ePub downloads, according to the available data) and Abstracts Views on Vision4Press platform.
Data correspond to usage on the plateform after 2015. The current usage metrics is available 48-96 hours after online publication and is updated daily on week days.
Initial download of the metrics may take a while.